
Pi Network Price Forecast: Bulls extend recovery on strong retail demand
작성자 Vishal Dixit
수정됨: 6 Mar 2026


인기 기사

Pi Network (PI) trades around $0.2000 at press time on Friday, extending gains for the fifth consecutive day, totaling roughly 20% up so far this week. The steady recovery is supported by rising retail demand, as evidenced by massive withdrawals from Centralized Exchanges (CEXs).
- Pi Network hovers above $0.20 on Friday, extending its recovery for the fifth consecutive day.
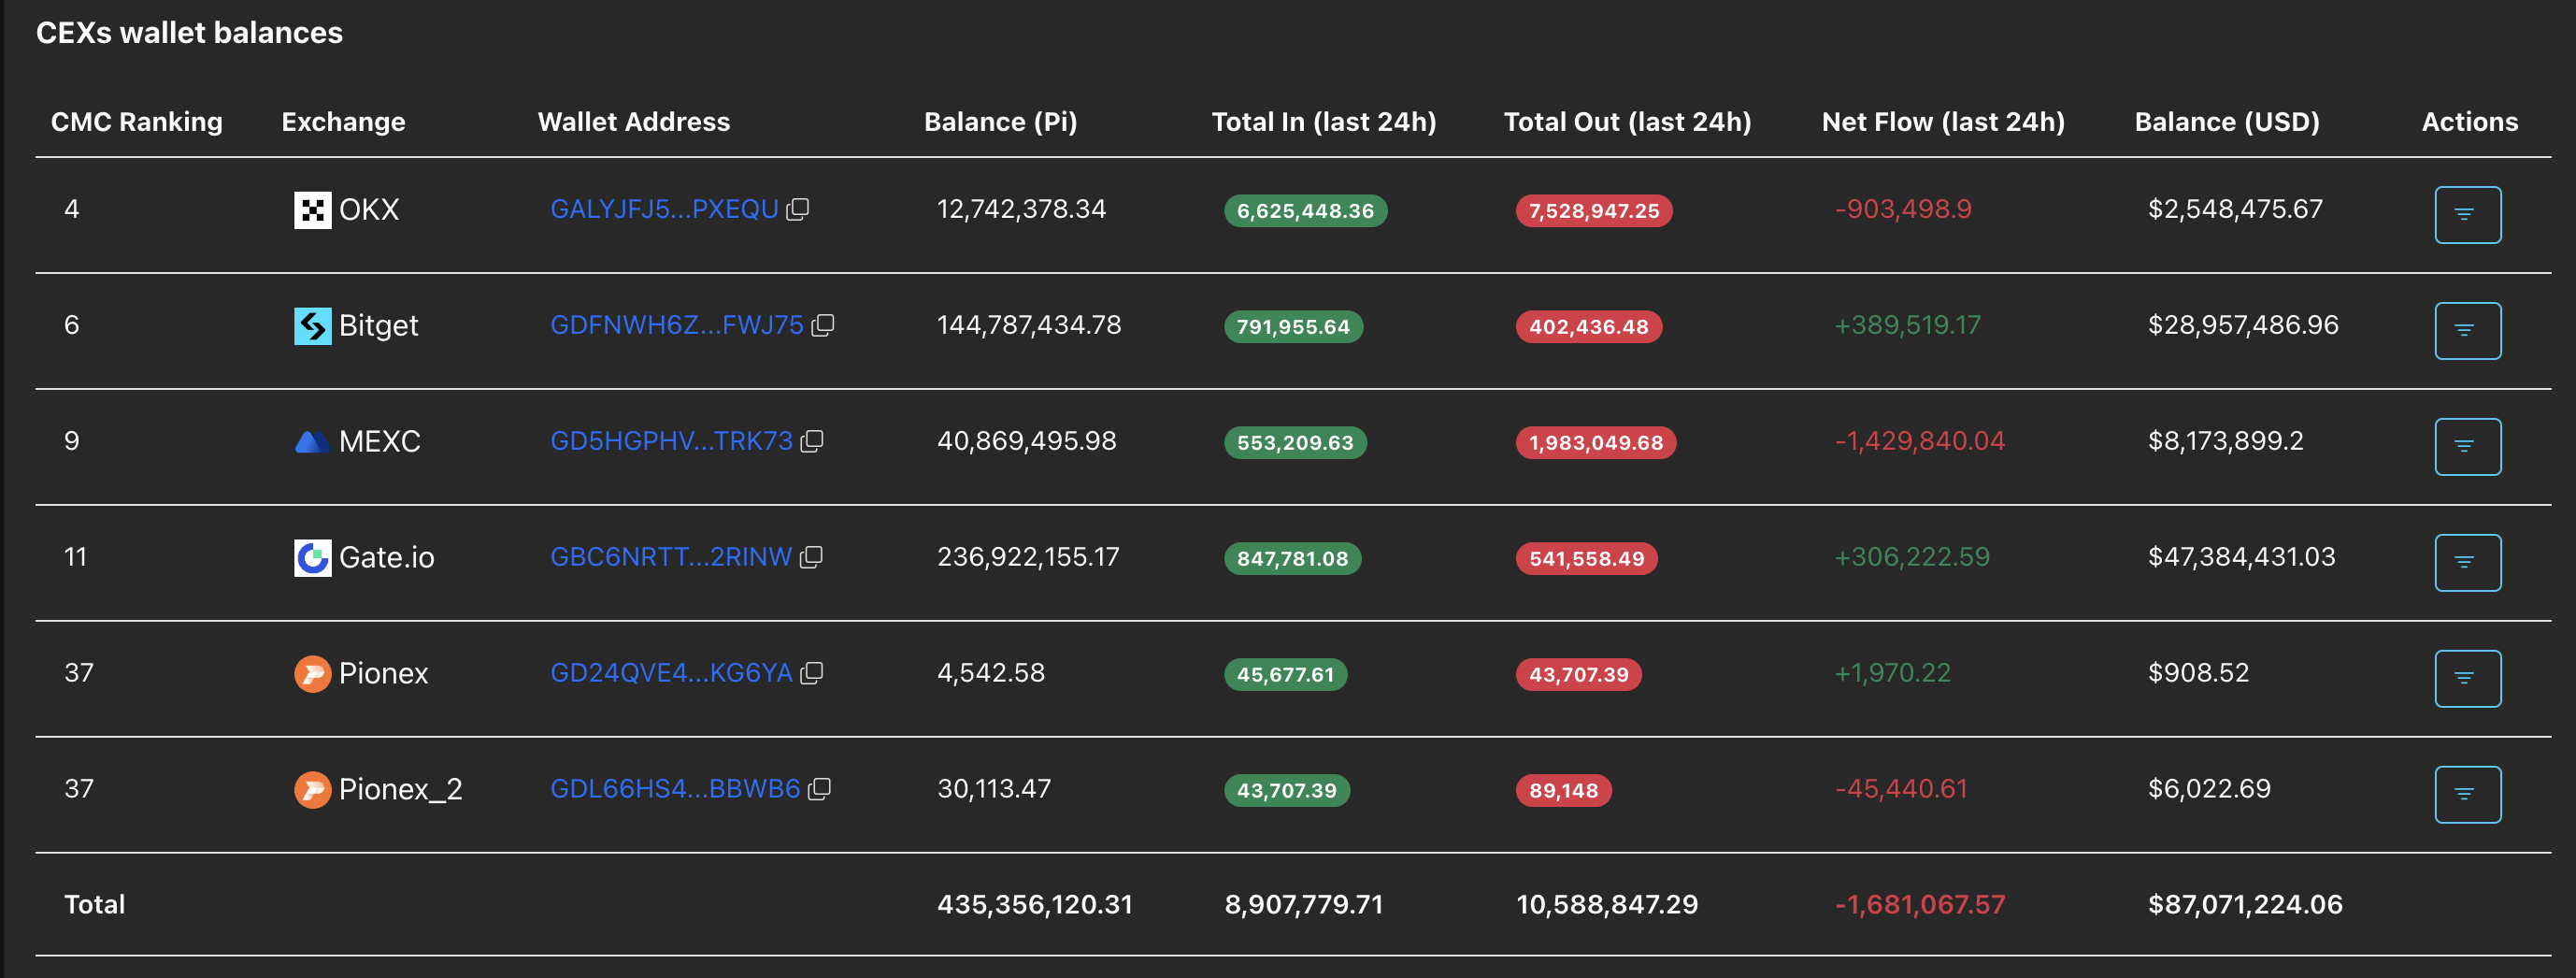
- PiScan data shows roughly 1.70 million PI tokens withdrawn from exchanges in the last 24 hours, suggesting intense retail demand.
- The technical outlook for PI is bullish as it tests the waters above the long-term descending trendline near the 100-day EMA.
Pi Network (PI) trades around $0.2000 at press time on Friday, extending gains for the fifth consecutive day, totaling roughly 20% up so far this week. The steady recovery is supported by rising retail demand, as evidenced by massive withdrawals from Centralized Exchanges (CEXs). The technical outlook is bullish as PI tests the zone above the $0.2000 psychological level.
Retail demand grows strong
Pi Network sees a surge in retail interest, prompting massive withdrawals from exchanges. PiScan data shows CEXs' supply dropped by 1.68 million PI tokens over the last 24 hours, reducing selling pressure and indicating rising investor demand. Consistent outflows from CEXs support market recovery ahead of Pi Day, coming on March 14. A similar recovery was observed a week before the Pi Network’s first anniversary as an Open Network, which was on February 20.
Technical outlook: Will Pi Network extend its rally above $0.20?
Pi Network is up 2% at press time on Friday, maintaining a streak of four bullish closes so far this week, for roughly 20% gains. The near-term bias for PI is cautiously bullish as it tests the zone above a long-running descending resistance trendline connecting the August 30 and November 24 highs, signaling a shift away from the prior downtrend.
If PI holds a decisive close above the 100-day Exponential Moving Average at $0.1960, it would confirm an upside breakout of this descending trendline.
The Moving Average Convergence Divergence (MACD) stays above its signal line on the daily chart, in positive territory as green histogram bars expand, suggesting an increase in bullish impulse. The Relative Strength Index (RSI) at 70 signals overbought conditions, indicating buyers are in complete control, but risk losing traction at oversaturated levels.
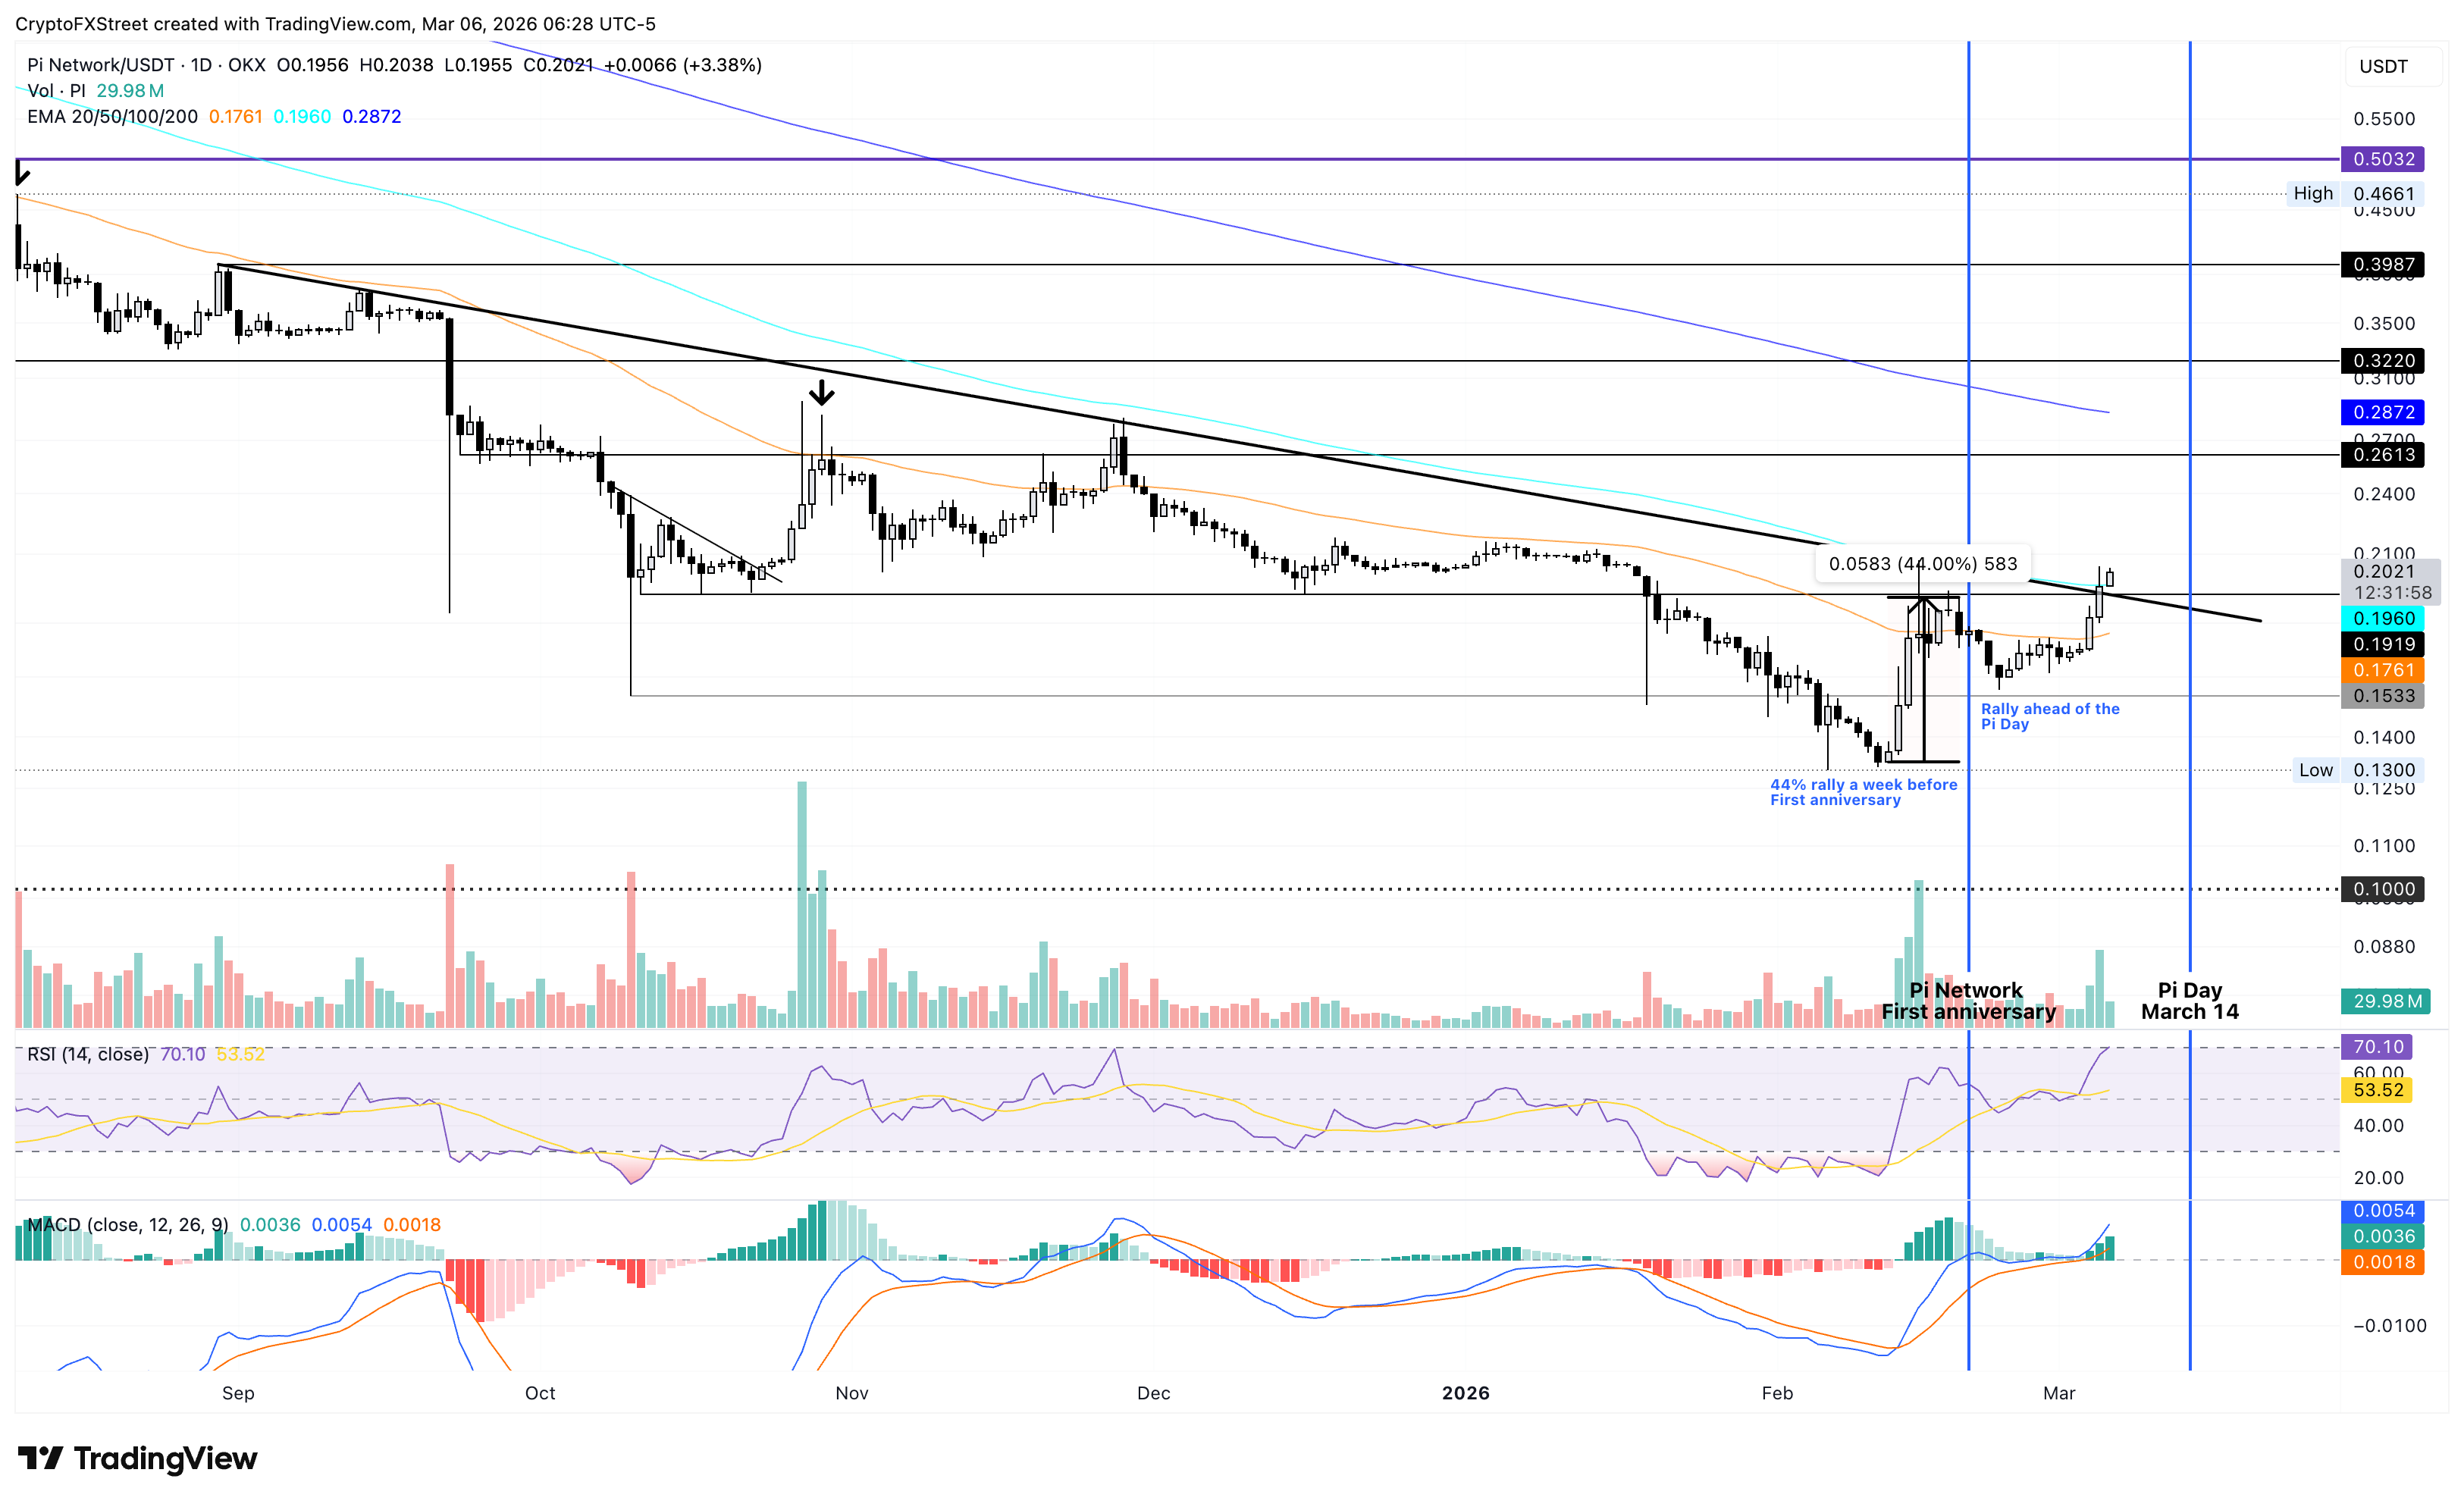
On the flip side, if PI fails to hold above the 100-day EMA, the next immediate support is at the 50-day EMA at $0.1761, which helps maintain the upside bias, followed by secondary support near the October 10 low at $0.1533.
(The technical analysis of this story was written with the help of an AI tool.)

100만 명이 넘는 사용자가 FXStreet를 통해 실시간 시장 데이터, 차트 도구, 전문가 인사이트, 포렉스 뉴스를 이용합니다. 포괄적인 경제 캘린더와 교육 웨비나는 트레이더가 정보를 유지하고 신중한 결정을 내리도록 돕습니다. FXStreet는 바르셀로나 본사와 전 세계 지역에 걸쳐 약 60명의 팀으로 구성되어 있습니다.
더 읽기


