

Pi Network Price Forecast: Key resistance stalls PI recovery run toward $0.10
- Pi Network hovers above $0.0900 at press time on Thursday, extending a sideways shift.
- Speculative demand eases for PI as Open Interest continues to decline.
- The technical outlook is mixed as PI holds below a crucial Fibonacci extension at $0.09613.
Pi Network (PI) stalls above $0.0900 at press time on Thursday, as last week’s recovery faces headwinds near the $0.1000 psychological level. Retail support eases as Open Interest declines amid recovery squeezes. The PI token must reclaim the $0.1000 level to sustain a recovery.

Speculations ease as risk-off market sentiment lingers
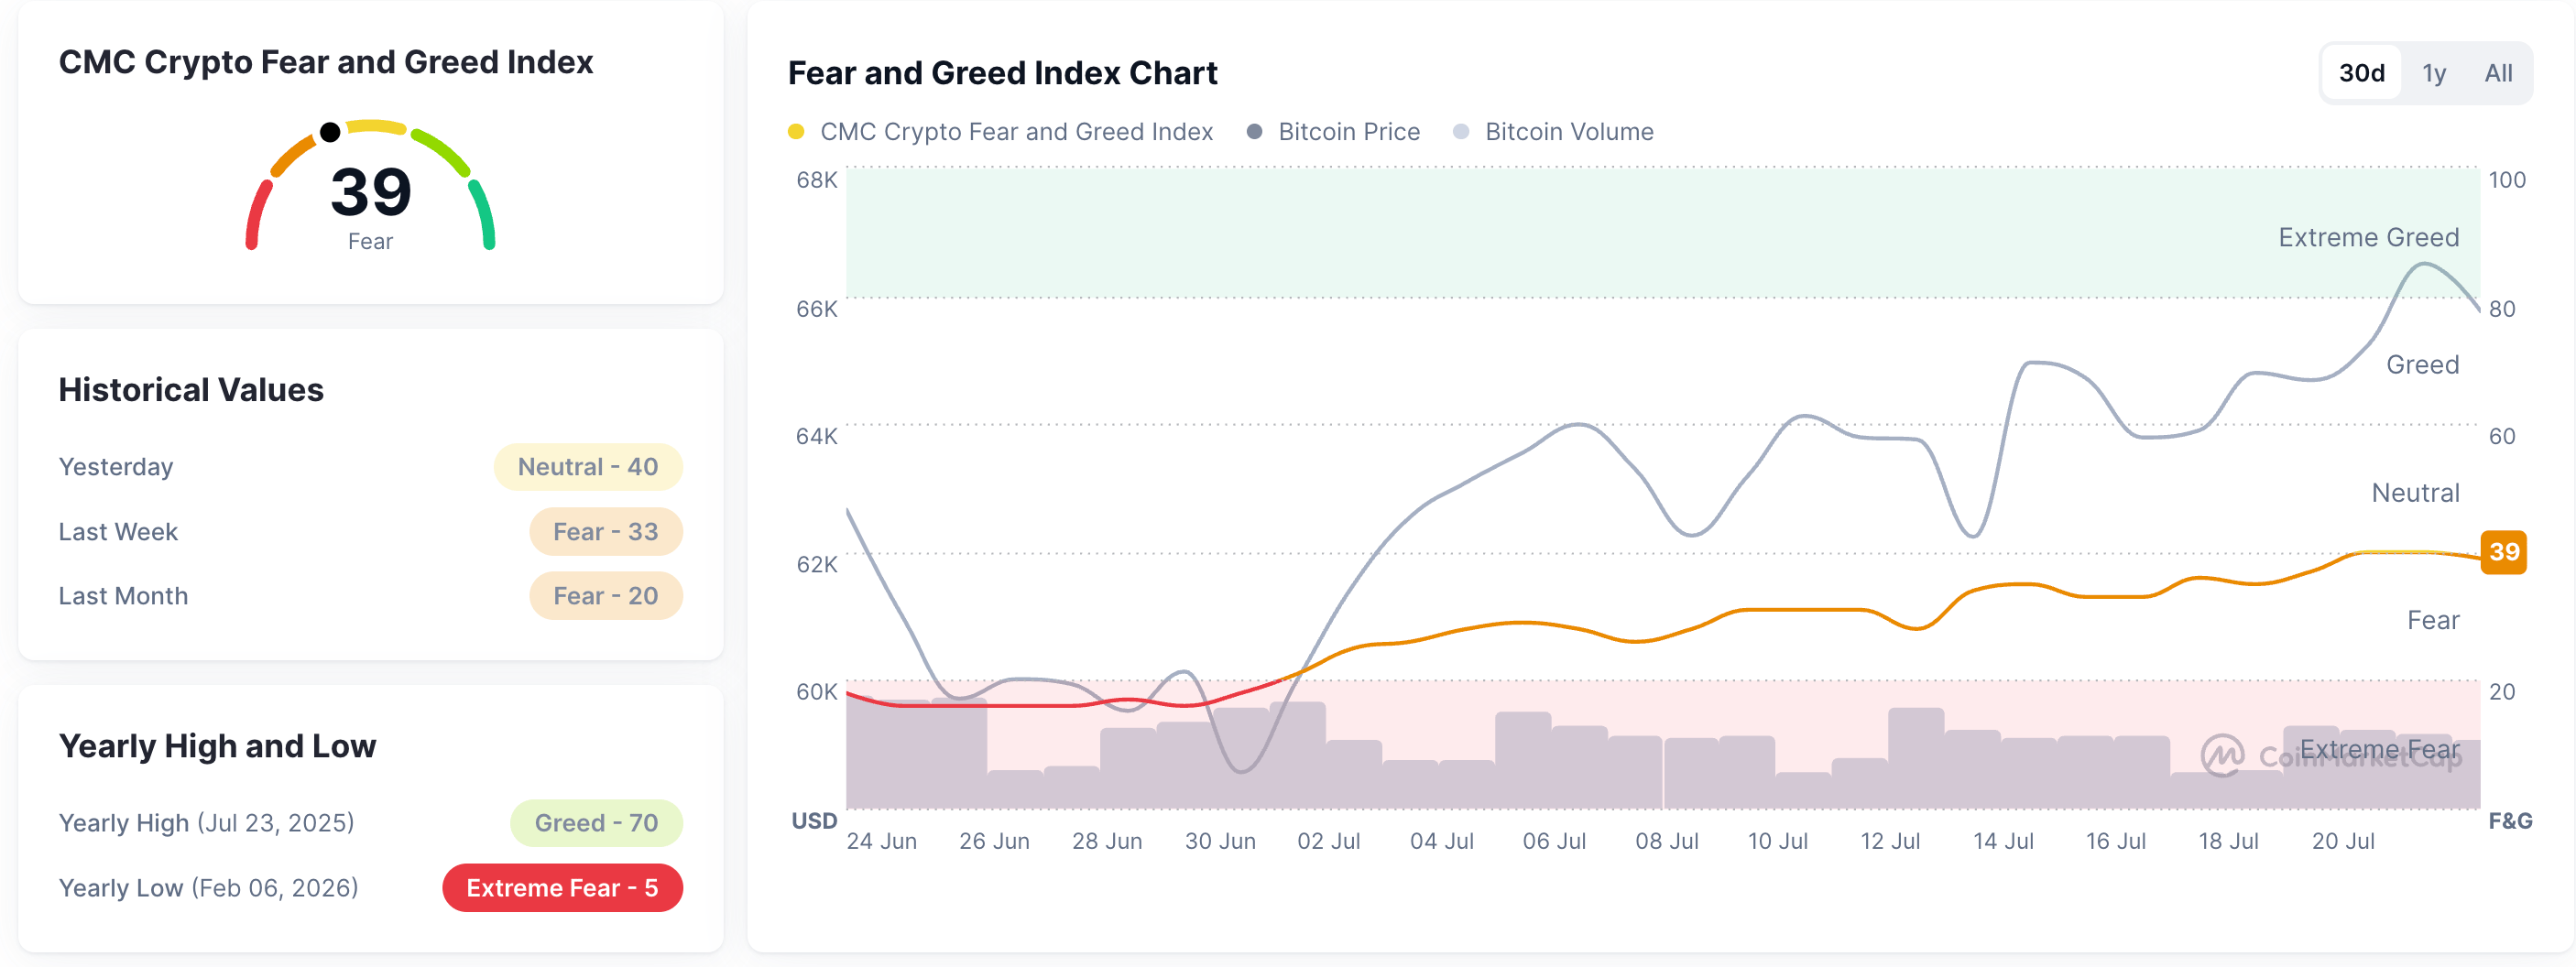
The easing risk-off market sentiment across the broader cryptocurrency market comes to a halt. CoinMarketCap’s Crypto Fear and Greed Index at 39, down from 40 the previous day, suggests sellers continue to remain dominant.
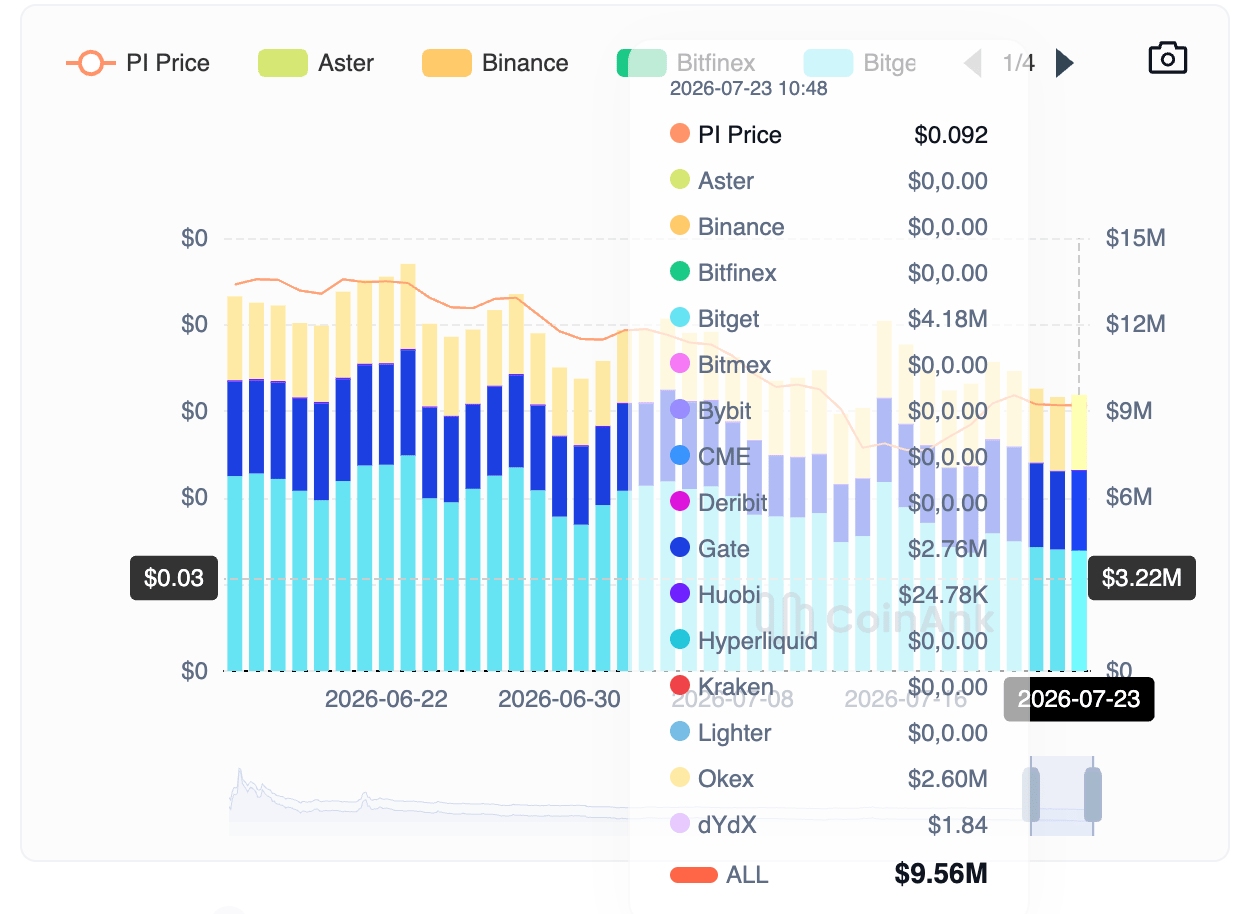
At the same time, the speculative demand for PI is easing. CoinAnk data shows the PI Open Interest (OI) has dropped to $9.56 million on Thursday, down from a $12.14 million peak on June 15, indicating a contraction in active positions.
Will PI reclaim $0.10?
Pi Network hovers around $0.0900 at press time on Thursday, maintaining a consolidative tone well below the 50-day Exponential Moving Average (EMA) at $0.1128 and the 200-day EMA at $0.1728.
The 127.2% Fibonacci extension level of the downswing from $0.1998 to $0.1183, at $0.0961, serves as the immediate resistance, guarding the upside to the overhead trendline near the $0.1000 psychological threshold.
The Relative Strength Index (RSI) at 39 stays below the neutral 50 line, signaling that recovery attempts are still fragile.
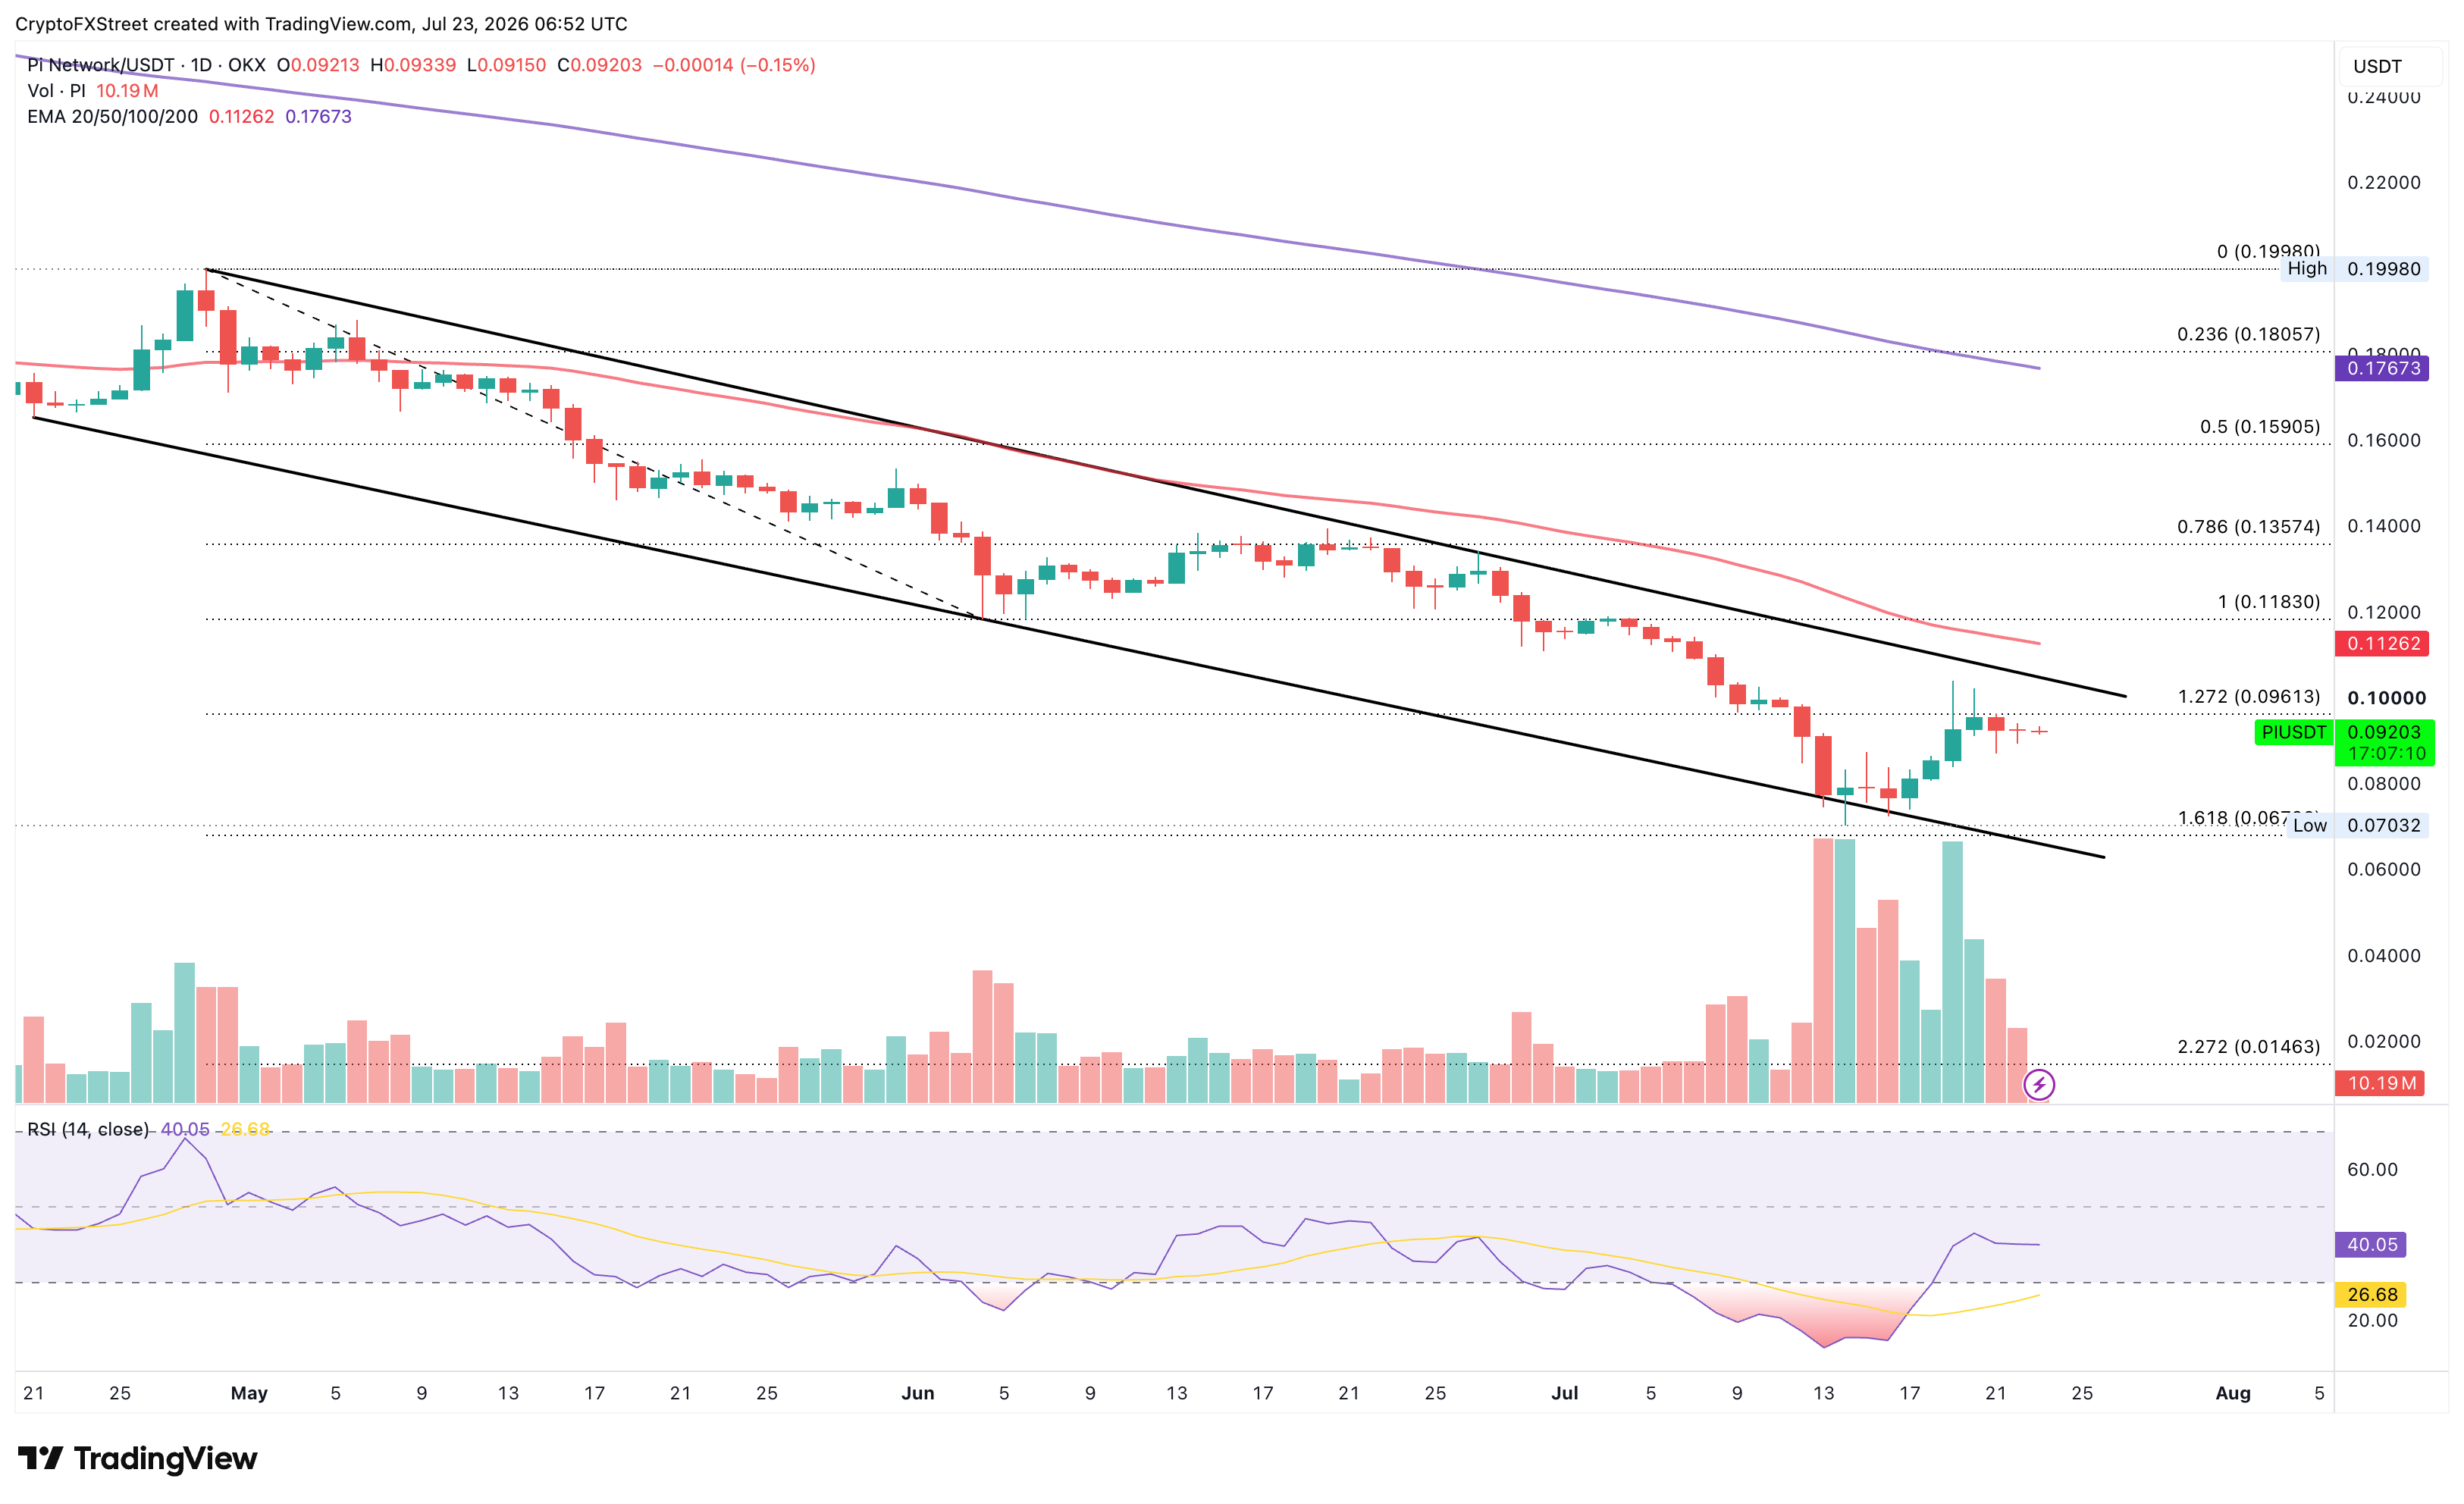
On the downside, the 161.8% Fibonacci extension level at $0.0679 provides the first notable support, reinforced by a descending support trendline near $0.0650.
(The technical analysis of this story was written with the help of an AI tool. Know more.)














