
Pi Network Price Forecast: Minor recovery amid market crash fuels short-term hope
작성자 Vishal Dixit
수정됨: 26 Jun 2026


인기 기사
Pi Network (PI) price records a mild 3% recovery at press time on Friday, shaping a rebound from a broken descending trendline. The declining trend in trading volume has stabilized around $10 million this week, supporting the possibility of an extended recovery as selling pressure wanes.
- Pi Network is up 3% on Friday, marking a rebound from the broken trendline of resistance.
- Mild recovery aligns with the upcoming Pi2Day, while trading volume declines stabilize near $10 million.
- The technical outlook for PI is mixed as minor recovery remains capped by the prevailing downward trend.
Pi Network (PI) price records a mild 3% recovery at press time on Friday, shaping a rebound from a broken descending trendline. The declining trend in trading volume has stabilized around $10 million this week, supporting the possibility of an extended recovery as selling pressure wanes. The technical outlook for PI is mixed as the prevailing bearish trend continues to weigh down on price.
Pi Network shows short-term resilience amid market crash
The broader cryptocurrency market recorded $1 billion in wipeout over the last 24 hours as Bitcoin (BTC) slipped below $60,000 on Thursday, marking its lowest price in 20 months, as previously reported by FXStreet. However, Pi Network is up 3% so far on Friday, reflecting a mild recovery despite the broader market crash.
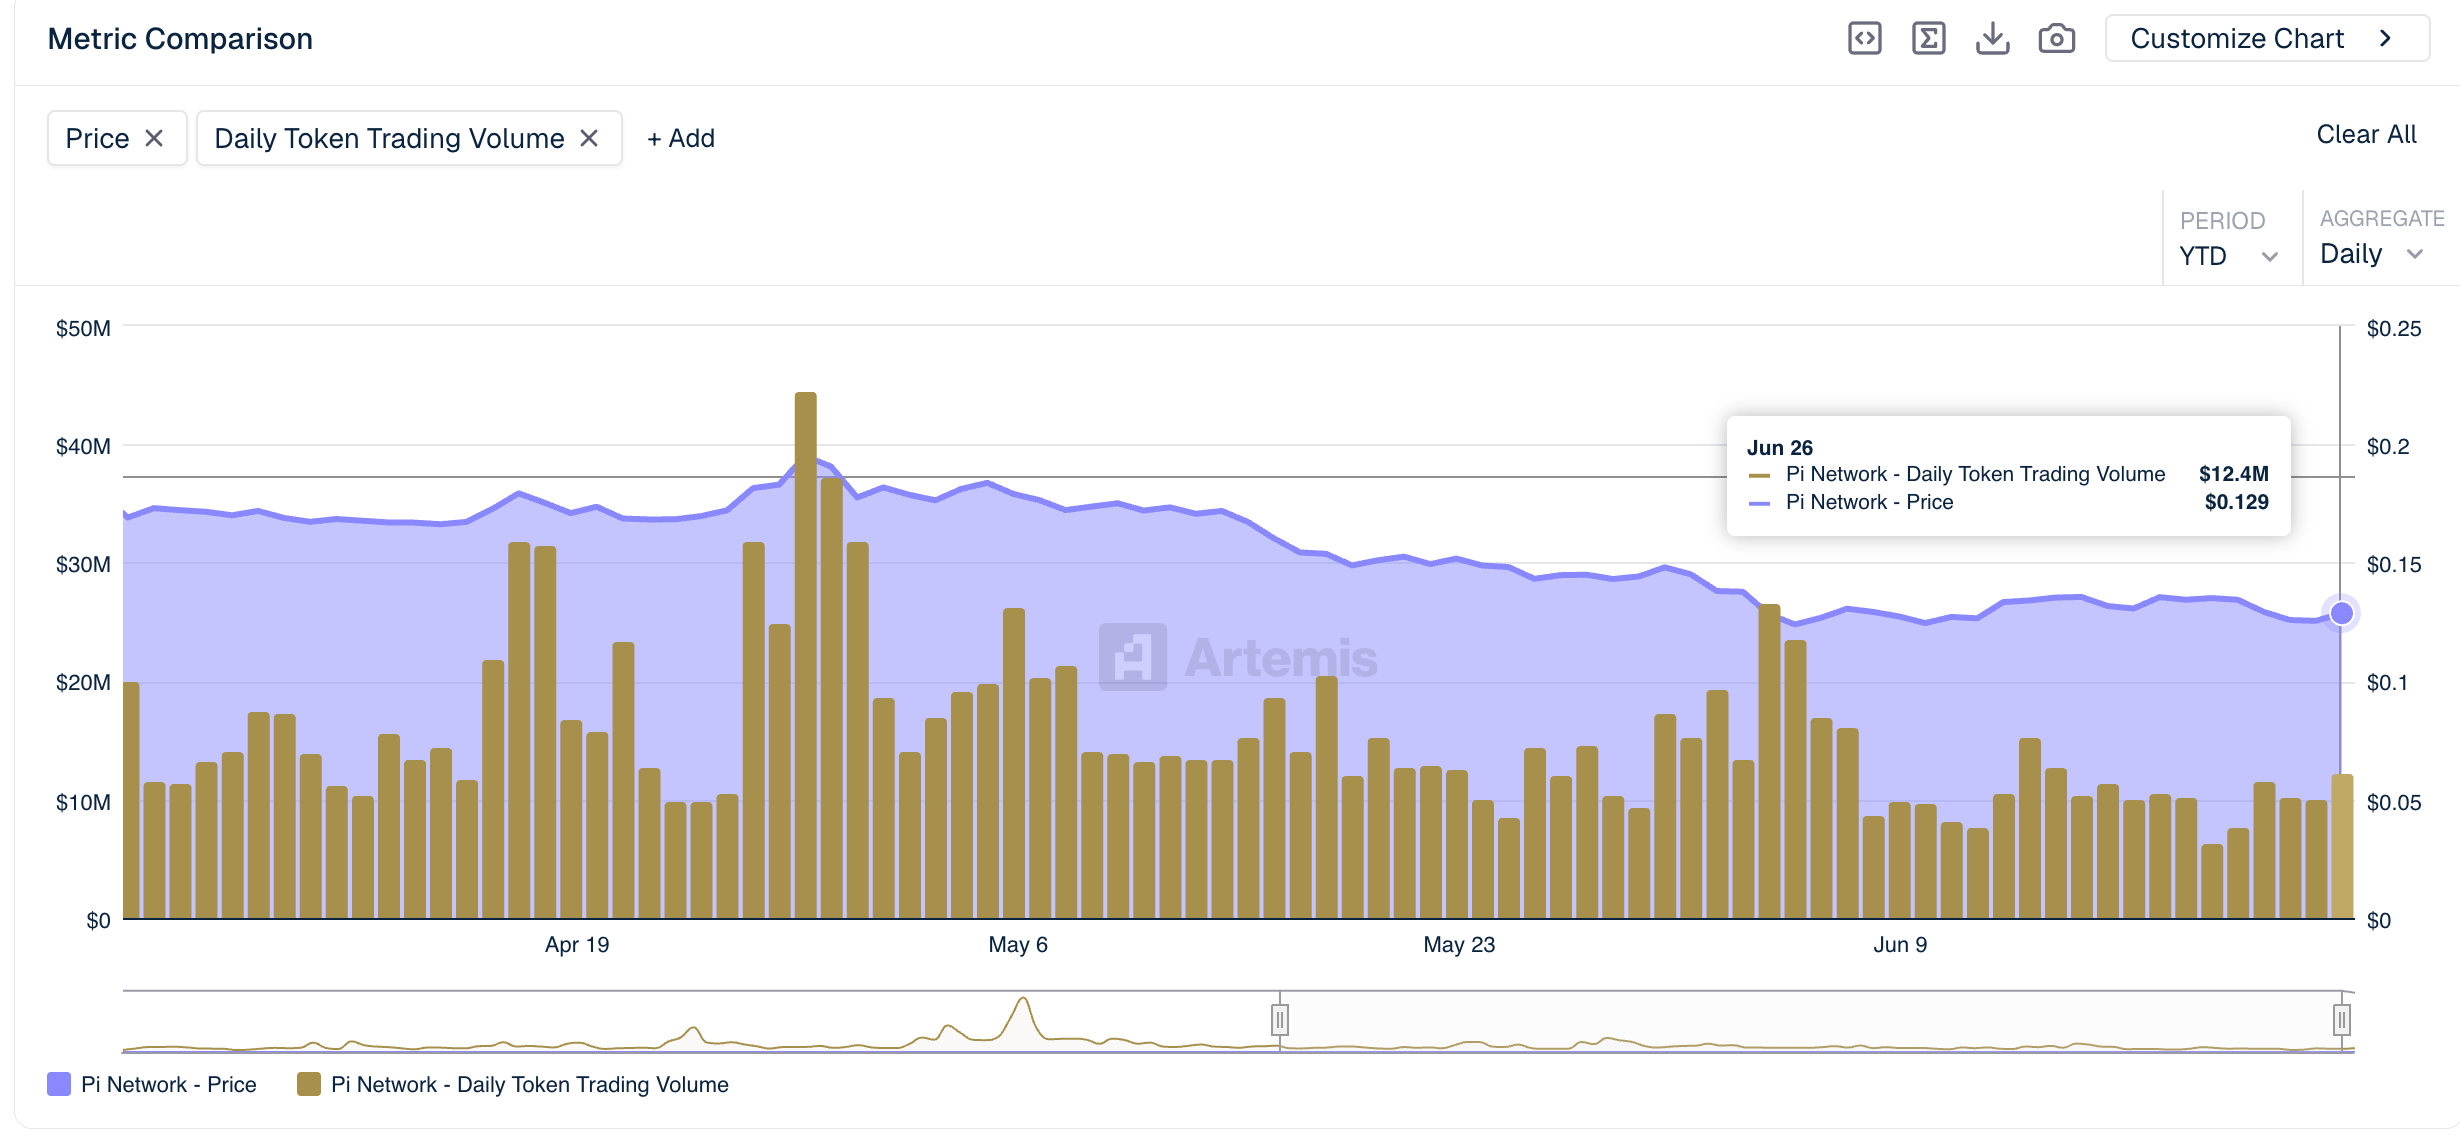
Artemis data show the PI token's daily trading volume stabilizing near $10 million, even as the price declines, marking an uptick. Typically, a flattening trend in trading volume sets the stage for the next impulsive move, which could drive upside, as the upcoming Pi2Day event on Sunday could boost retail demand, as it did last year.
Technical outlook: Will PI regain bullish momentum?
Pi Network approaches $0.1300 at press time on Friday amid a broader bearish bias as price holds below the 50-day Exponential Moving Average (EMA) at $0.1427 and the 200-day EMA at $0.1891. From a technical perspective, the mild intraday recovery in PI, followed by the Doji candle the previous day, implies a potential Morning Star pattern formation. Typically, this pattern leads to a bullish reversal, which in case of PI, aligns with the retest of the broken descending trendline near $0.1200.
That said, the Moving Average Convergence Divergence (MACD) sustains marginally above its signal line, while the Relative Strength Index (RSI) at 42 hints at a modest recovery from prior oversold conditions rather than a clear bullish shift.
The 50-day EMA at $0.1427 serves as the immediate resistance level, followed by the $0.1556 level, marked by the February 23 low.
On the downside, the first notable support emerges at the reclaimed trendline break area around $0.1200, and a sustained move beneath this floor would likely reopen the path for a deeper slide below the June 6 low at $0.1184.
(The technical analysis of this story was written with the help of an AI tool.)
Cryptocurrency metrics FAQs
The developer or creator of each cryptocurrency decides on the total number of tokens that can be minted or issued. Only a certain number of these assets can be minted by mining, staking or other mechanisms. This is defined by the algorithm of the underlying blockchain technology. On the other hand, circulating supply can also be decreased via actions such as burning tokens, or mistakenly sending assets to addresses of other incompatible blockchains.
Market capitalization is the result of multiplying the circulating supply of a certain asset by the asset’s current market value.
Trading volume refers to the total number of tokens for a specific asset that has been transacted or exchanged between buyers and sellers within set trading hours, for example, 24 hours. It is used to gauge market sentiment, this metric combines all volumes on centralized exchanges and decentralized exchanges. Increasing trading volume often denotes the demand for a certain asset as more people are buying and selling the cryptocurrency.
Funding rates are a concept designed to encourage traders to take positions and ensure perpetual contract prices match spot markets. It defines a mechanism by exchanges to ensure that future prices and index prices periodic payments regularly converge. When the funding rate is positive, the price of the perpetual contract is higher than the mark price. This means traders who are bullish and have opened long positions pay traders who are in short positions. On the other hand, a negative funding rate means perpetual prices are below the mark price, and hence traders with short positions pay traders who have opened long positions.

100만 명이 넘는 사용자가 FXStreet를 통해 실시간 시장 데이터, 차트 도구, 전문가 인사이트, 포렉스 뉴스를 이용합니다. 포괄적인 경제 캘린더와 교육 웨비나는 트레이더가 정보를 유지하고 신중한 결정을 내리도록 돕습니다. FXStreet는 바르셀로나 본사와 전 세계 지역에 걸쳐 약 60명의 팀으로 구성되어 있습니다.
더 읽기


