
Pi Network Price Forecast: PI extends consolidation amid uncertainty over US-Iran ceasefire deal
작성자 Manish Chhetri
수정됨: 26 Mar 2026


인기 기사

Pi Network (PI) is stabilizing around $0.19 as of writing on Thursday and consolidating after the recent sell-off. The market sentiment remains cautious amid uncertainty over the US-Iran ceasefire deal. Meanwhile, the technical outlook suggests a mild bearish tilt toward the PI token.
- Pi Network extends its consolidation so far this week, trading around the $0.19 mark on Thursday.
- Traders remain cautious amid uncertainty over the US-Iran ceasefire talks.
- The technical outlook remains neutral, with a slight bearish tilt, as momentum indicators signal fading bullish strength.
Pi Network (PI) is stabilizing around $0.19 as of writing on Thursday and consolidating after the recent sell-off. The market sentiment remains cautious amid uncertainty over the US-Iran ceasefire deal. Meanwhile, the technical outlook suggests a mild bearish tilt toward the PI token.
US-Iran ceasefire deal remains uncertain
The ongoing talks about a potential ceasefire deal between the US and Iran remain highly uncertain. The latest developments came in on Thursday as US President Donald Trump reiterated that Iran is negotiating to end the war.
“They are negotiating, by the way, and they want to make a deal so badly. But they’re afraid to say it, because they figure they’ll be killed by their own people,” Trump said.
Meanwhile, Iranian Foreign Minister Abbas Araghchi said on state TV that his government had not engaged in talks to end the war, citing that “we do not plan on any negotiations.”
Apart from this, the deployment of additional US troops in the region raises the risk of further escalation of the conflict, which continues to weigh on risky assets such as Bitcoin, which falls below $70,000 as of writing on Thursday, while PI shows mild signs of weakness.
Traders should be cautious as negotiations around the ceasefire deal remain highly uncertain, with the latest news suggesting a slight negative outcome. If this scenario plays out, Pi Network could extend the correction in the coming days.
Other bearish signs
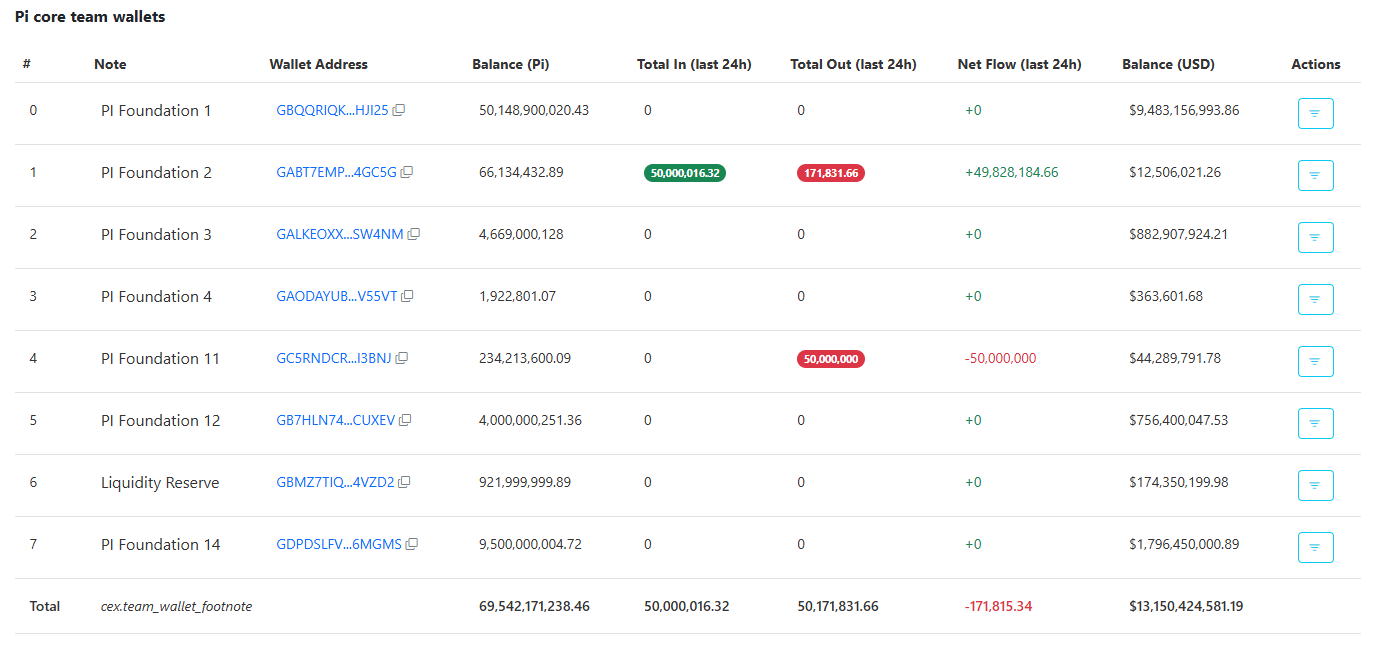
PiScan data below shows that the Pi Foundation moved 171K PI tokens in the last 24 hours. So far, these tokens have not yet been moved to exchanges. Traders should remain cautious, as any of these tokens move toward exchanges, and if more movements like these occur, they could increase supply and introduce short-term selling pressure.
In addition, Santiment’s Social Dominance metric for Pi Network also supports a bearish outlook. The index measures the share of PI-related discussions across the cryptocurrency media. It has resumed its broader downtrend and reads 0.022% on Thursday. This fall indicates fading market interest and sentiment among PI investors.
 [13-1774516007163-1774516007164.46.43, 26 Mar, 2026].png)
Pi Network Price Forecast: PI price action shows early signs of weakness
Pi Network has been consolidating between the 50-day and 100-day Exponential Moving Averages (EMAs) near $0.18 and $0.20, respectively, since Saturday, after failing to close above the 200-day EMA near $0.30 on March 13.
If PI breaks below the immediate support at $0.18, its 50-day EMA, it could extend the correction toward the daily support at $0.15.
The Relative Strength Index (RSI) on the daily chart is flattening around the neutral level of 50, indicating indecision among traders. The Moving Average Convergence Divergence (MACD) showed a bearish crossover on March 15, which remains intact, supporting a bearish outlook.
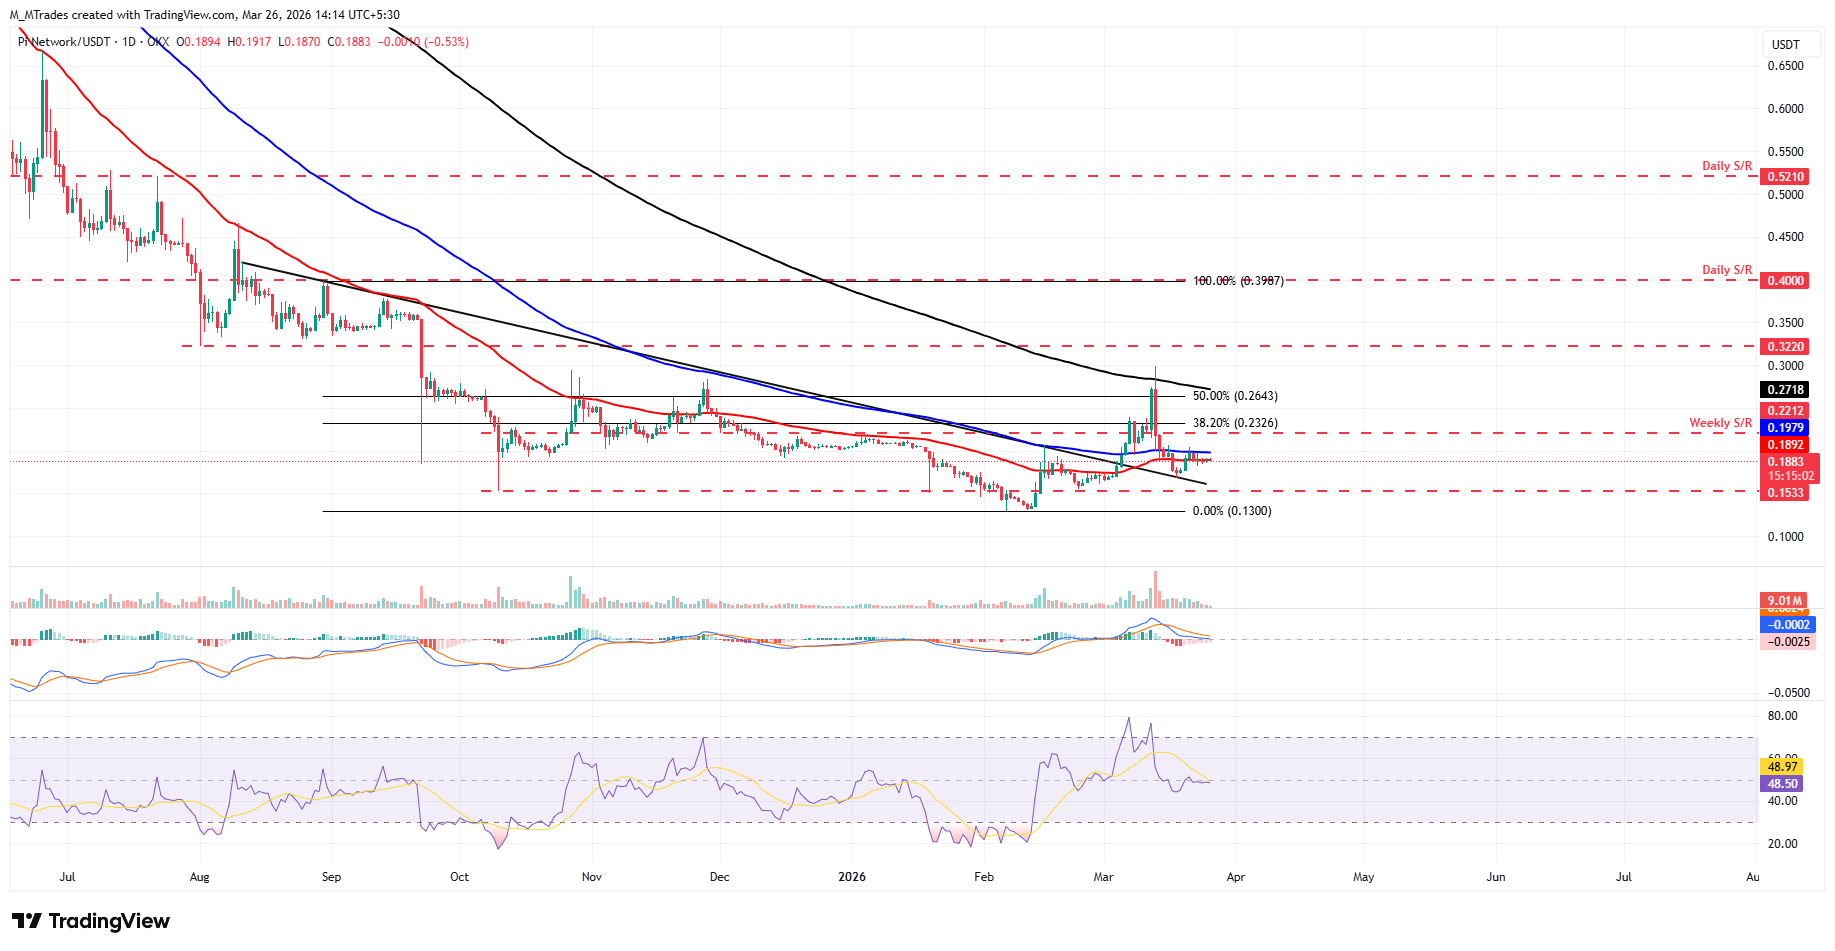
If PI recovers, it could extend the advance toward the 100-day EMA at $0.20.
Cryptocurrency metrics FAQs
The developer or creator of each cryptocurrency decides on the total number of tokens that can be minted or issued. Only a certain number of these assets can be minted by mining, staking or other mechanisms. This is defined by the algorithm of the underlying blockchain technology. On the other hand, circulating supply can also be decreased via actions such as burning tokens, or mistakenly sending assets to addresses of other incompatible blockchains.
Market capitalization is the result of multiplying the circulating supply of a certain asset by the asset’s current market value.
Trading volume refers to the total number of tokens for a specific asset that has been transacted or exchanged between buyers and sellers within set trading hours, for example, 24 hours. It is used to gauge market sentiment, this metric combines all volumes on centralized exchanges and decentralized exchanges. Increasing trading volume often denotes the demand for a certain asset as more people are buying and selling the cryptocurrency.
Funding rates are a concept designed to encourage traders to take positions and ensure perpetual contract prices match spot markets. It defines a mechanism by exchanges to ensure that future prices and index prices periodic payments regularly converge. When the funding rate is positive, the price of the perpetual contract is higher than the mark price. This means traders who are bullish and have opened long positions pay traders who are in short positions. On the other hand, a negative funding rate means perpetual prices are below the mark price, and hence traders with short positions pay traders who have opened long positions.

100만 명이 넘는 사용자가 FXStreet를 통해 실시간 시장 데이터, 차트 도구, 전문가 인사이트, 포렉스 뉴스를 이용합니다. 포괄적인 경제 캘린더와 교육 웨비나는 트레이더가 정보를 유지하고 신중한 결정을 내리도록 돕습니다. FXStreet는 바르셀로나 본사와 전 세계 지역에 걸쳐 약 60명의 팀으로 구성되어 있습니다.
더 읽기


