
Pi Network Price Forecast: PI extends recovery as 20 million token unlock looms
작성자 Vishal Dixit
수정됨: 5 Mar 2026


인기 기사

Pi Network (PI) price extends gains above $0.1900 at press time on Thursday, following a 7% increase the previous day. The upcoming token unlock of more than 20 million PI tokens on Saturday looms over the short-term recovery.
- Pi Network extends gains above the 50-day EMA on Thursday, building on the previous day's 7% rise.
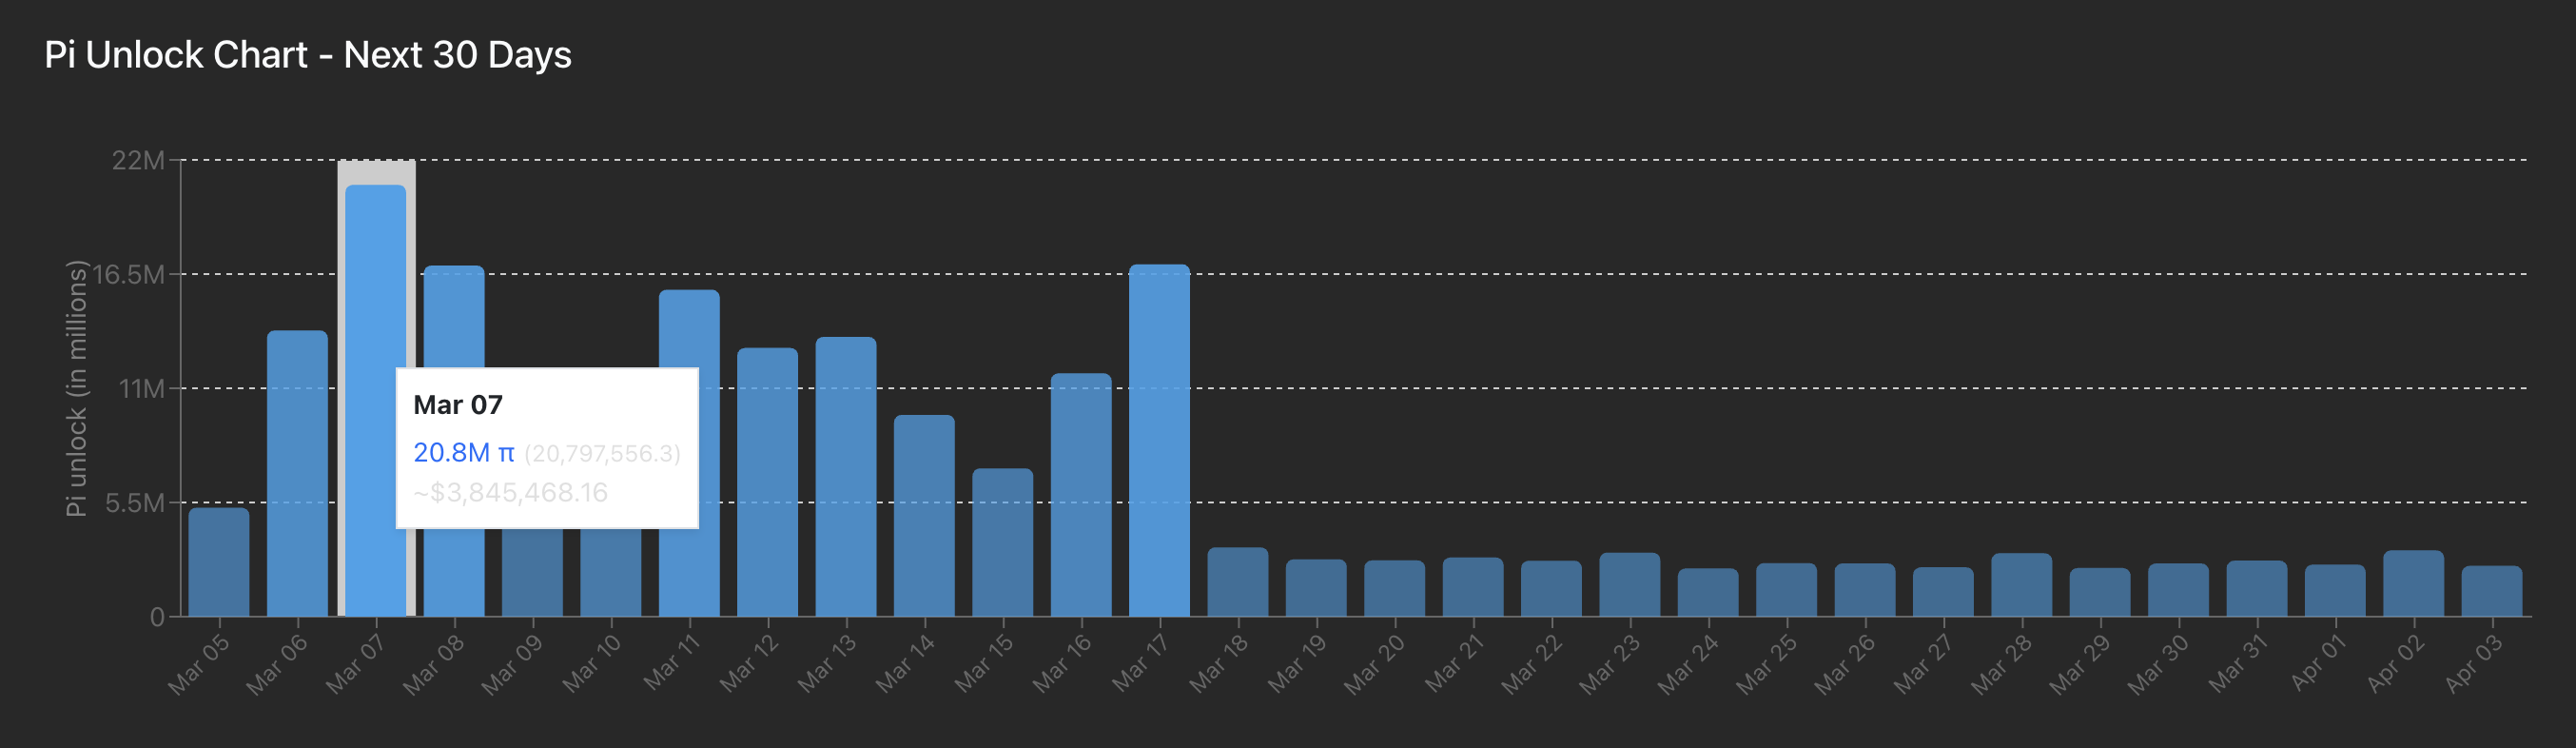
- Over 20 million PI tokens are to be unlocked on Saturday, the largest in the next 30 days, which could cap the recovery.
- The technical outlook for PI is bullish as the short-term recovery tests a crucial resistance trendline.
Pi Network (PI) price extends gains above $0.1900 at press time on Thursday, following a 7% increase the previous day. The upcoming token unlock of more than 20 million PI tokens on Saturday looms over the short-term recovery. Technically, the Pi Network tests a crucial resistance trendline, with bulls anticipating a breakout rally.
Pi Network gains strength ahead of 20 million token unlock
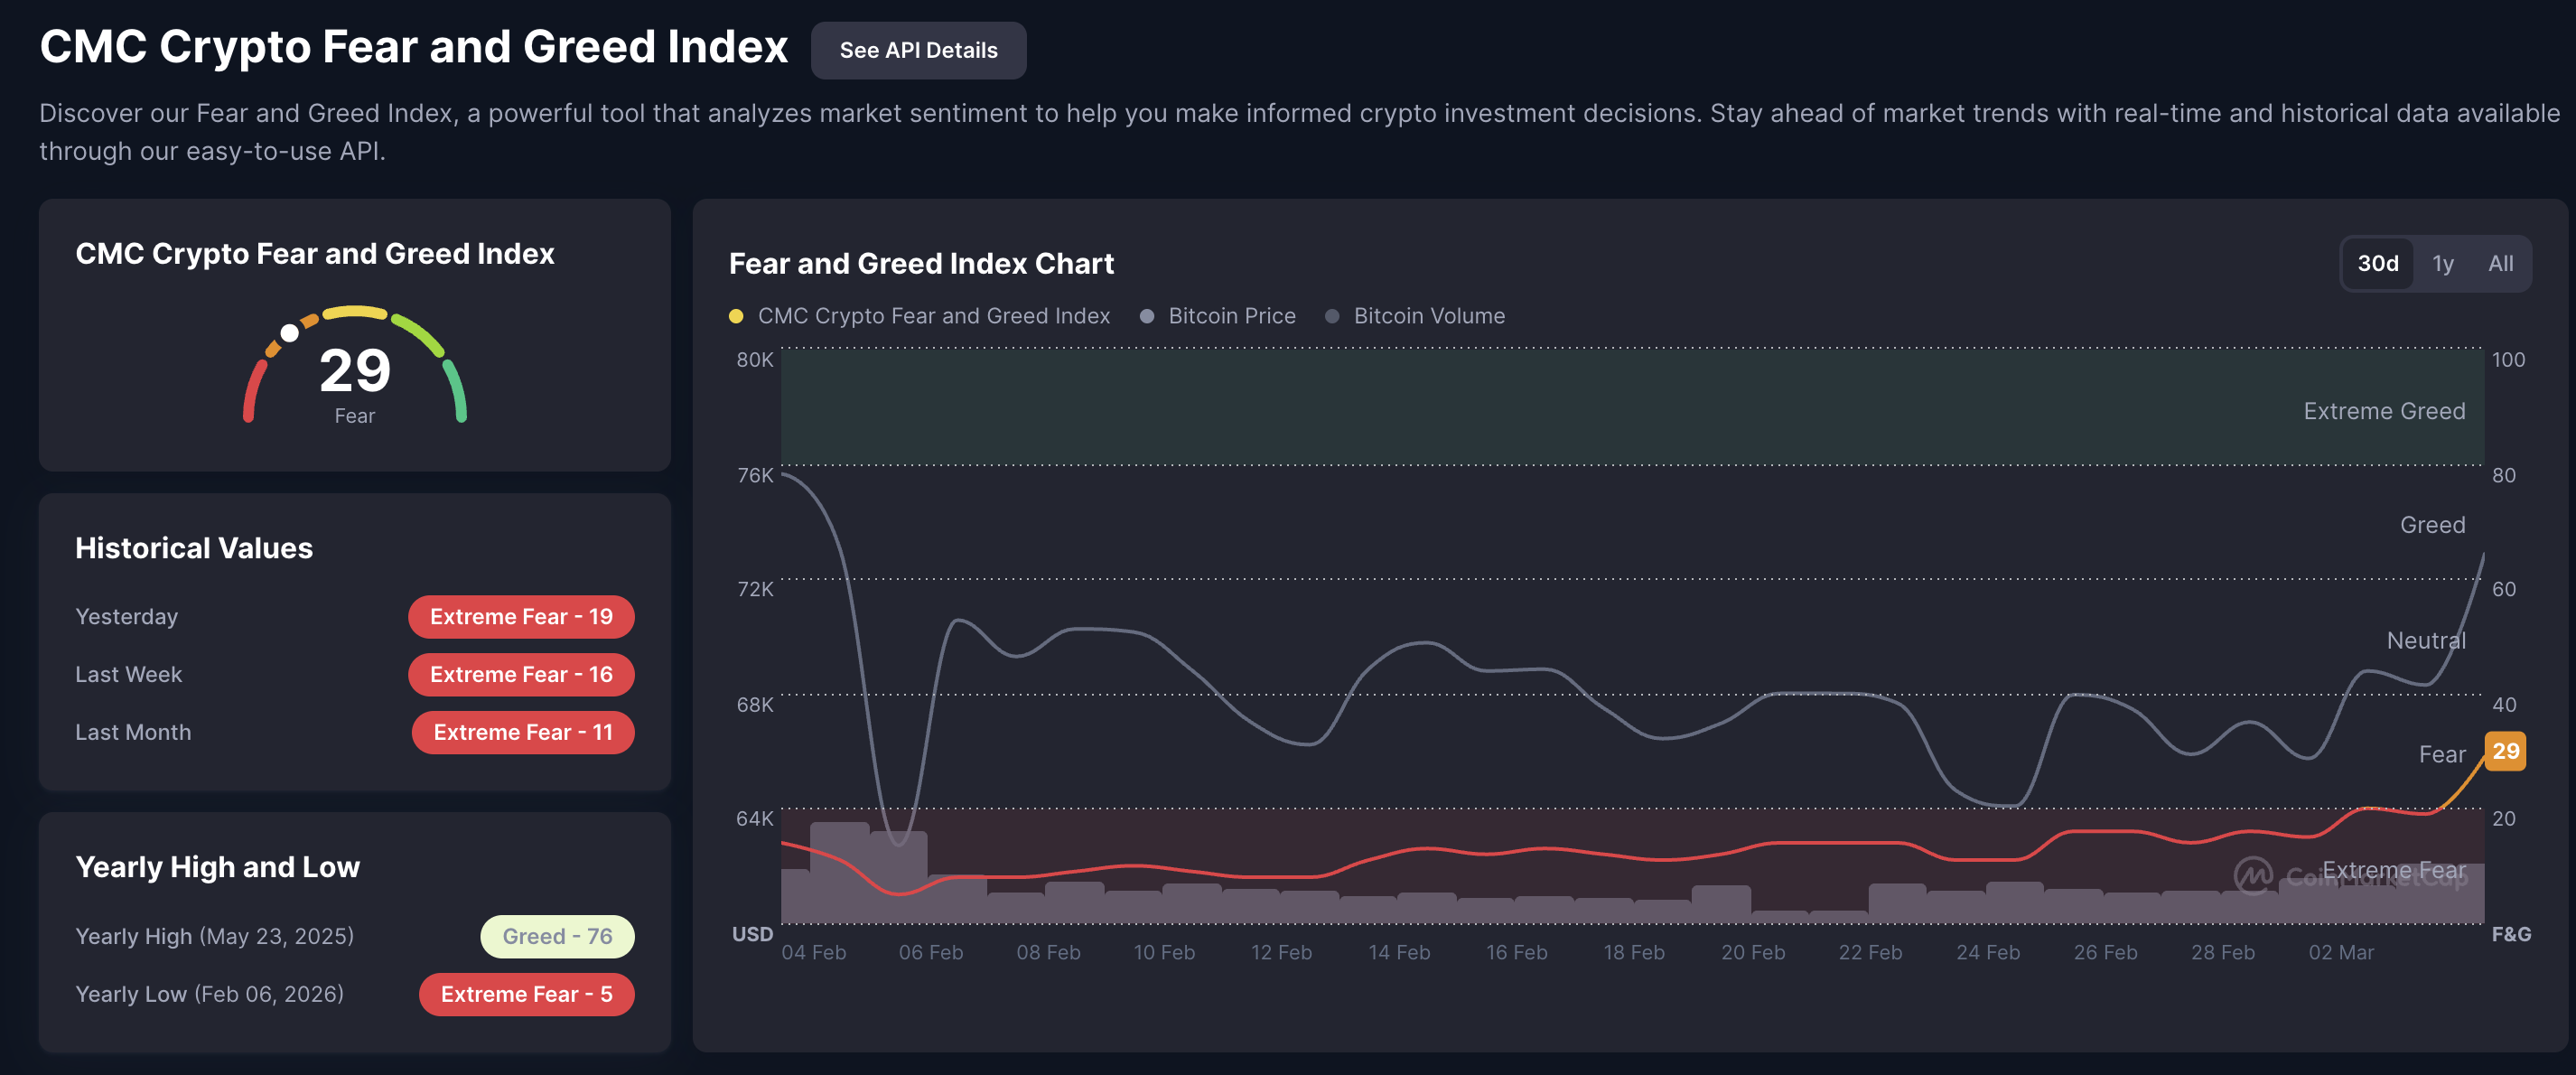
Pi Network is up roughy 15% so far this week as the broader market risk-off sentiment fades. CoinMarketCap’s Crypto Fear and Greed Index rises to 29 on Thursday, from 19 the previous day, indicating that the investor's sentiment recovers from Extreme Fear conditions, as previously reported by FXStreet.
However, the daily token unlocks continue to weigh down on PI recovery. PiScan data shows 20.8 million PI tokens are scheduled to be unlocked on Saturday, marking the largest release in the next 30 days. Typically, token unlock leads to increased downside pressure, capping the recovery.
Technical outlook: Will Pi Network extend gains above $0.20?
Pi Network is up 5% at press time on Thursday, marking its fourth consecutive day of recovery. The PI token holds gains above the 50-day Exponential Moving Average (EMA) at $0.1749, signaling a boost in short-term bullish momentum.
Pi Network tests a supply cluster of the 100-day EMA at $0.1959 and a descending trendline, connecting the August 30 and November 28 highs, near the October 11 low at $0.1919. A decisive close above $0.1959 could extend the upside toward the $0.2613 resistance level, marked by the September 23 low.
The momentum indicators on the daily chart confirm a bullish bias in the short-term. The Moving Average Convergence Divergence (MACD) rises above its signal line as both extend above the zero line while the positive histogram widens, reflecting increased bullish momentum. At the same time, the Relative Strength Index (RSI) is at 65, pointing upwards and inching closer to the overbought zone as buying pressure strengthens.
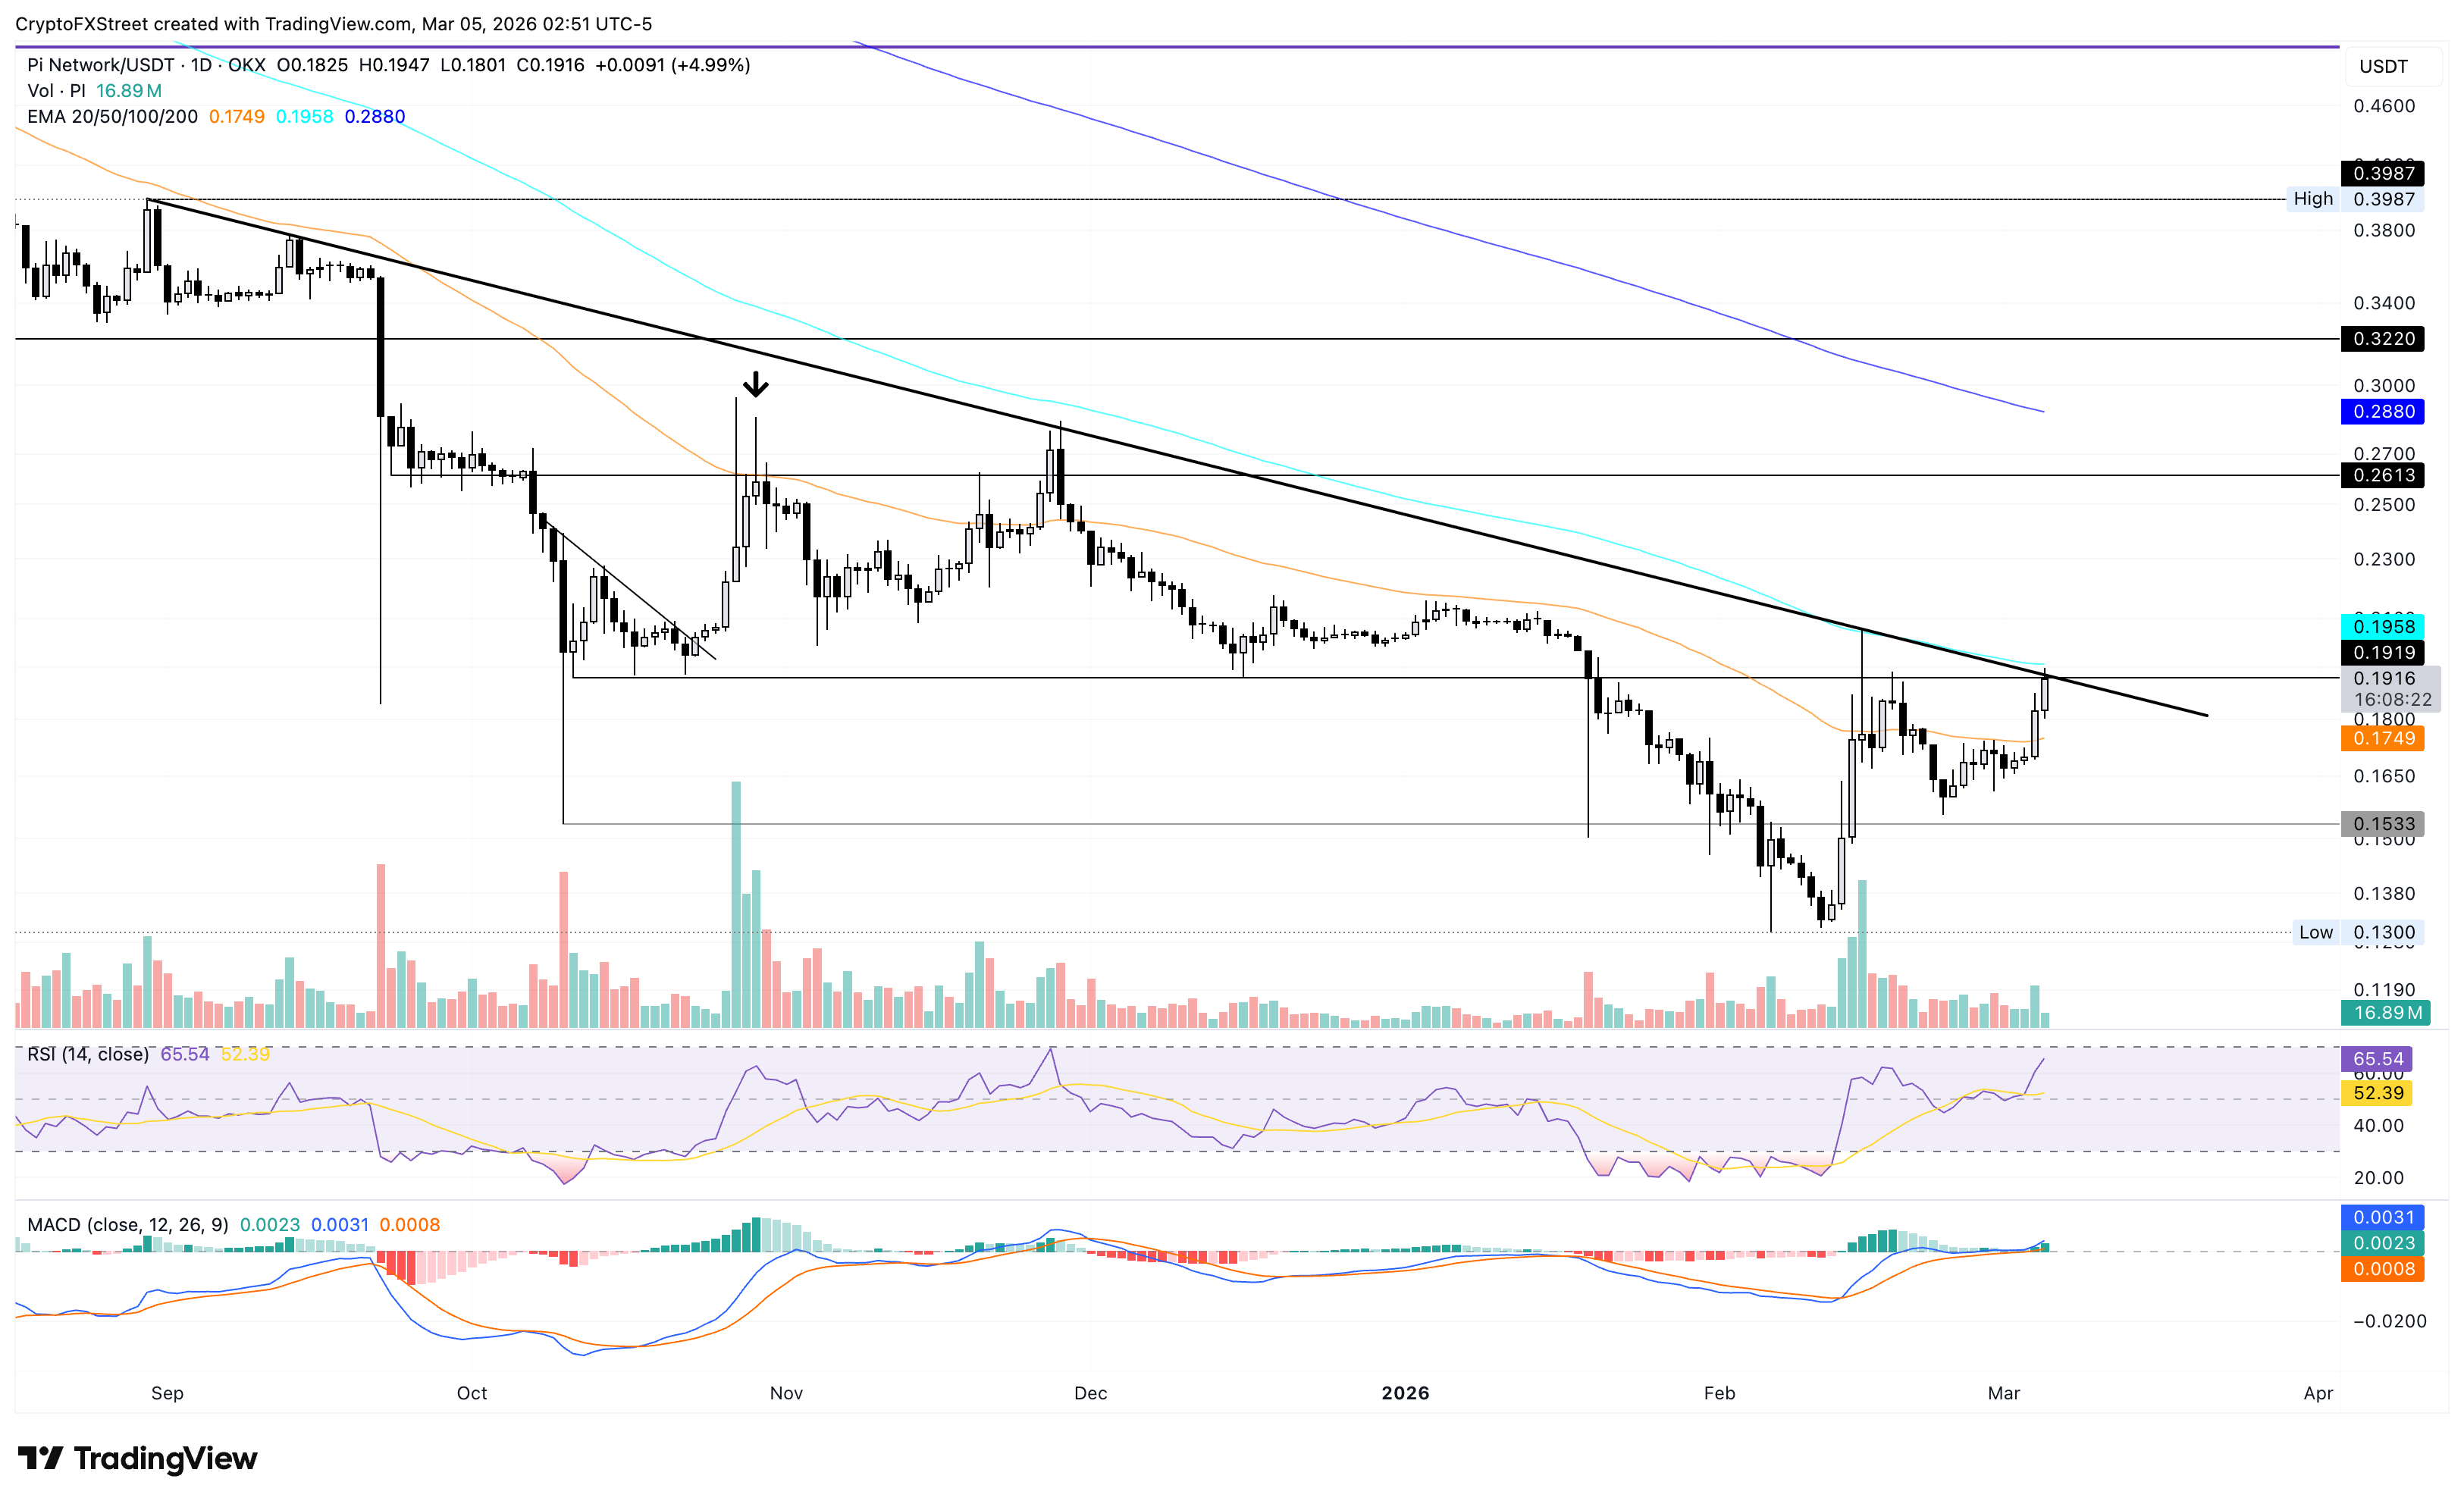
Looking down, the 50-day EMA at $0.1749 remains a crucial support level, capping the downside risk to the October 10 low at $0.1533.
Cryptocurrency metrics FAQs
The developer or creator of each cryptocurrency decides on the total number of tokens that can be minted or issued. Only a certain number of these assets can be minted by mining, staking or other mechanisms. This is defined by the algorithm of the underlying blockchain technology. On the other hand, circulating supply can also be decreased via actions such as burning tokens, or mistakenly sending assets to addresses of other incompatible blockchains.
Market capitalization is the result of multiplying the circulating supply of a certain asset by the asset’s current market value.
Trading volume refers to the total number of tokens for a specific asset that has been transacted or exchanged between buyers and sellers within set trading hours, for example, 24 hours. It is used to gauge market sentiment, this metric combines all volumes on centralized exchanges and decentralized exchanges. Increasing trading volume often denotes the demand for a certain asset as more people are buying and selling the cryptocurrency.
Funding rates are a concept designed to encourage traders to take positions and ensure perpetual contract prices match spot markets. It defines a mechanism by exchanges to ensure that future prices and index prices periodic payments regularly converge. When the funding rate is positive, the price of the perpetual contract is higher than the mark price. This means traders who are bullish and have opened long positions pay traders who are in short positions. On the other hand, a negative funding rate means perpetual prices are below the mark price, and hence traders with short positions pay traders who have opened long positions.

100만 명이 넘는 사용자가 FXStreet를 통해 실시간 시장 데이터, 차트 도구, 전문가 인사이트, 포렉스 뉴스를 이용합니다. 포괄적인 경제 캘린더와 교육 웨비나는 트레이더가 정보를 유지하고 신중한 결정을 내리도록 돕습니다. FXStreet는 바르셀로나 본사와 전 세계 지역에 걸쳐 약 60명의 팀으로 구성되어 있습니다.
더 읽기


