
Pi Network Price Forecast: PI hits record low despite plans to deploy KYC validator rewards in March
작성자 Vishal Dixit
게시일: 6 Feb 2026 | 수정일: 6 Feb 2026


인기 기사

Pi Network (PI) trades above $0.1400 at press time on Friday, recovering from a record low of $0.1300 registered earlier in the day.
- Pi Network hovers above $0.1400 on Friday, up from the $0.1300 record low seen earlier in the day.
- The sell-off continues even as Pi Network has announced that it will distribute KYC validator rewards by the end of March.
- The technical outlook for PI remains bearish, consistent with the broader cryptocurrency market correction.
Pi Network (PI) trades above $0.1400 at press time on Friday, recovering from a record low of $0.1300 registered earlier in the day. The PI token's price extends its recent decline amid the broader cryptocurrency market crash and despite the recent announcement of plans to distribute rewards to Know-Your-Customer (KYC) validators.
Holder confidence declines despite plans to reward KYC validators in March
Pi Network announced plans to deploy Pi-based rewards to KYC validators for processing millions of applications by late March. As of Friday, the design is being tested following completion and mainnet implementation. The validator rewards could boost the network participation and retail sentiment.

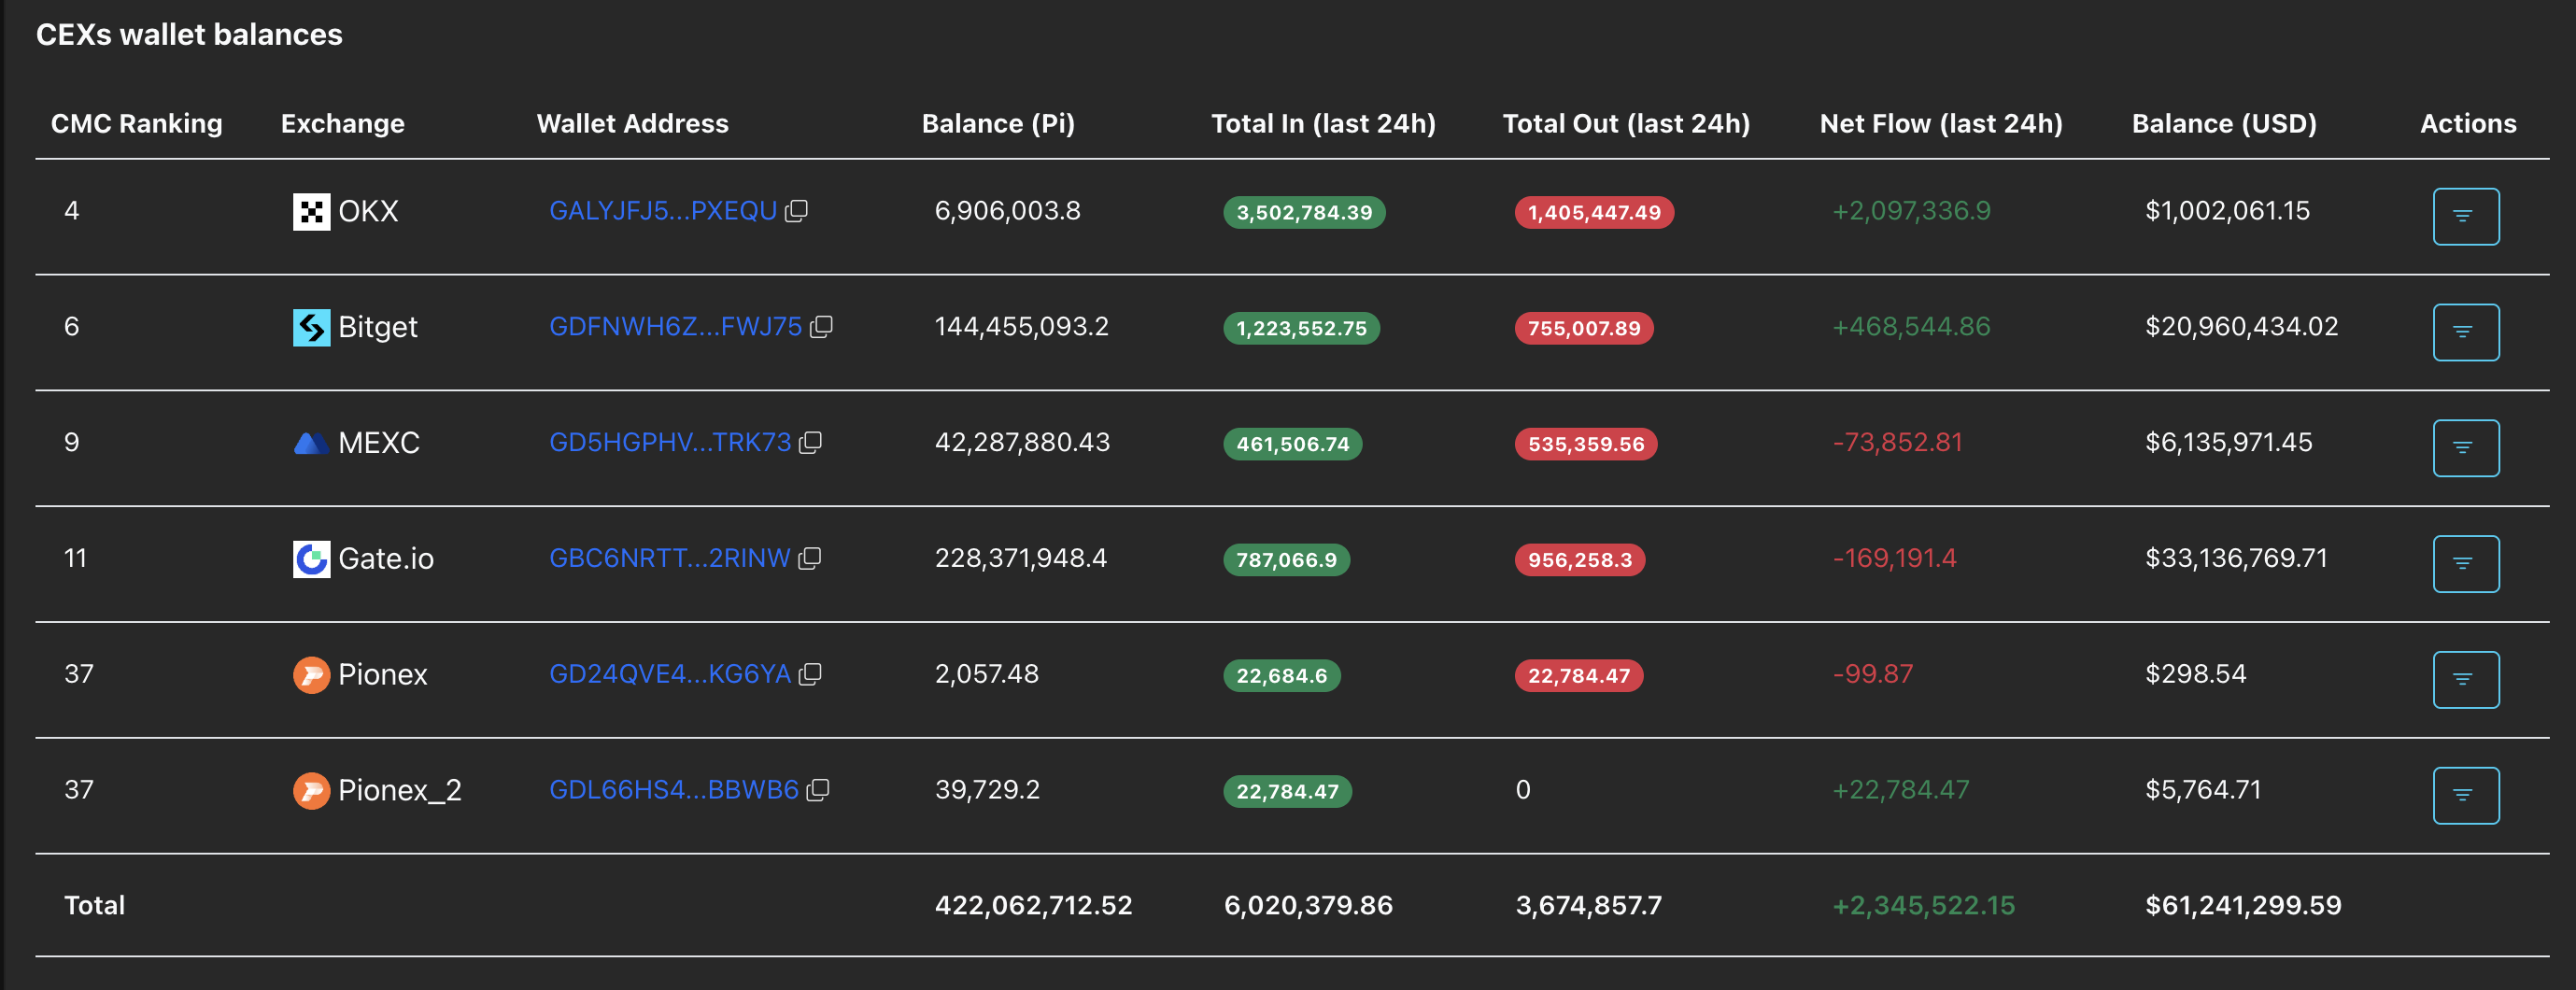
Still, the announcement didn't significantly lift the near-term outlook for PI. Investor confidence continues to decline, as PiScan data show that holders deposited more than 2.34 million PI tokens on exchanges in the last 24 hours. Typically, net inflows into exchanges are associated with holders reducing their exposure, thereby adding to supply pressure.
Pi Network in a freefall targets listing price
Pi Network dropped 9% on Thursday, breaking below the $0.1533 support level, which coincided with the October 10 low. At the time of writing, the intraday reversal from a record low of $0.1300 indicates a minor ease in downside pressure.
However, the technical indicators on the daily chart reflect sell-side dominance. The relative strength index (RSI) at 20 consolidates into the oversold zone, indicating intense selling pressure. At the same time, the Moving Average Convergence Divergence (MACD) and signal line decline into the negative territory as the histogram below the zero line widens, suggesting intense bearish momentum.
In this scenario, PI looks set to enter into a price-discovery mode, with the $0.1000 listing price being the remaining known price level.
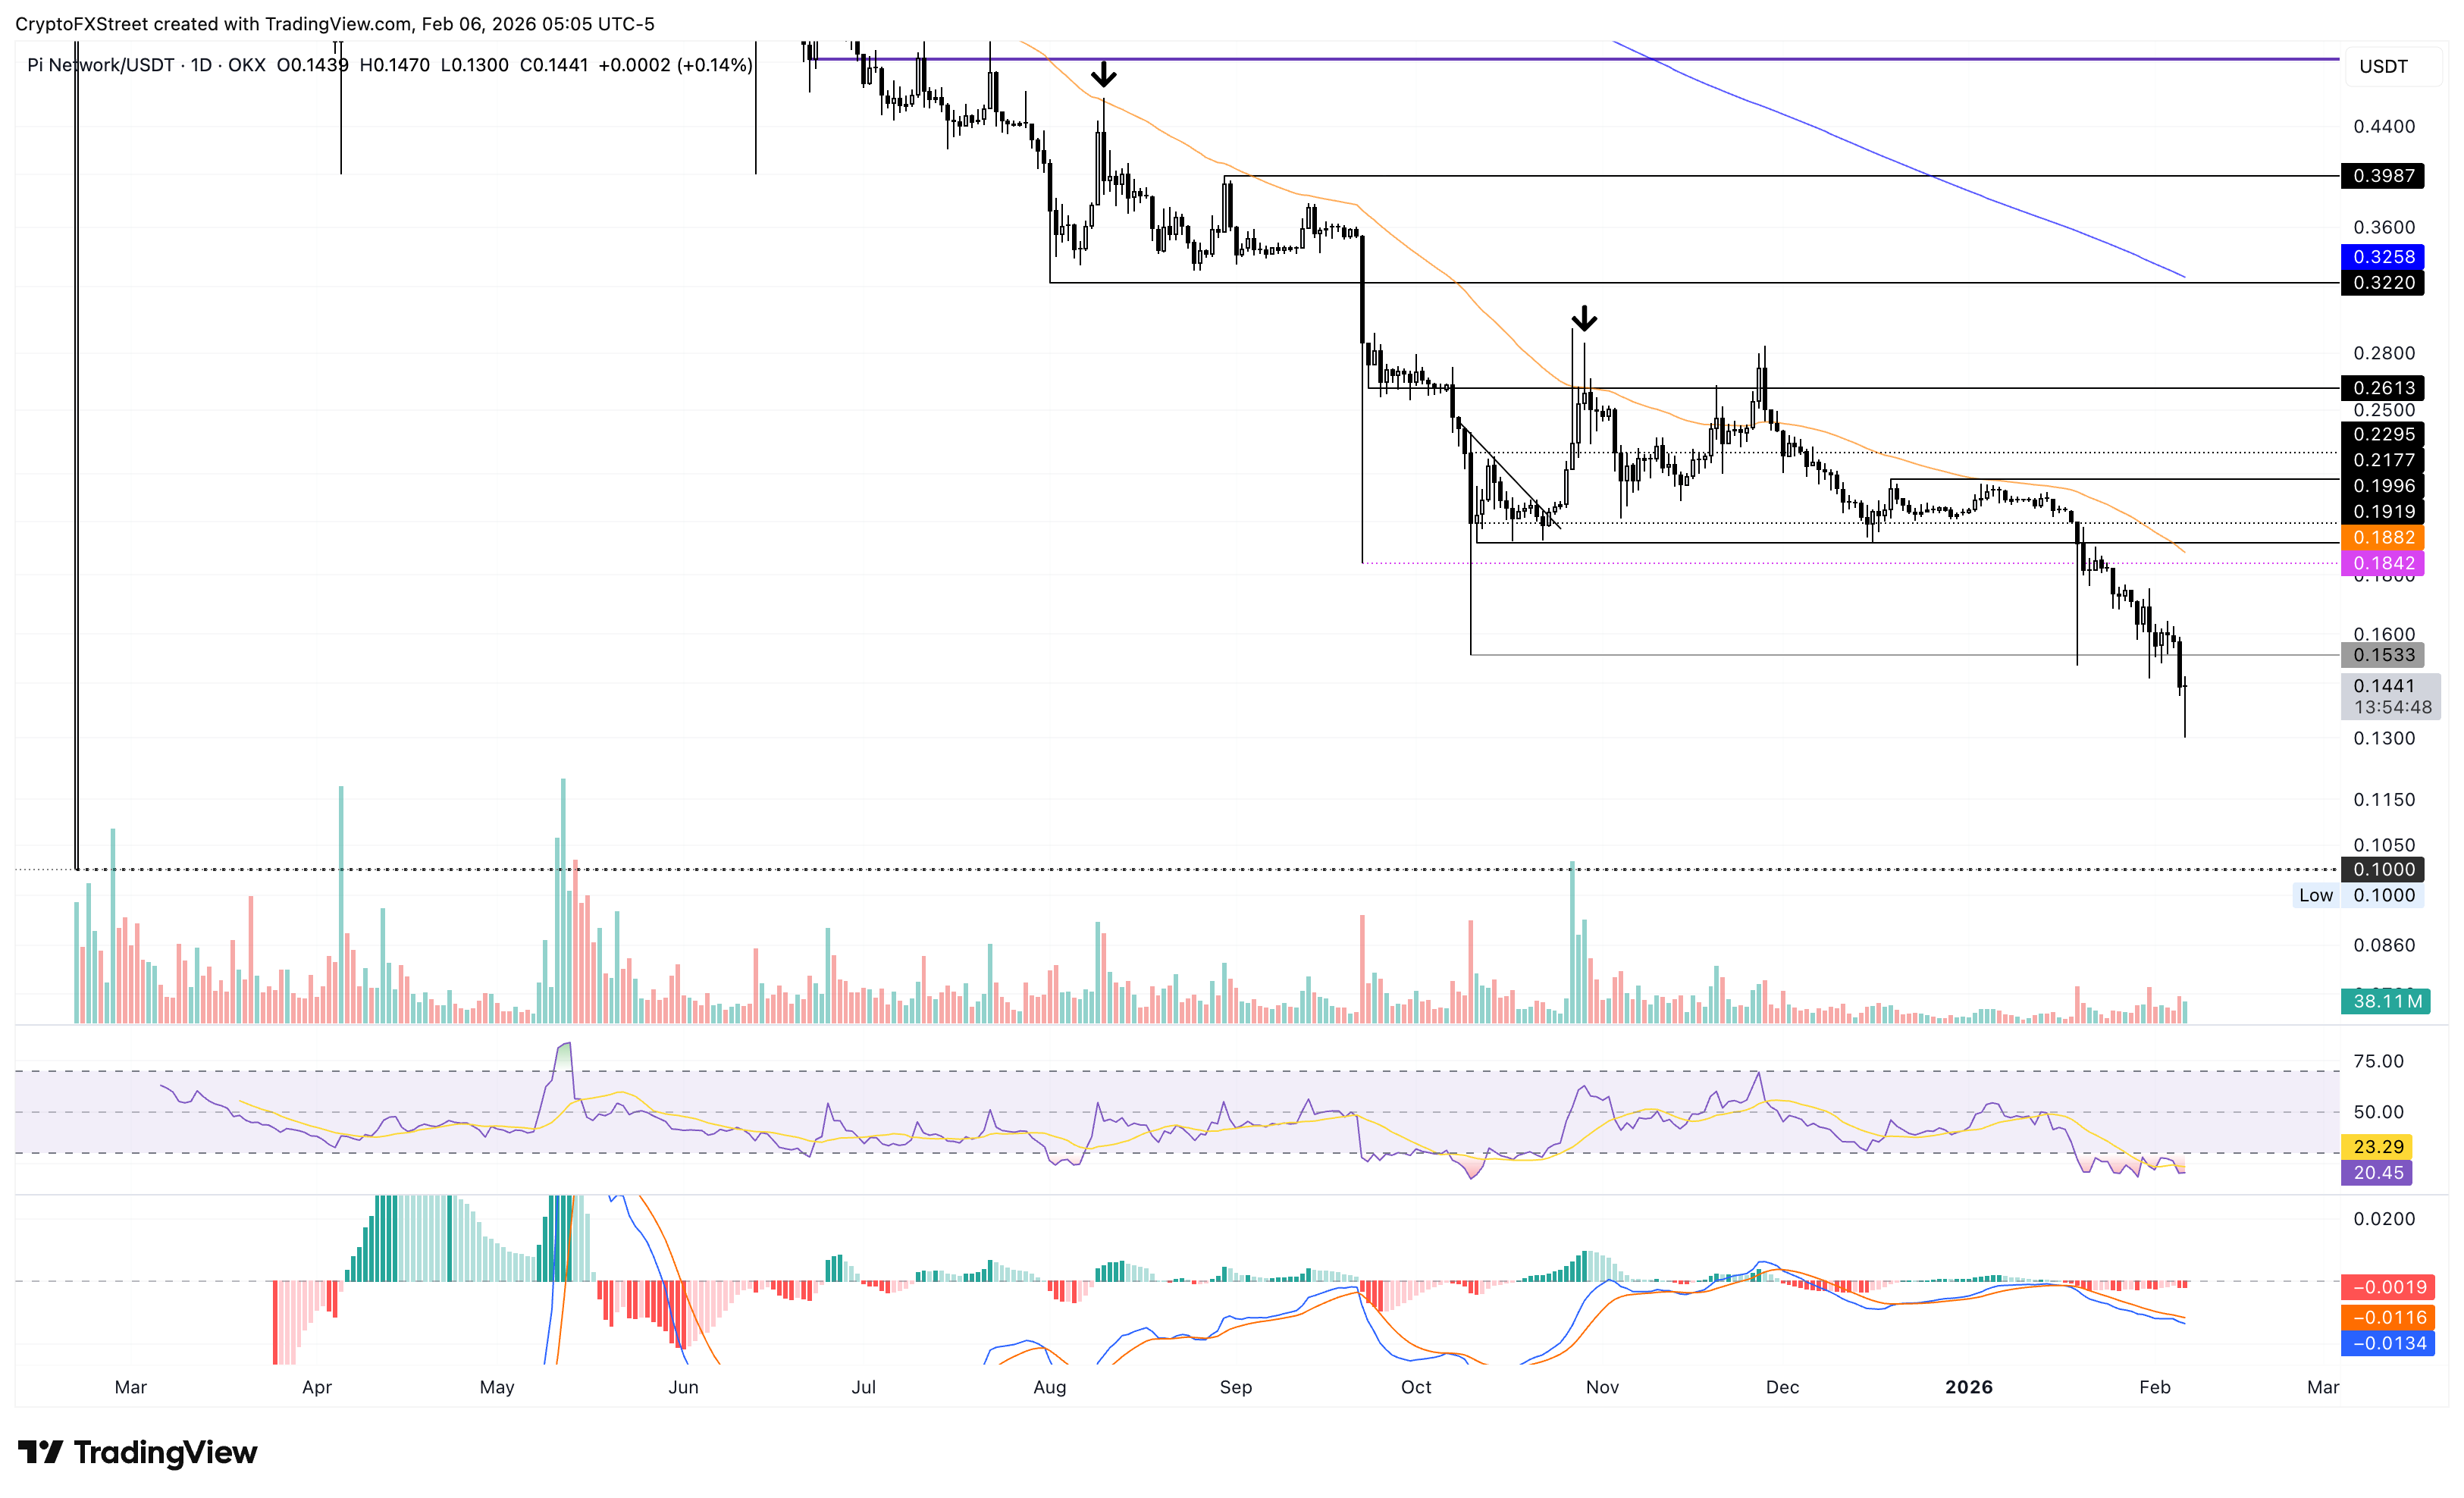
On the upside, PI should reclaim the $0.1533 level to ease headwinds and start a recovery.

100만 명이 넘는 사용자가 FXStreet를 통해 실시간 시장 데이터, 차트 도구, 전문가 인사이트, 포렉스 뉴스를 이용합니다. 포괄적인 경제 캘린더와 교육 웨비나는 트레이더가 정보를 유지하고 신중한 결정을 내리도록 돕습니다. FXStreet는 바르셀로나 본사와 전 세계 지역에 걸쳐 약 60명의 팀으로 구성되어 있습니다.
더 읽기


