
Pi Network Price Forecast: PI holds steady amid declining social interest, heavy deposits
작성자 Vishal Dixit
게시일: 23 Mar 2026 | 수정일: 23 Mar 2026


인기 기사

Pi Network (PI) is up 4% at press time on Monday, trading between the 50-day and 100-day Exponential Moving Averages (EMAs). The declining social interest in Pi Network and a surge in PI token deposits on Centralized Exchanges (CEXs) flag downside risk.
- Pi Network is up 4% so far on Monday, bouncing off its 50-day EMA.
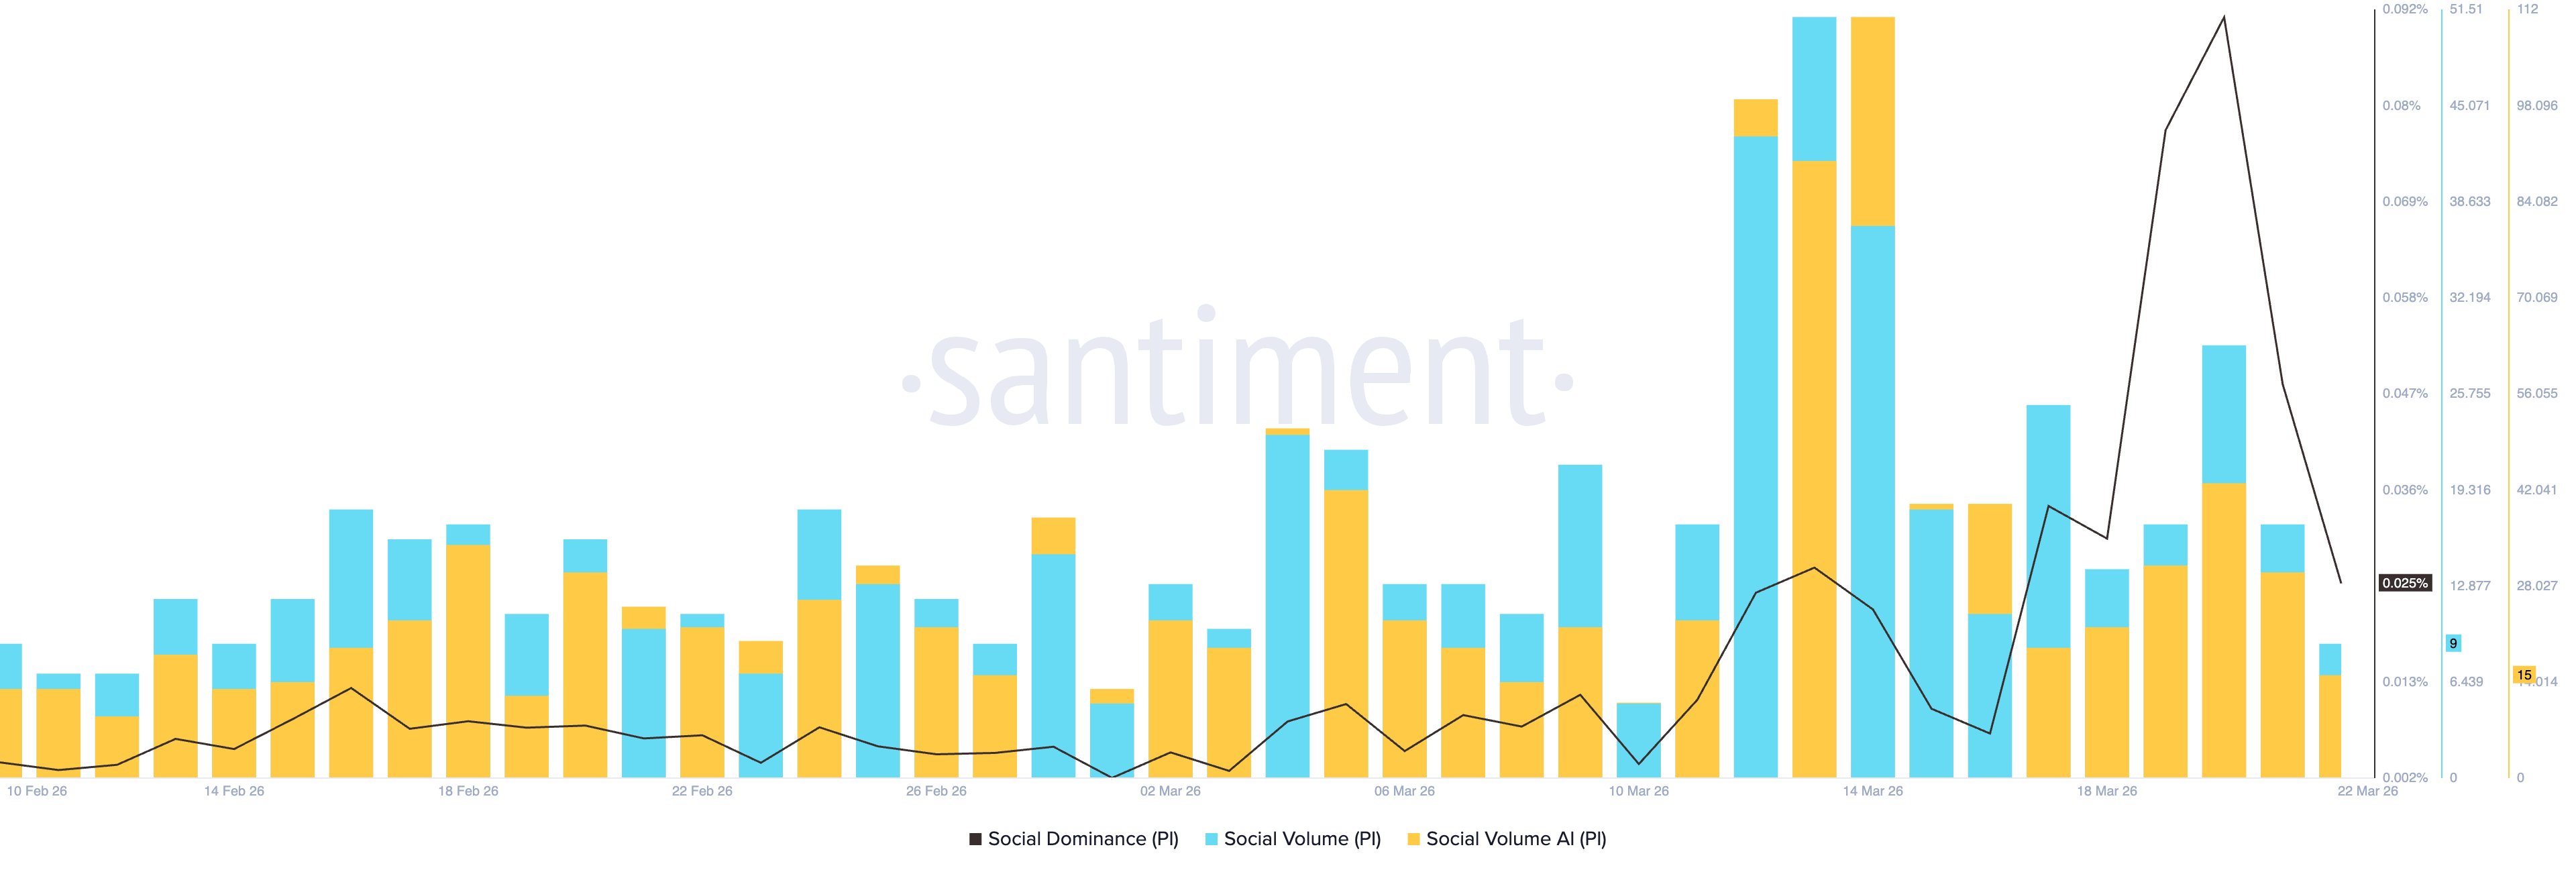
- Data shows a steady decline in social buzz around Pi Network.
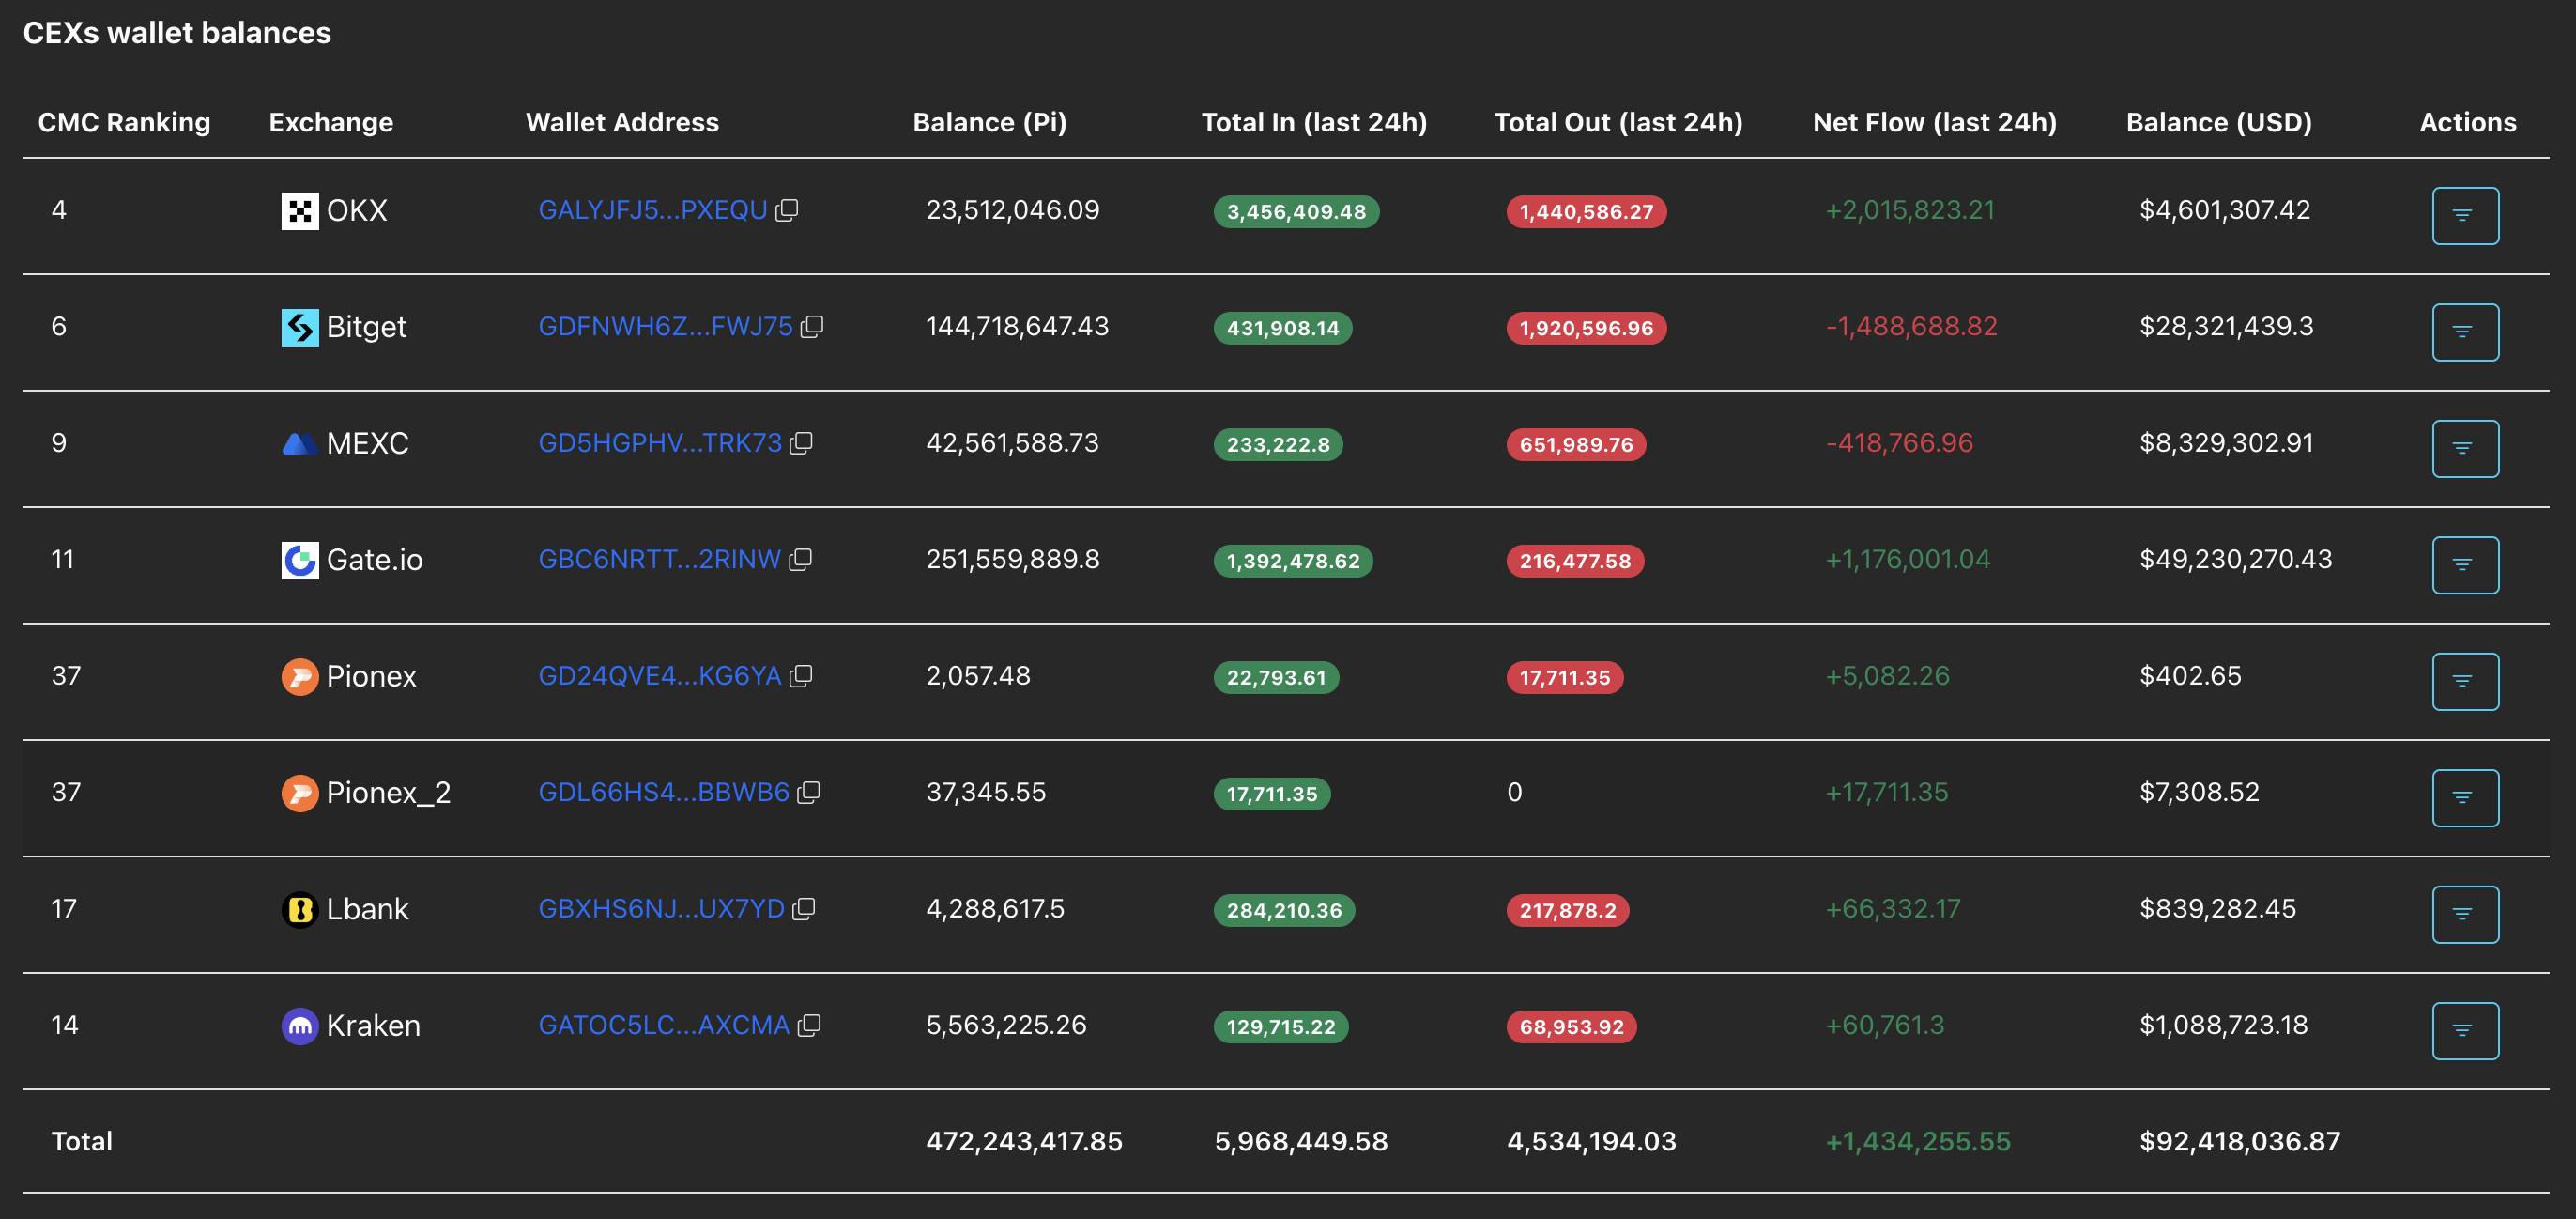
- Large PI token deposits on centralized exchanges risk exerting downward pressure.
Pi Network (PI) is up 4% at press time on Monday, trading between the 50-day and 100-day Exponential Moving Averages (EMAs). The declining social interest in Pi Network and a surge in PI token deposits on Centralized Exchanges (CEXs) flag downside risk. The technical outlook for Pi Network is mixed, as the key moving averages are holding the short-term trend in a range.
Pi Network on thin ice as social buzz drops and deposits rise
Santiment data shows a sudden decline in Pi Network's social dominance to 0.025% among the top 100 cryptocurrencies. Typically, a drop in Pi Network's media exposure signals downside risk, as PI remains a largely speculative token driven by its community.
Meanwhile, PiScan data shows 1.43 million PI tokens deposited in the last 24 hours, suggesting a potential profit-taking phase by US investors after the listing on Kraken Exchange, which recorded over 60,000 PI token inflows and over 2 million PI tokens on OKX exchange in the same period.
A consistent increase in PI deposits on CEXs risks rising downside pressure on PI spot prices. However, a rebound in Pi Network's social dominance could defuse the situation, leading to an extended recovery.
Technical outlook: Could Pi Network extend recovery above its 100-day EMA?
Pi Network edges higher by 4% at press time on Monday, regaining ground after a 4% decline the previous day. The rebound from the 50-day Exponential Moving Average (EMA) at $0.1895, which still offers a nearby dynamic pivot, faces resistance from the declining 100-day EMA at $0.1980. Meanwhile, the overhanging 200-day EMA keeps the broader trend bearish.
The Moving Average Convergence Divergence (MACD) line is below the signal line, suggesting bearish momentum has dominated since the recent rejection from the 200-day EMA. The Relative Strength Index (RSI) at 51 stays close to its midline, reinforcing a lack of strong upside momentum as price fades from the recent swing high.
On the upside, a daily close above the 100-day EMA at $0.1980 is needed to ease the downside bias and open a move toward the March 7 high at $0.2396. A stronger recovery would meet further resistance around the 200-day EMA at $0.2745.
Immediate support appears at the 50-day EMA near $0.1895, followed by the $0.1736 support level if selling pressure extends.
(The technical analysis of this story was written with the help of an AI tool.)
Bitcoin, altcoins, stablecoins FAQs
Bitcoin is the largest cryptocurrency by market capitalization, a virtual currency designed to serve as money. This form of payment cannot be controlled by any one person, group, or entity, which eliminates the need for third-party participation during financial transactions.
Altcoins are any cryptocurrency apart from Bitcoin, but some also regard Ethereum as a non-altcoin because it is from these two cryptocurrencies that forking happens. If this is true, then Litecoin is the first altcoin, forked from the Bitcoin protocol and, therefore, an “improved” version of it.
Stablecoins are cryptocurrencies designed to have a stable price, with their value backed by a reserve of the asset it represents. To achieve this, the value of any one stablecoin is pegged to a commodity or financial instrument, such as the US Dollar (USD), with its supply regulated by an algorithm or demand. The main goal of stablecoins is to provide an on/off-ramp for investors willing to trade and invest in cryptocurrencies. Stablecoins also allow investors to store value since cryptocurrencies, in general, are subject to volatility.
Bitcoin dominance is the ratio of Bitcoin's market capitalization to the total market capitalization of all cryptocurrencies combined. It provides a clear picture of Bitcoin’s interest among investors. A high BTC dominance typically happens before and during a bull run, in which investors resort to investing in relatively stable and high market capitalization cryptocurrency like Bitcoin. A drop in BTC dominance usually means that investors are moving their capital and/or profits to altcoins in a quest for higher returns, which usually triggers an explosion of altcoin rallies.

100만 명이 넘는 사용자가 FXStreet를 통해 실시간 시장 데이터, 차트 도구, 전문가 인사이트, 포렉스 뉴스를 이용합니다. 포괄적인 경제 캘린더와 교육 웨비나는 트레이더가 정보를 유지하고 신중한 결정을 내리도록 돕습니다. FXStreet는 바르셀로나 본사와 전 세계 지역에 걸쳐 약 60명의 팀으로 구성되어 있습니다.
더 읽기


