
Pi Network Price Forecast: Bearish outlook as supply pressure mounts on CEXs
작성자 Vishal Dixit
게시일: 8 Dec 2025 | 수정일: 8 Dec 2025


인기 기사

Pi Network (PI) has been in a steady decline below the 50-day Exponential Moving Average (EMA), trading near $0.2200 at press time on Monday.
- Pi Network risks falling below $0.2200 as its decline continues below the 50-day EMA.
- A surge in centralized exchanges' reserves amid increasing mainnet migration signals rising supply pressure.
- The technical outlook for Pi Network remains bearish, targeting $0.1919.
Pi Network (PI) has been in a steady decline below the 50-day Exponential Moving Average (EMA), trading near $0.2200 at press time on Monday. The mobile mining cryptocurrency risks further losses as supply reserves on Centralized Exchanges (CEXs) surge amid a sharp increase in mainnet token migration. The technical outlook for the PI token highlights that the path of least resistance is to the downside.
Supply pressure on the rise
A steady rise in PI token deposits on exchanges indicates increased selling pressure. PiScan data shows that over the last 24 hours, CEXs' wallets recorded an inflow of 177,867 PI tokens, bringing the total balance to 437.88 million tokens.
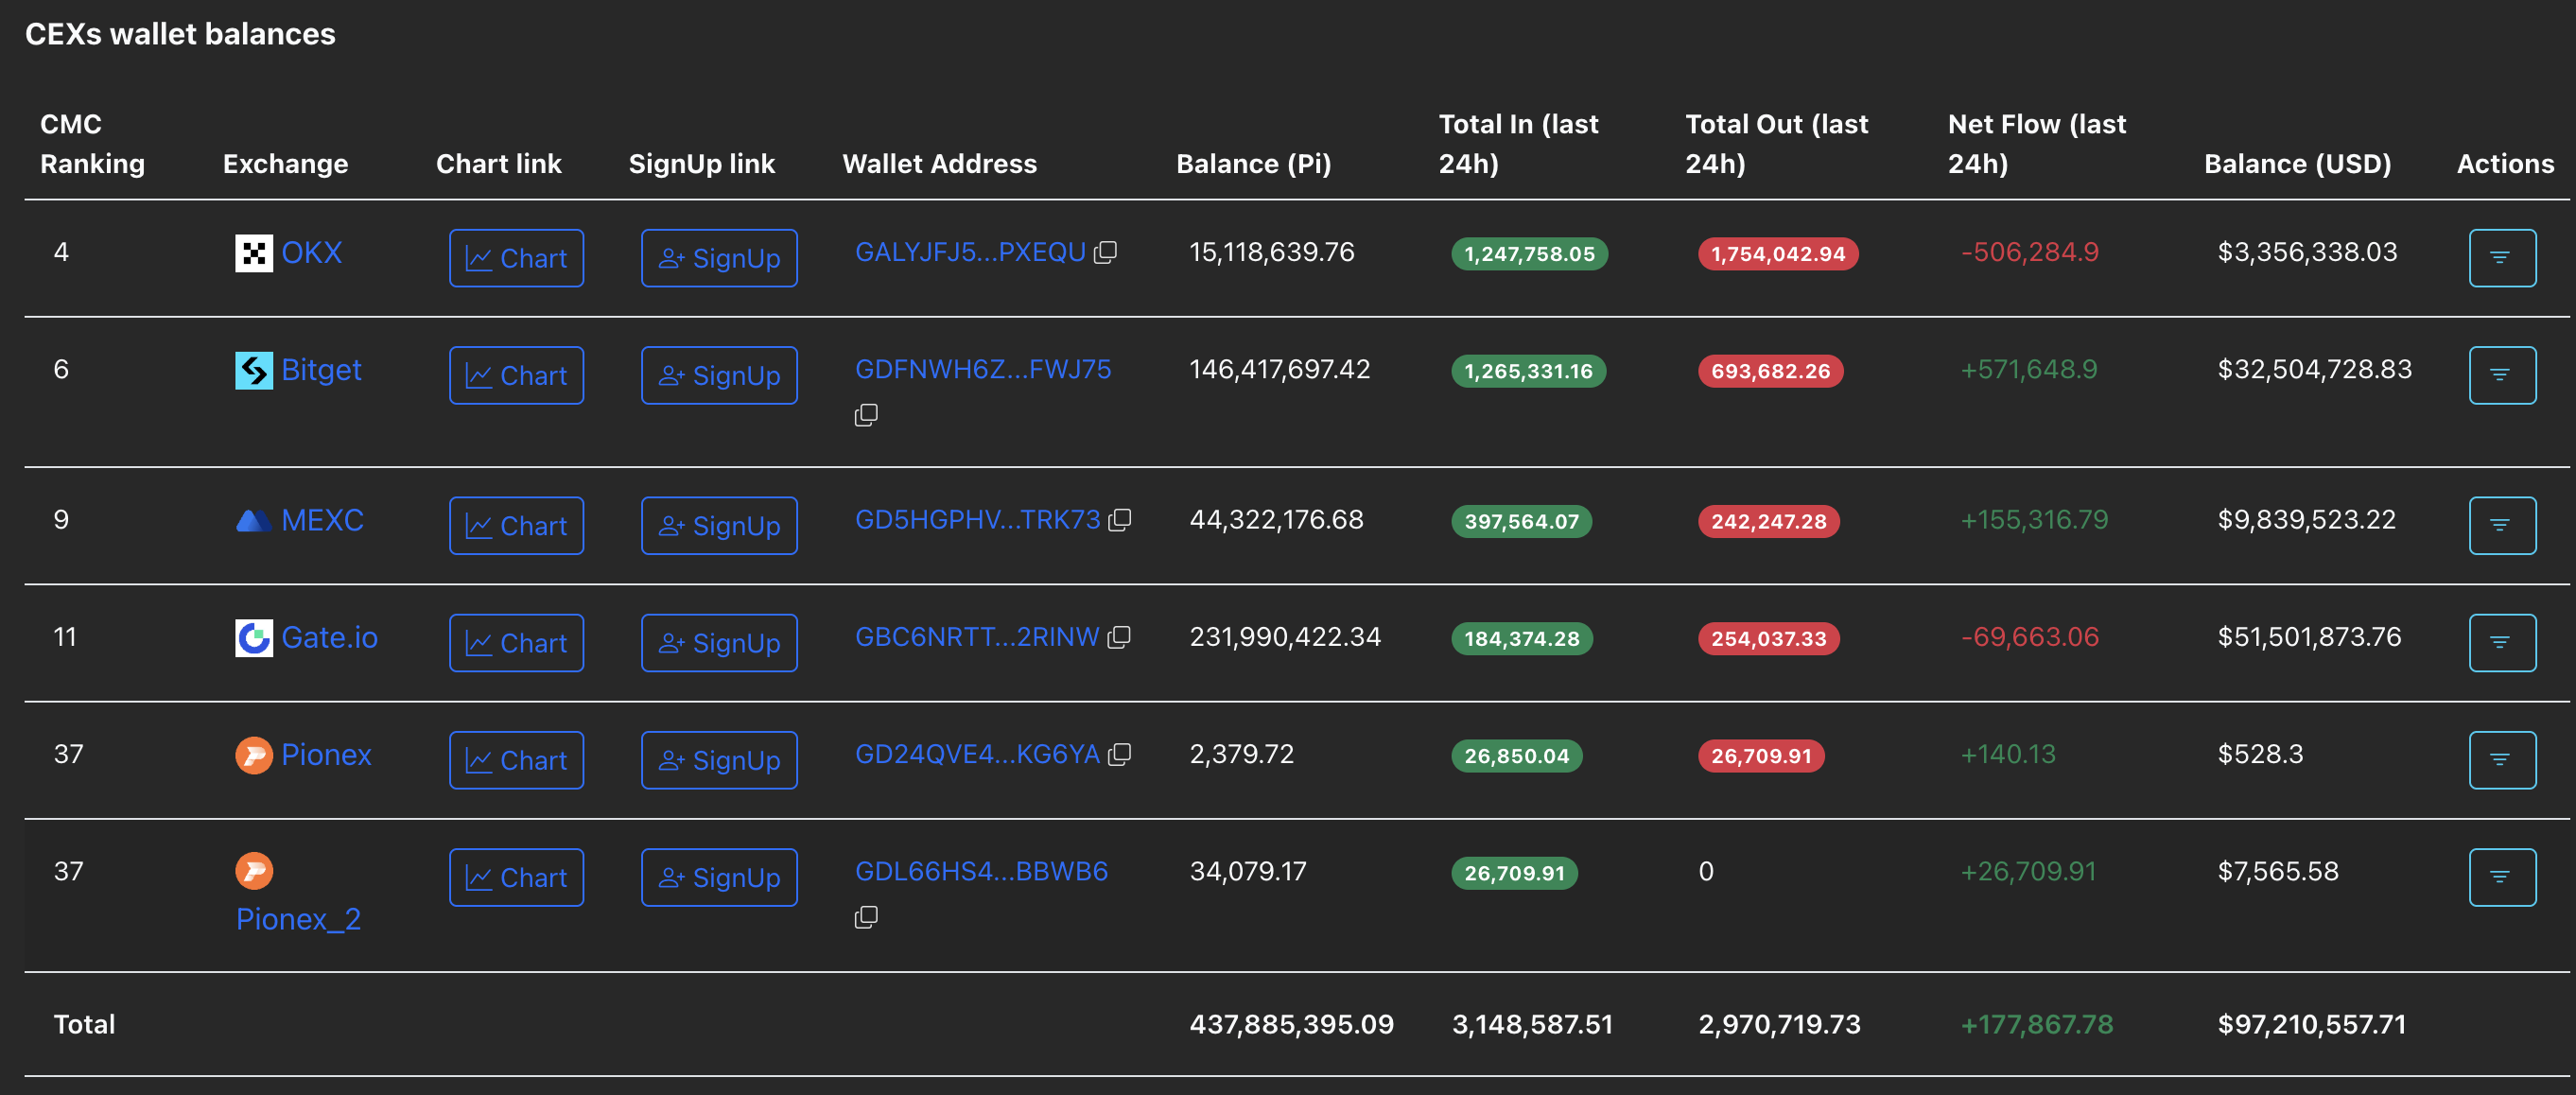
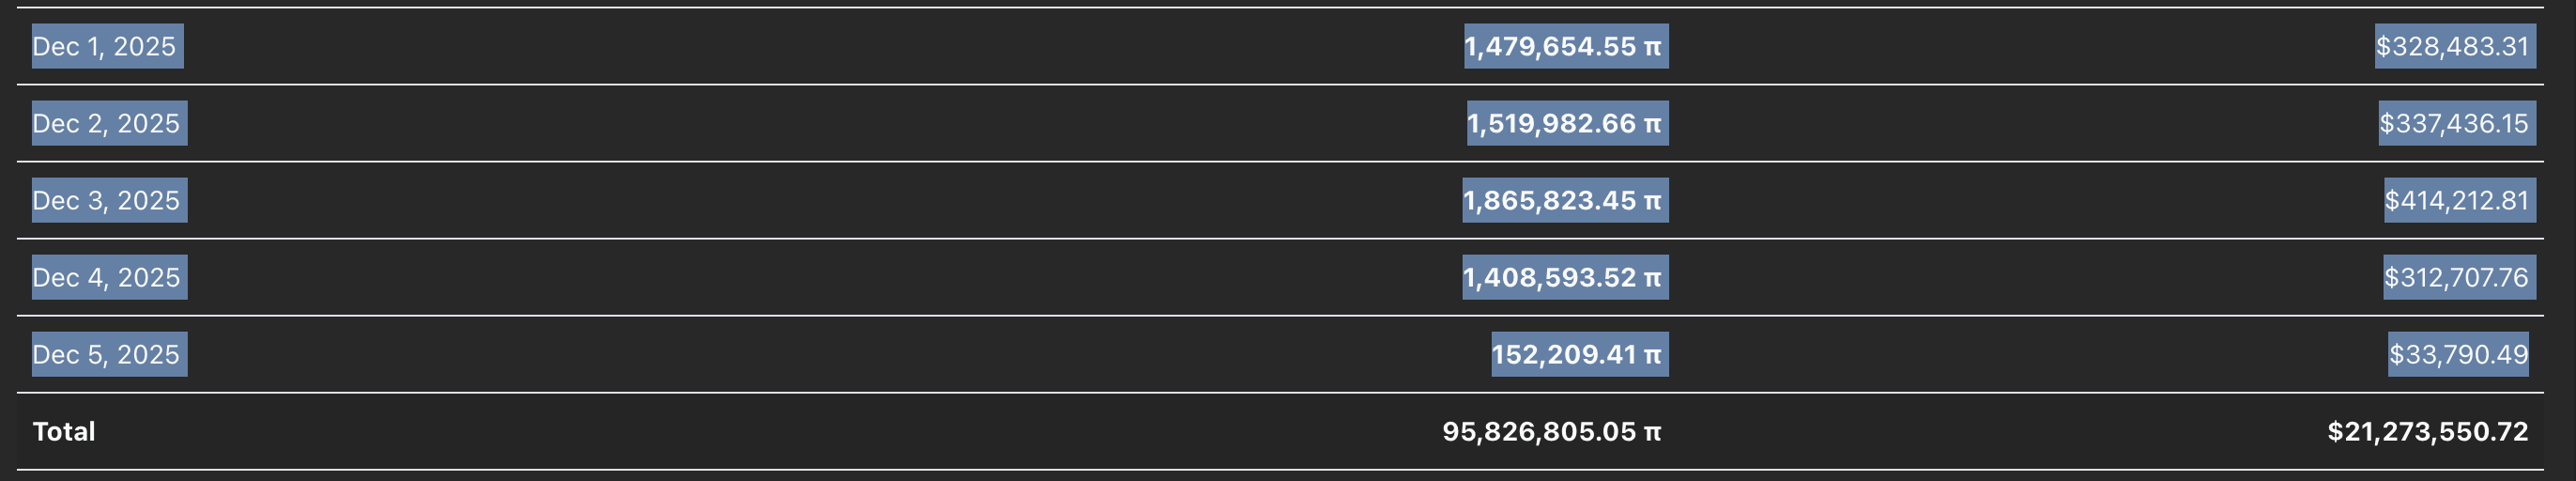
One of the key factors fueling the deposits is the token migration from Pi Network’s testnet to mainnet, as 17.5 million users complete Know Your Customer (KYC) verification. Furthermore, reports from Pi Network suggest that integrating AI into the KYC process has reduced the waiting period by 50%. According to PiScan, over 6.42 million PI tokens have been transferred to the mainnet so far in December.
If the network fails to drive demand for its token through real-world use cases, a decline in investor confidence could further fuel the current selling pressure.
Technical outlook: Looking at $0.1919
Pi Network holds broadly steady at press time on Monday, after a near 2% drop on Sunday. The path of least resistance for PI token targets $0.1919, marked by the October 11 low. If the token slips below this level, it could extend losses toward the record low of $0.1533 seen on October 10.
The technical indicators on the daily chart point to an increase in overhead pressure. The Relative Strength Index (RSI) at 43 is below the halfway line and slopes downward, suggesting bearish potential.
Meanwhile, the Moving Average Convergence Divergence (MACD) maintains a sell signal as the MACD and signal descend below the zero line.
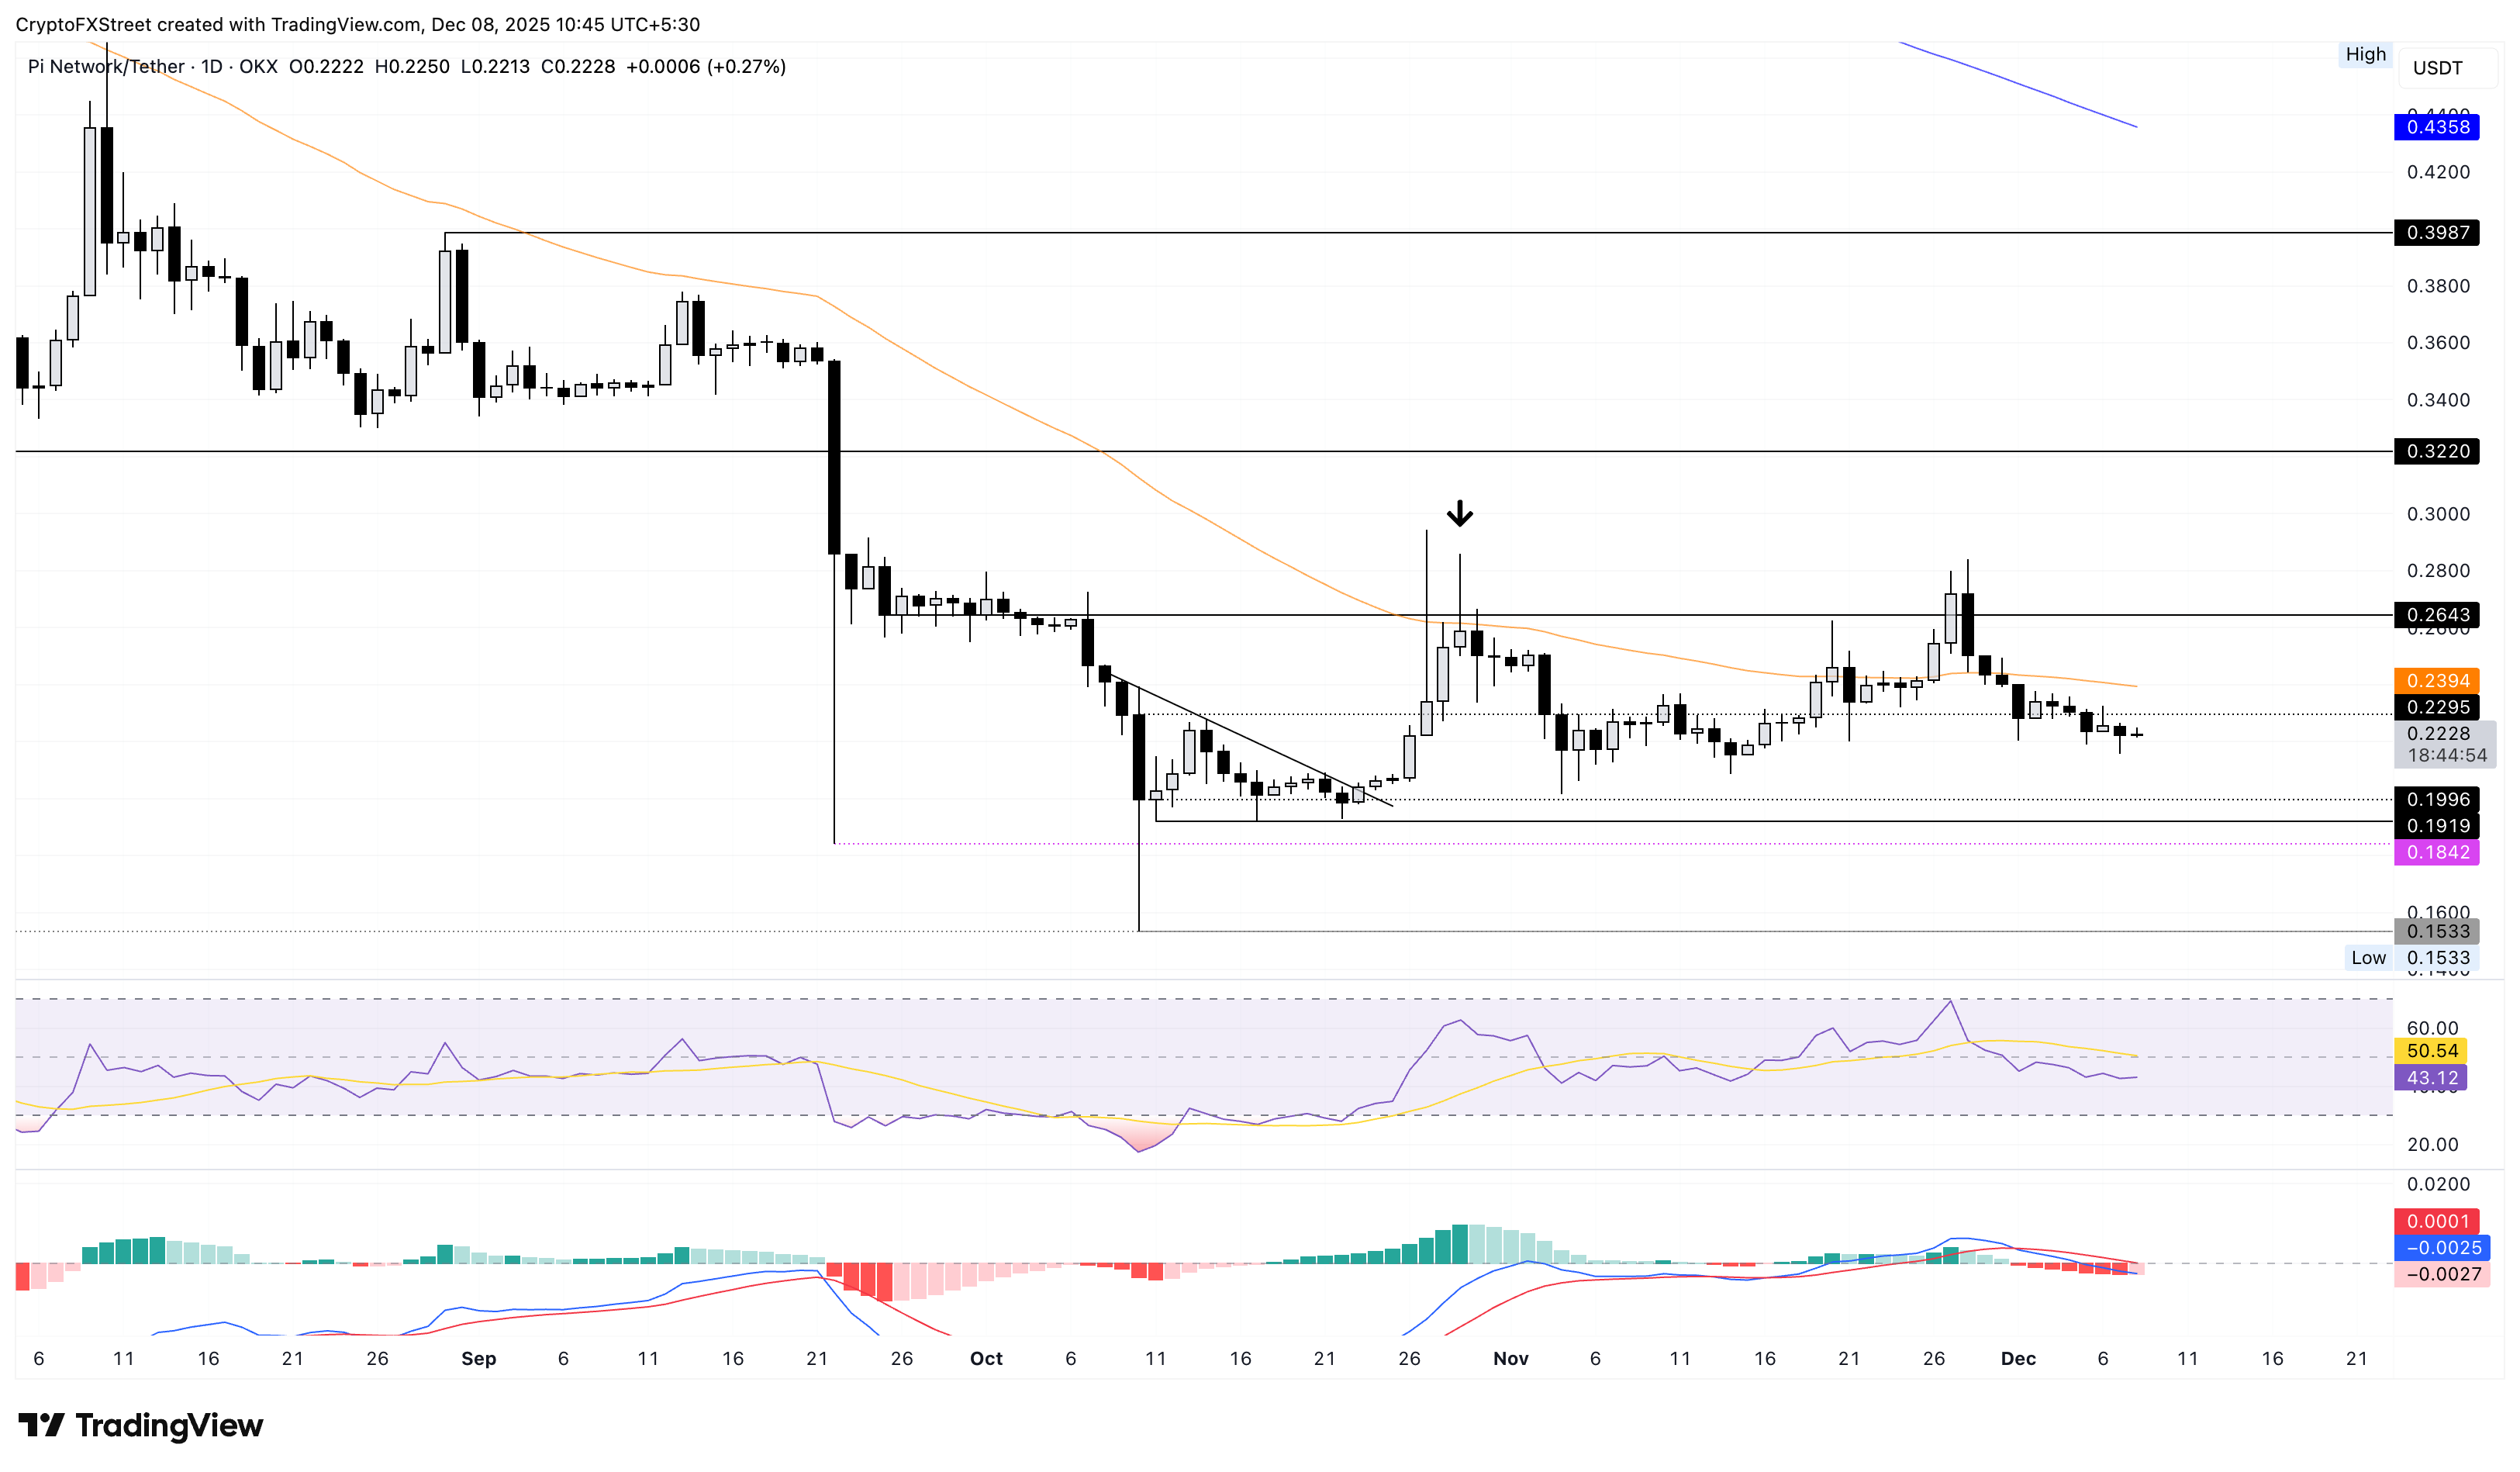
To reinstate an uptrend, the PI token should exceed the 50-day EMA at $0.2394.
Crypto ETF FAQs
An Exchange-Traded Fund (ETF) is an investment vehicle or an index that tracks the price of an underlying asset. ETFs can not only track a single asset, but a group of assets and sectors. For example, a Bitcoin ETF tracks Bitcoin’s price. ETF is a tool used by investors to gain exposure to a certain asset.
Yes. The first Bitcoin futures ETF in the US was approved by the US Securities & Exchange Commission in October 2021. A total of seven Bitcoin futures ETFs have been approved, with more than 20 still waiting for the regulator’s permission. The SEC says that the cryptocurrency industry is new and subject to manipulation, which is why it has been delaying crypto-related futures ETFs for the last few years.
Yes. The SEC approved in January 2024 the listing and trading of several Bitcoin spot Exchange-Traded Funds, opening the door to institutional capital and mainstream investors to trade the main crypto currency. The decision was hailed by the industry as a game changer.
The main advantage of crypto ETFs is the possibility of gaining exposure to a cryptocurrency without ownership, reducing the risk and cost of holding the asset. Other pros are a lower learning curve and higher security for investors since ETFs take charge of securing the underlying asset holdings. As for the main drawbacks, the main one is that as an investor you can’t have direct ownership of the asset, or, as they say in crypto, “not your keys, not your coins.” Other disadvantages are higher costs associated with holding crypto since ETFs charge fees for active management. Finally, even though investing in ETFs reduces the risk of holding an asset, price swings in the underlying cryptocurrency are likely to be reflected in the investment vehicle too.

100만 명이 넘는 사용자가 FXStreet를 통해 실시간 시장 데이터, 차트 도구, 전문가 인사이트, 포렉스 뉴스를 이용합니다. 포괄적인 경제 캘린더와 교육 웨비나는 트레이더가 정보를 유지하고 신중한 결정을 내리도록 돕습니다. FXStreet는 바르셀로나 본사와 전 세계 지역에 걸쳐 약 60명의 팀으로 구성되어 있습니다.
더 읽기


