
Pi Network Price Forecast: PI under pressure as outflows rise, support level in focus
작성자 Vishal Dixit
게시일: 4 Feb 2026 | 수정일: 4 Feb 2026


인기 기사

Pi Network (PI) trades above $0.1600 at press time on Wednesday, struggling to extend the 2% gains from Monday. A steady increase in deposits at exchanges supporting PI tokens and the trimming of Pi Foundation holdings add to downside pressure.
- Pi Network holds above $0.1600 on Wednesday, following a 2% boost on Monday.
- PiScan data indicates consistent outflows from the Pi core team and increasing deposits on exchanges that support the PI token.
- The technical outlook for Pi Network remains mixed, keeping the crucial support in focus.
Pi Network (PI) trades above $0.1600 at press time on Wednesday, struggling to extend the 2% gains from Monday. A steady increase in deposits at exchanges supporting PI tokens and the trimming of Pi Foundation holdings add to downside pressure. The technical outlook remains mixed, with PI holding above a crucial support level and the RSI indicator still oversold.
Large deposits signal increased bearish pressure
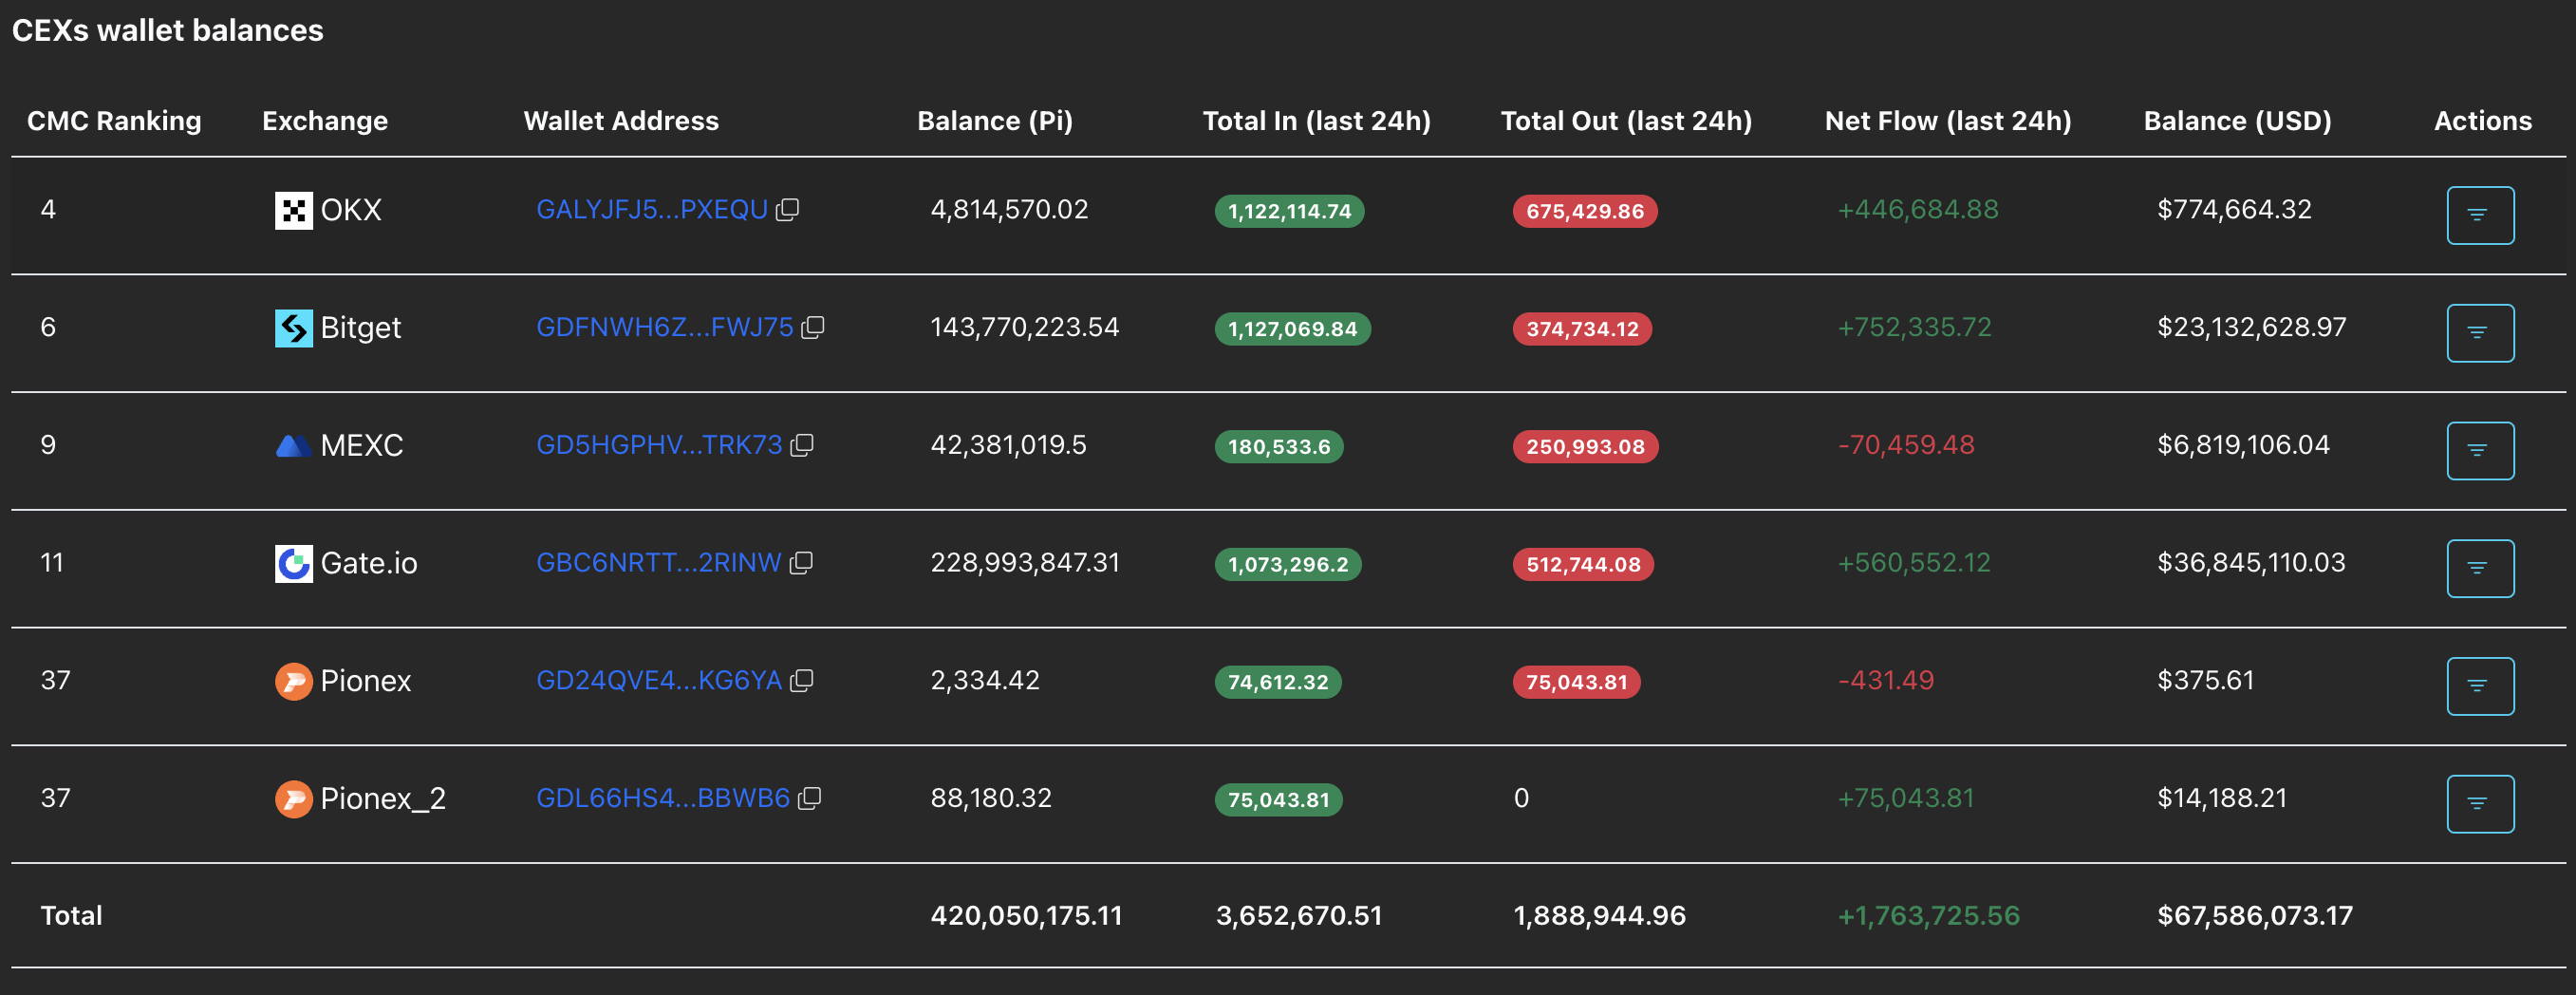
PiScan data indicate a sharp decline in confidence among both holders and the core team amid substantial PI token outflows. On the retail side, Centralized Exchanges (CEXs) recorded a net flow of 1.76 million PI tokens over the last 24 hours, indicating a broader risk-off sentiment among mainnet users.
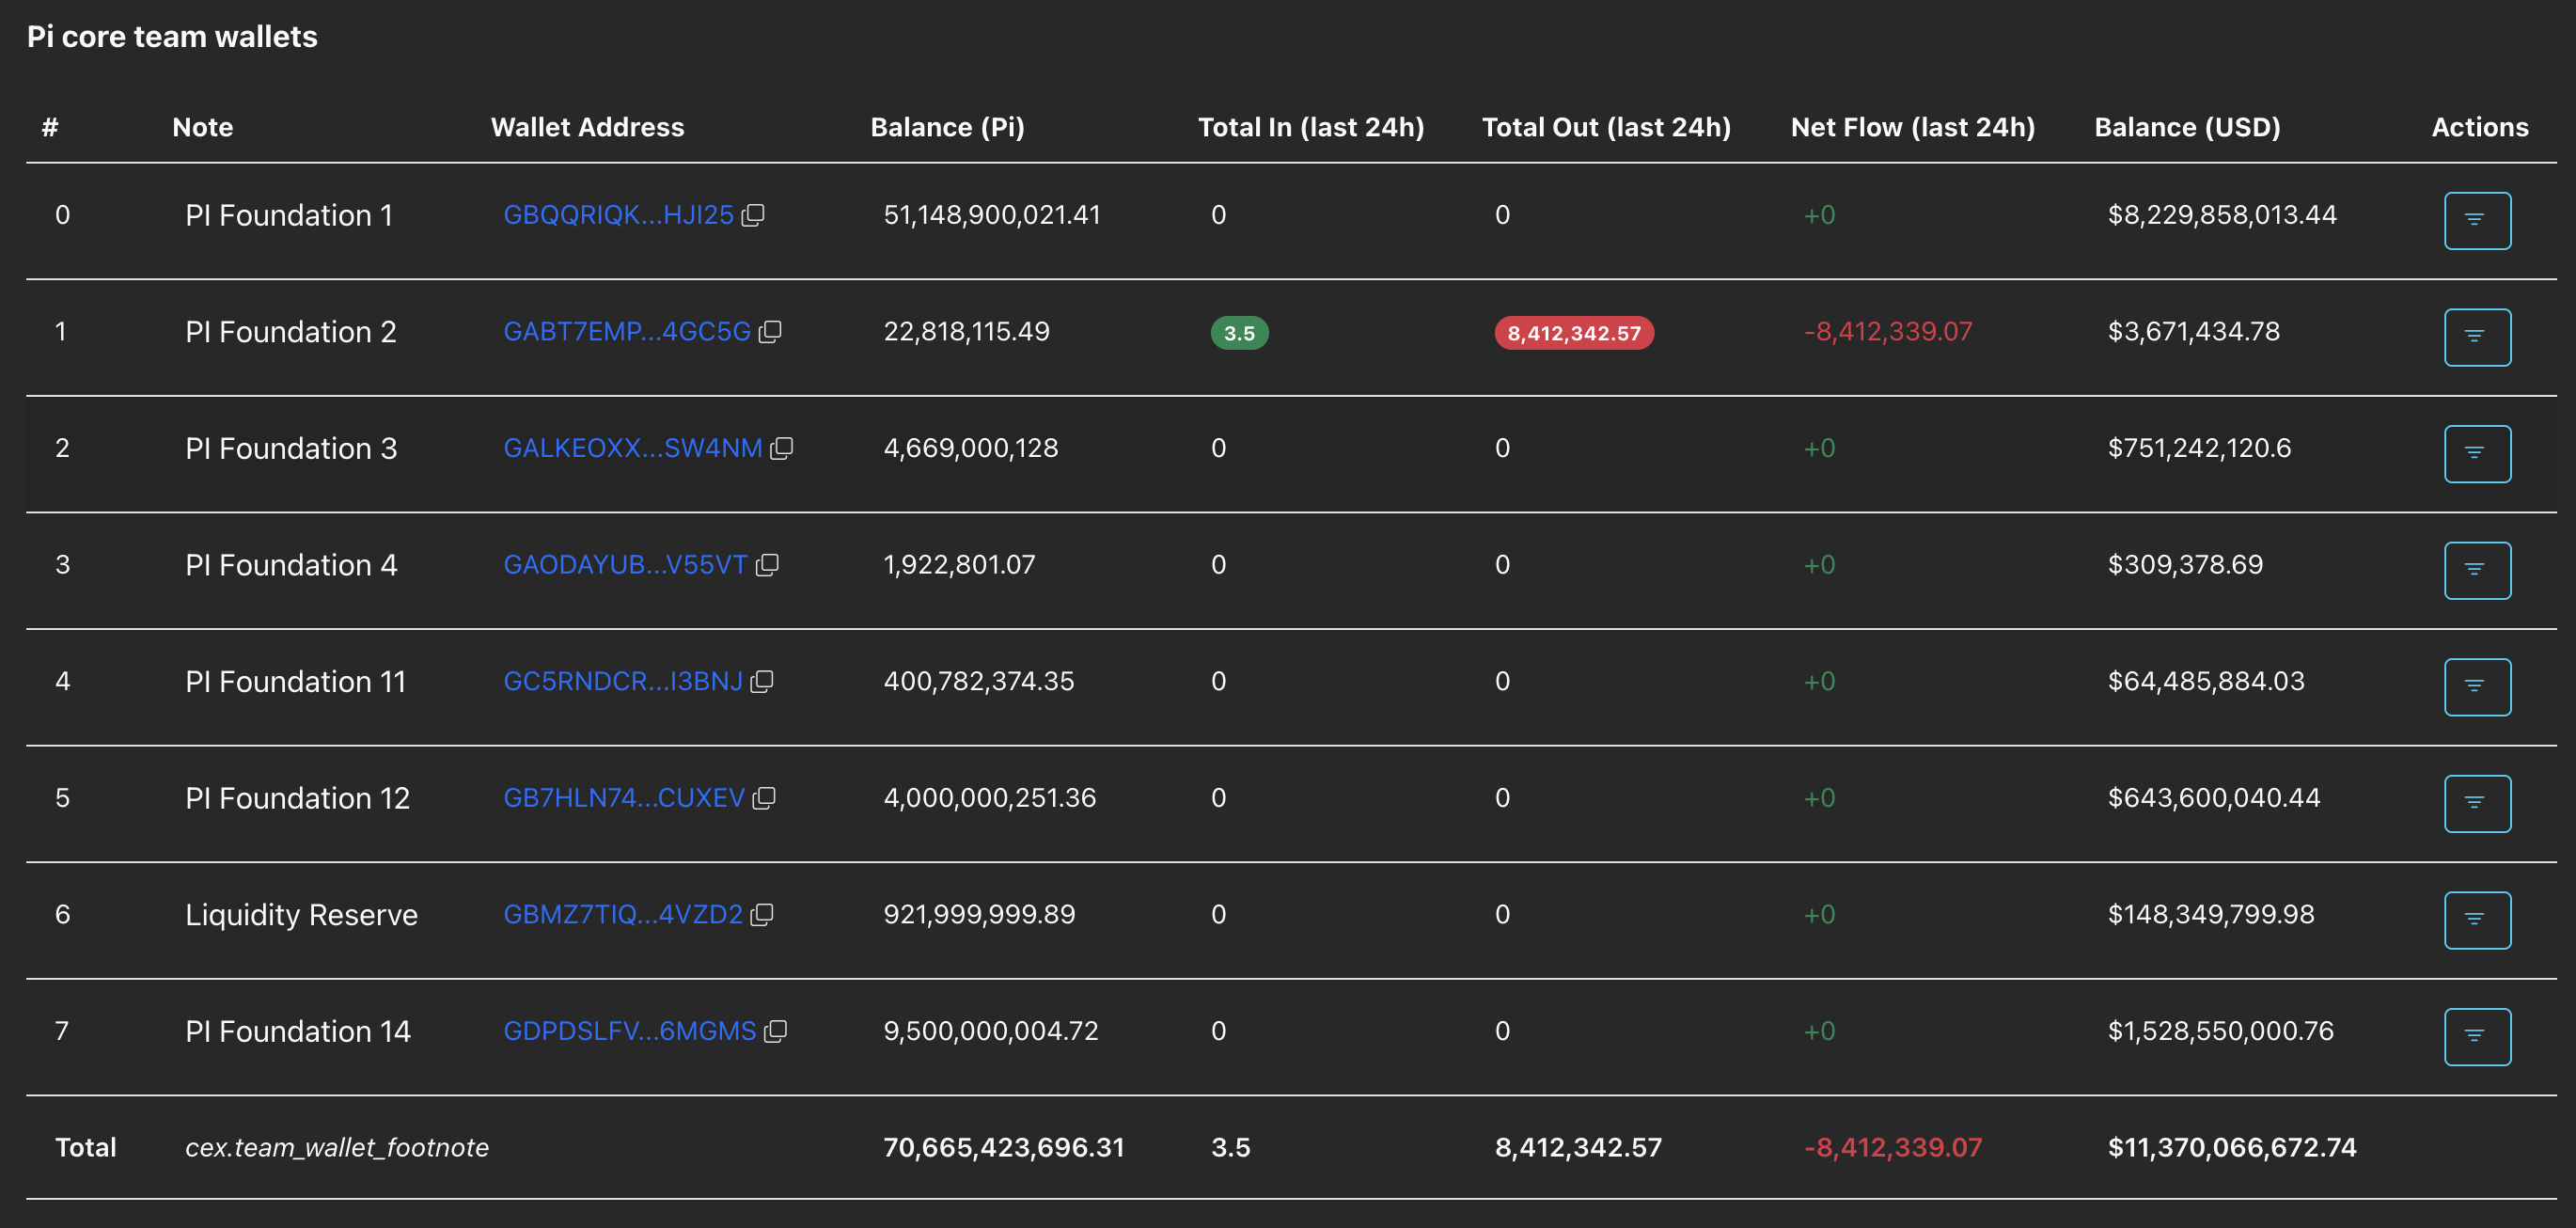
Meanwhile, the Pi core team wallets recorded an outflow of 8.41 million PI tokens during the same period, further intensifying supply pressure. A steady increase in deposits and outflows after Monday’s recovery suggests a likely race to take profits among holders.
Pi Network struggles to extend recovery
Pi Network held above the December 18 low at $0.1533, avoiding a bearish close. An easing of selling pressure earlier this week led to a more than 2% rise on Monday, pushing PI above $0.1600.
However, the short-term recovery is struggling to gain momentum, risking a reversal to $0.1533. If PI slips a daily close below this level, it would open the door to the S1 Pivot Point at $0.1327.
The technical indicators on the daily chart flash mixed signals. The Relative Strength Index (RSI) at 39 remains oversold, suggesting heightened bearish pressure. However, the Moving Average Convergence Divergence (MACD) is approaching the signal line, suggesting a potential crossover that could signal renewed bullish momentum.
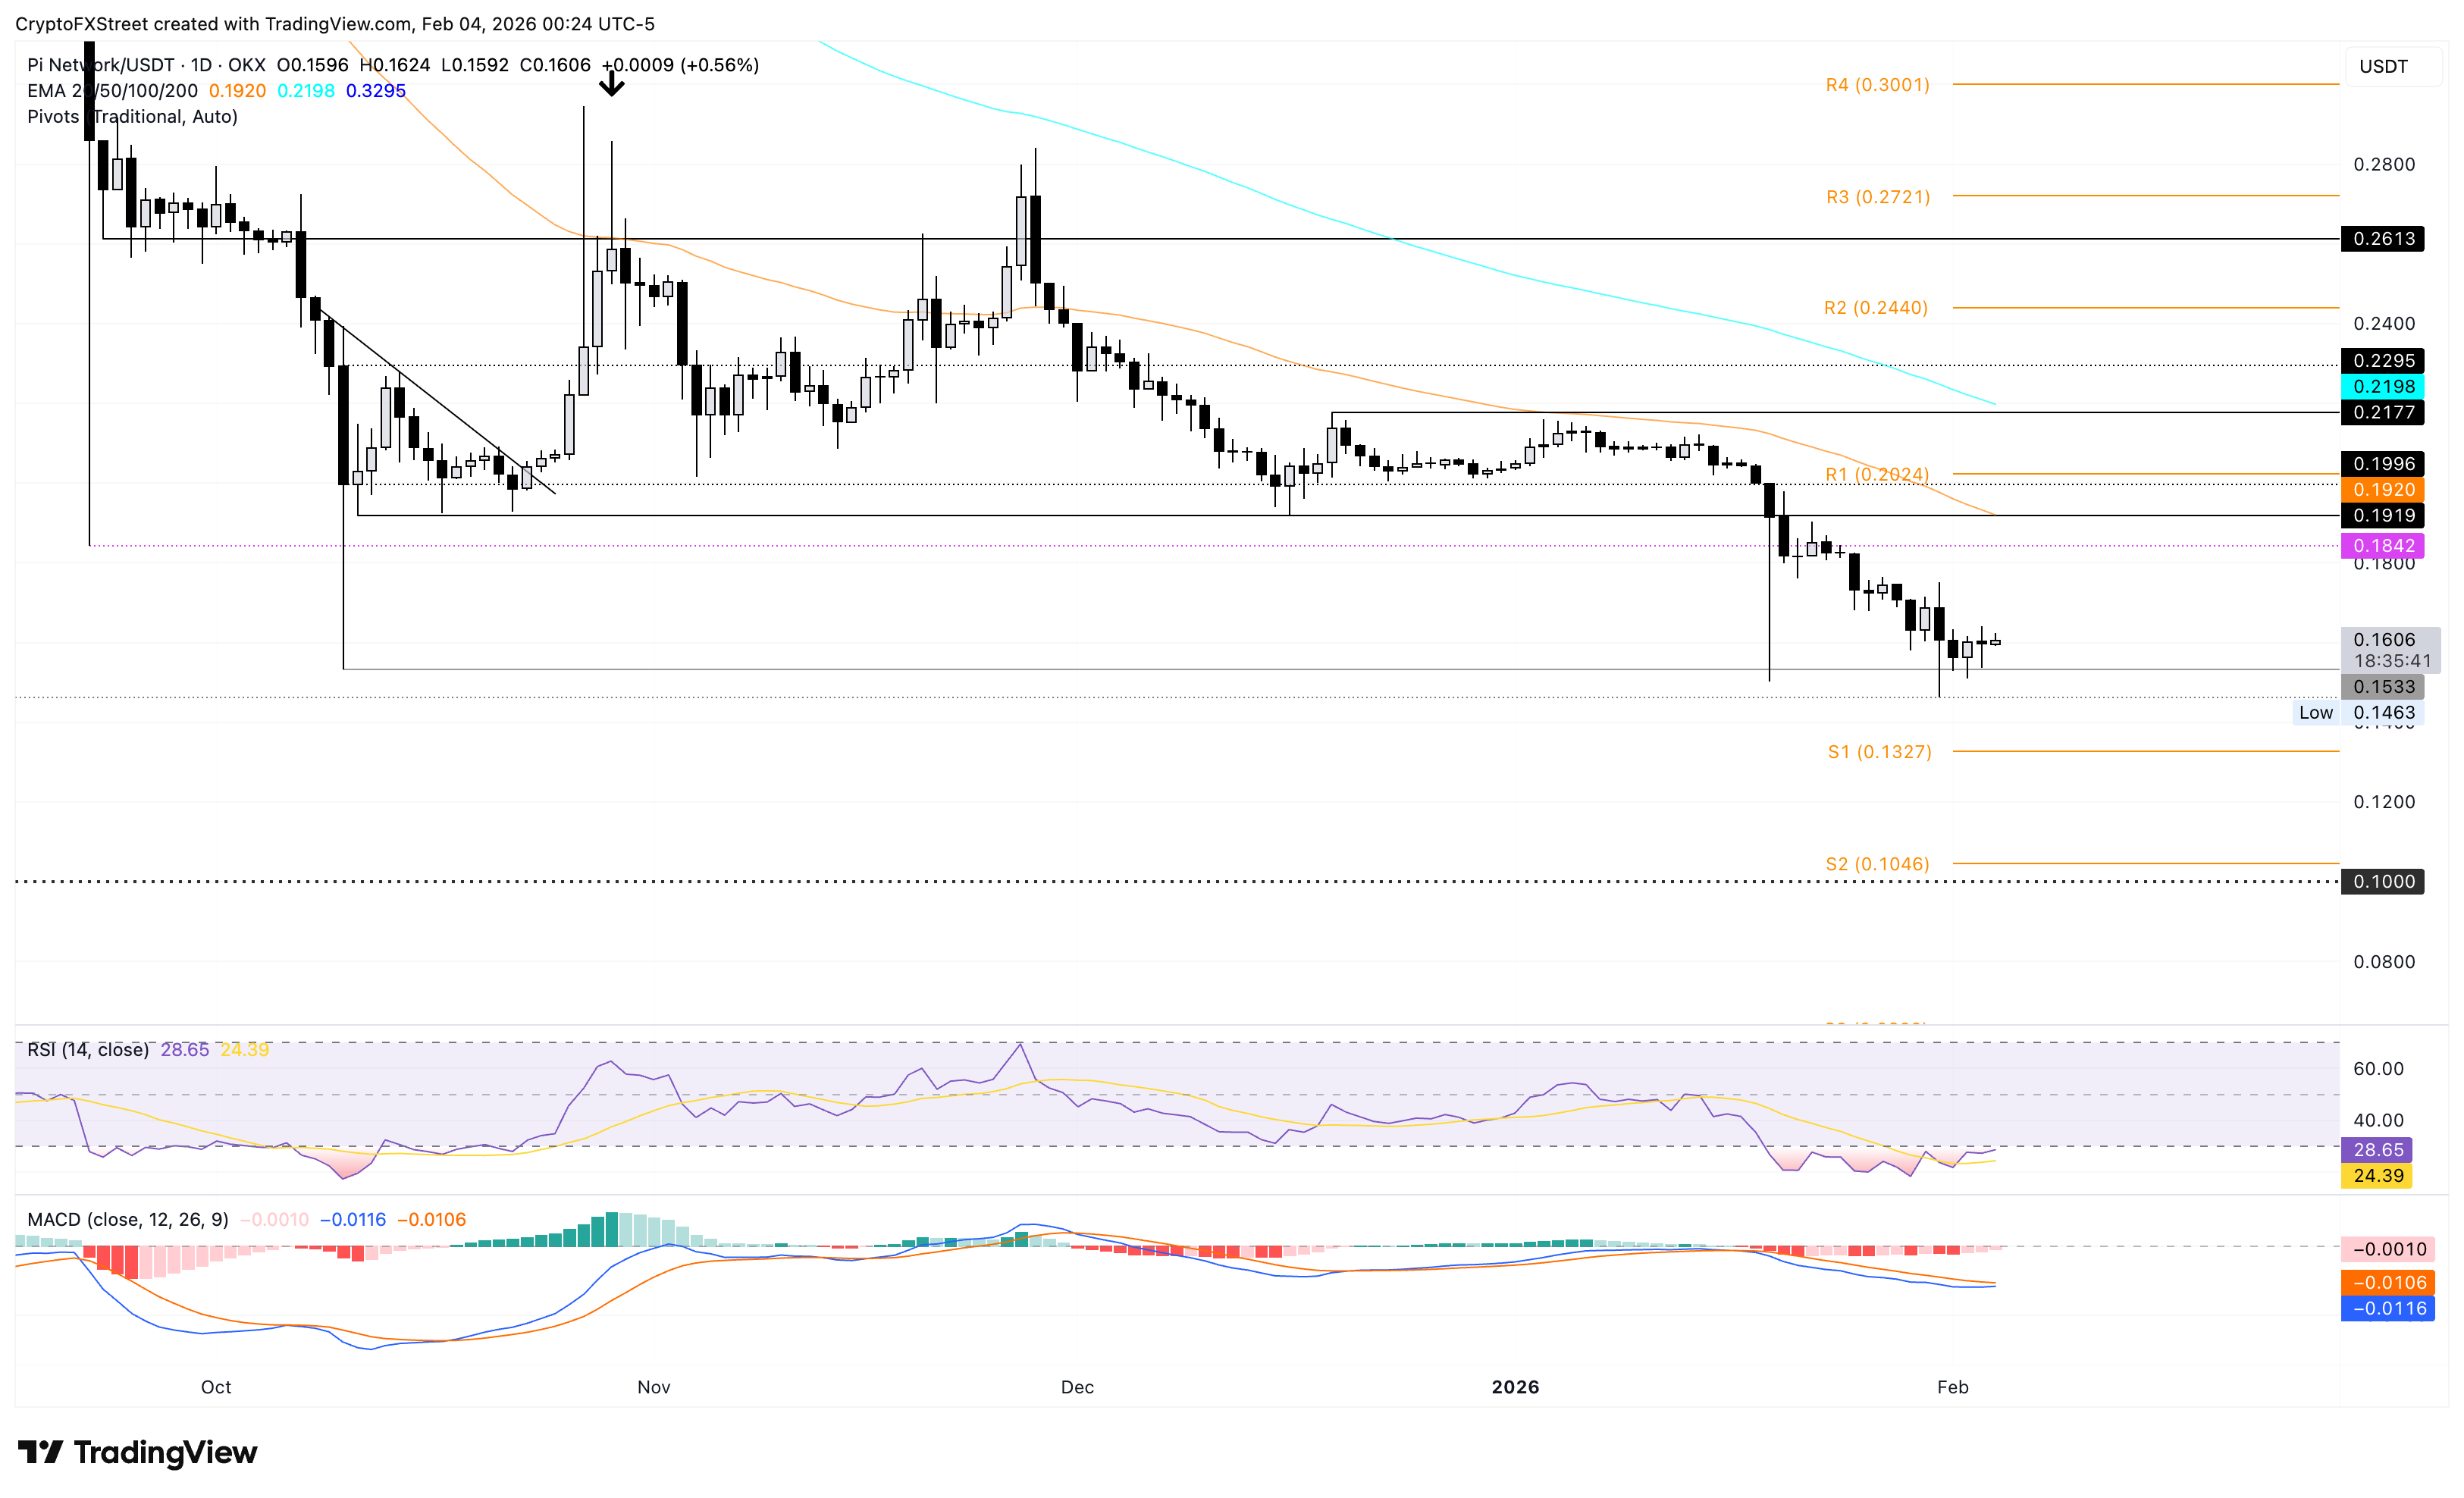
On the upside, a recovery run in PI could target the 50-day Exponential Moving Average (EMA) at $0.1920, close to the October 11 low at $0.1919, which is a support-turned-resistance level.
Cryptocurrency metrics FAQs
The developer or creator of each cryptocurrency decides on the total number of tokens that can be minted or issued. Only a certain number of these assets can be minted by mining, staking or other mechanisms. This is defined by the algorithm of the underlying blockchain technology. On the other hand, circulating supply can also be decreased via actions such as burning tokens, or mistakenly sending assets to addresses of other incompatible blockchains.
Market capitalization is the result of multiplying the circulating supply of a certain asset by the asset’s current market value.
Trading volume refers to the total number of tokens for a specific asset that has been transacted or exchanged between buyers and sellers within set trading hours, for example, 24 hours. It is used to gauge market sentiment, this metric combines all volumes on centralized exchanges and decentralized exchanges. Increasing trading volume often denotes the demand for a certain asset as more people are buying and selling the cryptocurrency.
Funding rates are a concept designed to encourage traders to take positions and ensure perpetual contract prices match spot markets. It defines a mechanism by exchanges to ensure that future prices and index prices periodic payments regularly converge. When the funding rate is positive, the price of the perpetual contract is higher than the mark price. This means traders who are bullish and have opened long positions pay traders who are in short positions. On the other hand, a negative funding rate means perpetual prices are below the mark price, and hence traders with short positions pay traders who have opened long positions.

100만 명이 넘는 사용자가 FXStreet를 통해 실시간 시장 데이터, 차트 도구, 전문가 인사이트, 포렉스 뉴스를 이용합니다. 포괄적인 경제 캘린더와 교육 웨비나는 트레이더가 정보를 유지하고 신중한 결정을 내리도록 돕습니다. FXStreet는 바르셀로나 본사와 전 세계 지역에 걸쳐 약 60명의 팀으로 구성되어 있습니다.
더 읽기


