
Pi Network Price Forecast: PI recovers from slump as investors buy the dip
작성자 Vishal Dixit
게시일: 24 Feb 2026 | 수정일: 24 Feb 2026


인기 기사

Pi Network (PI) rebounds by 2% at press time on Tuesday, regaining strength after a three-day decline. A renewed interest among investors, evidenced by outflows from Centralized Exchanges (CEXs), backs the short-term recovery.
- Pi Network edges higher by 2% on Tuesday after three consecutive days of losses.
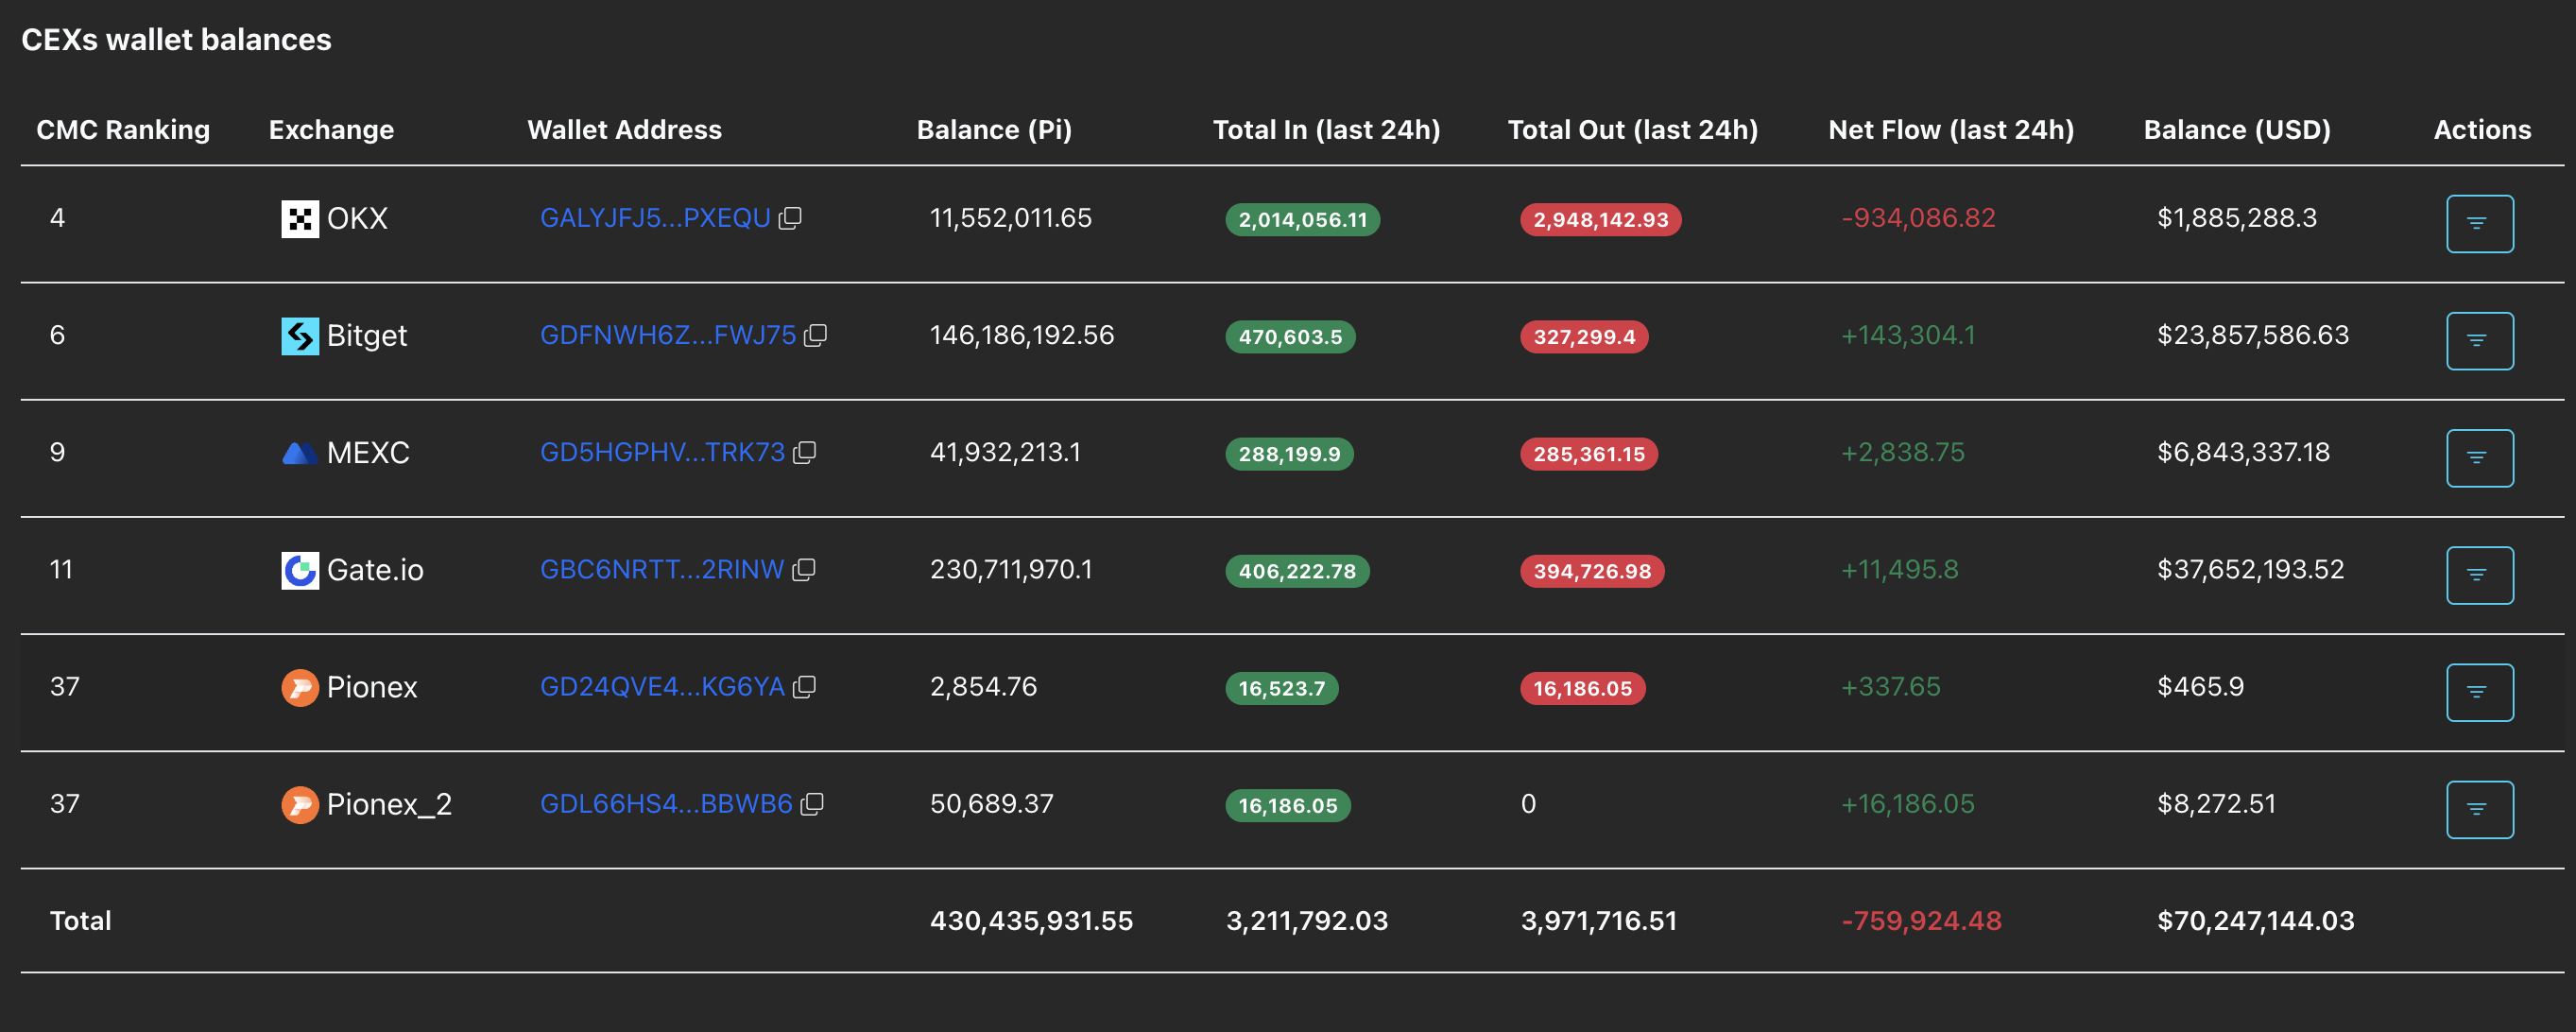
- Exchanges record an outflow of more than 750,000 PI tokens over the last 24 hours, suggesting that investors are buying the dip.
- The technical outlook for PI remains mixed, keeping the crucial support level at $0.1533 in focus.
Pi Network (PI) rebounds by 2% at press time on Tuesday, regaining strength after a three-day decline. A renewed interest among investors, evidenced by outflows from Centralized Exchanges (CEXs), backs the short-term recovery. Still, the technical outlook for the PI token remains mixed with bulls aiming for a positive daily close to confirm the reversal.
Investors return to buy the dip
PiScan data shows that the Know-Your-Business verified (KYB) exchanges recorded an outflow of 759,924 PI tokens over the last 24 hours. Typically, outflows from CEXs signal renewed investor demand. In the case of Pi Network, the outflow reflects investors capitalizing on the dip in anticipation of an extended rally.
Technical outlook: Will PI token extend its intraday rebound?
Pi Network held ground at the $0.1533 support level on Monday, with a daily close at $0.1599, retracing higher from its daily low of $0.1555. At the time of writing, PI is up 2% on Tuesday, with bulls aiming for the 50-day Exponential Moving Average (EMA) at $0.1754.
A decisive close above this moving average could extend the PI token recovery to the $0.1919 resistance level, marked by the October 11 low.
The technical indicators on the daily chart imply a loss in buying pressure. The Relative Strength Index (RSI) is at 36, maintaining a downward slope with further room before reaching the oversold zone. At the same time, the Moving Average Convergence Divergence (MACD) approaches its signal line, risking a potential bearish crossover as positive histograms contract.
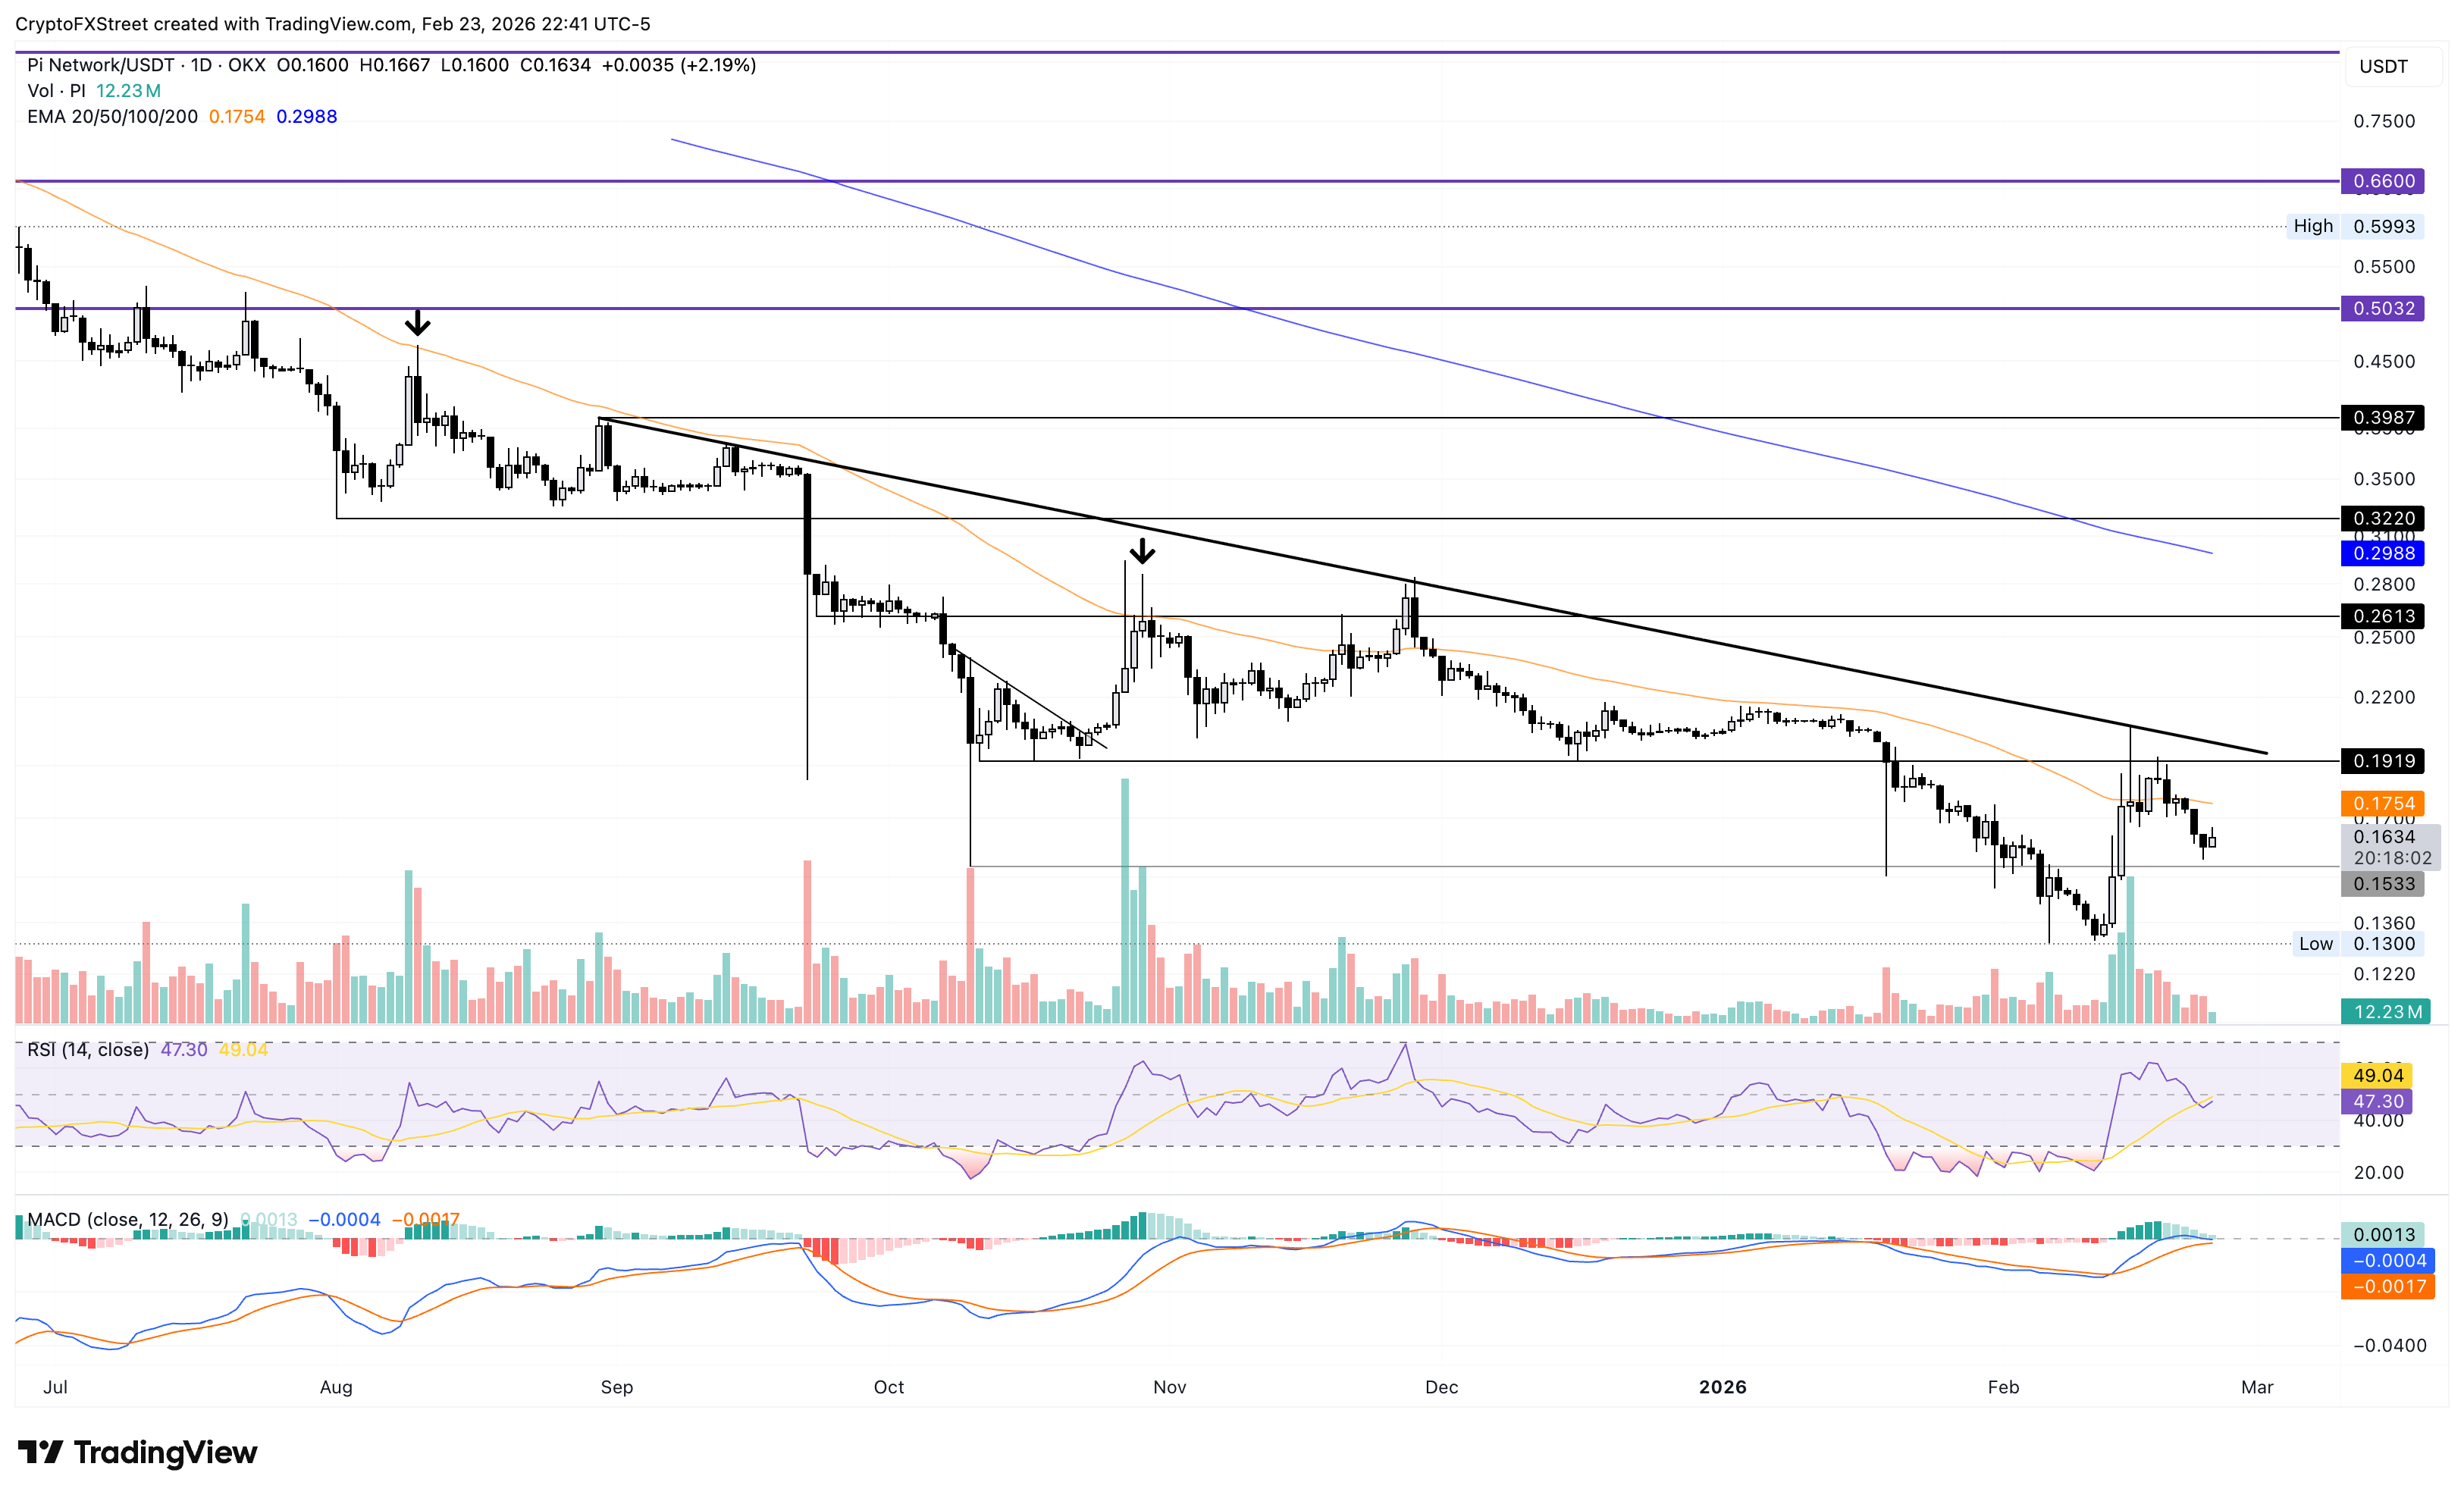
On the downside, if the PI token clears the $0.1533 support level with a daily close, it could threaten the $0.1300 record low from February 6.
Bitcoin, altcoins, stablecoins FAQs
Bitcoin is the largest cryptocurrency by market capitalization, a virtual currency designed to serve as money. This form of payment cannot be controlled by any one person, group, or entity, which eliminates the need for third-party participation during financial transactions.
Altcoins are any cryptocurrency apart from Bitcoin, but some also regard Ethereum as a non-altcoin because it is from these two cryptocurrencies that forking happens. If this is true, then Litecoin is the first altcoin, forked from the Bitcoin protocol and, therefore, an “improved” version of it.
Stablecoins are cryptocurrencies designed to have a stable price, with their value backed by a reserve of the asset it represents. To achieve this, the value of any one stablecoin is pegged to a commodity or financial instrument, such as the US Dollar (USD), with its supply regulated by an algorithm or demand. The main goal of stablecoins is to provide an on/off-ramp for investors willing to trade and invest in cryptocurrencies. Stablecoins also allow investors to store value since cryptocurrencies, in general, are subject to volatility.
Bitcoin dominance is the ratio of Bitcoin's market capitalization to the total market capitalization of all cryptocurrencies combined. It provides a clear picture of Bitcoin’s interest among investors. A high BTC dominance typically happens before and during a bull run, in which investors resort to investing in relatively stable and high market capitalization cryptocurrency like Bitcoin. A drop in BTC dominance usually means that investors are moving their capital and/or profits to altcoins in a quest for higher returns, which usually triggers an explosion of altcoin rallies.

100만 명이 넘는 사용자가 FXStreet를 통해 실시간 시장 데이터, 차트 도구, 전문가 인사이트, 포렉스 뉴스를 이용합니다. 포괄적인 경제 캘린더와 교육 웨비나는 트레이더가 정보를 유지하고 신중한 결정을 내리도록 돕습니다. FXStreet는 바르셀로나 본사와 전 세계 지역에 걸쳐 약 60명의 팀으로 구성되어 있습니다.
더 읽기


