
Pi Network Price Forecast: PI regains footing after Pi Day sell-off
작성자 Vishal Dixit
게시일: 16 Mar 2026 | 수정일: 16 Mar 2026


인기 기사

Pi Network (PI) edges higher above $0.2000 at press time on Monday, after a three-day correction of roughly 30%. The retail sentiment surrounding PI falters after Pi Day celebrations on Saturday amid intense profit-taking.
- Pi Network is up over 3% so far on Monday after three consecutive days of losses.
- Data shows a significant decline in Pi Network after Pi Day celebrations.
- The technical outlook for PI indicates intense downside pressure against the 50-day EMA at $0.1905.
Pi Network (PI) edges higher above $0.2000 at press time on Monday, after a three-day correction of roughly 30%. The retail sentiment surrounding PI falters after Pi Day celebrations on Saturday amid intense profit-taking. The technical outlook for PI is mildly bearish despite the intraday gains, with the 50-day Exponential Moving Average (EMA) at $19.05 now under threat.
Pi Network loses social interest
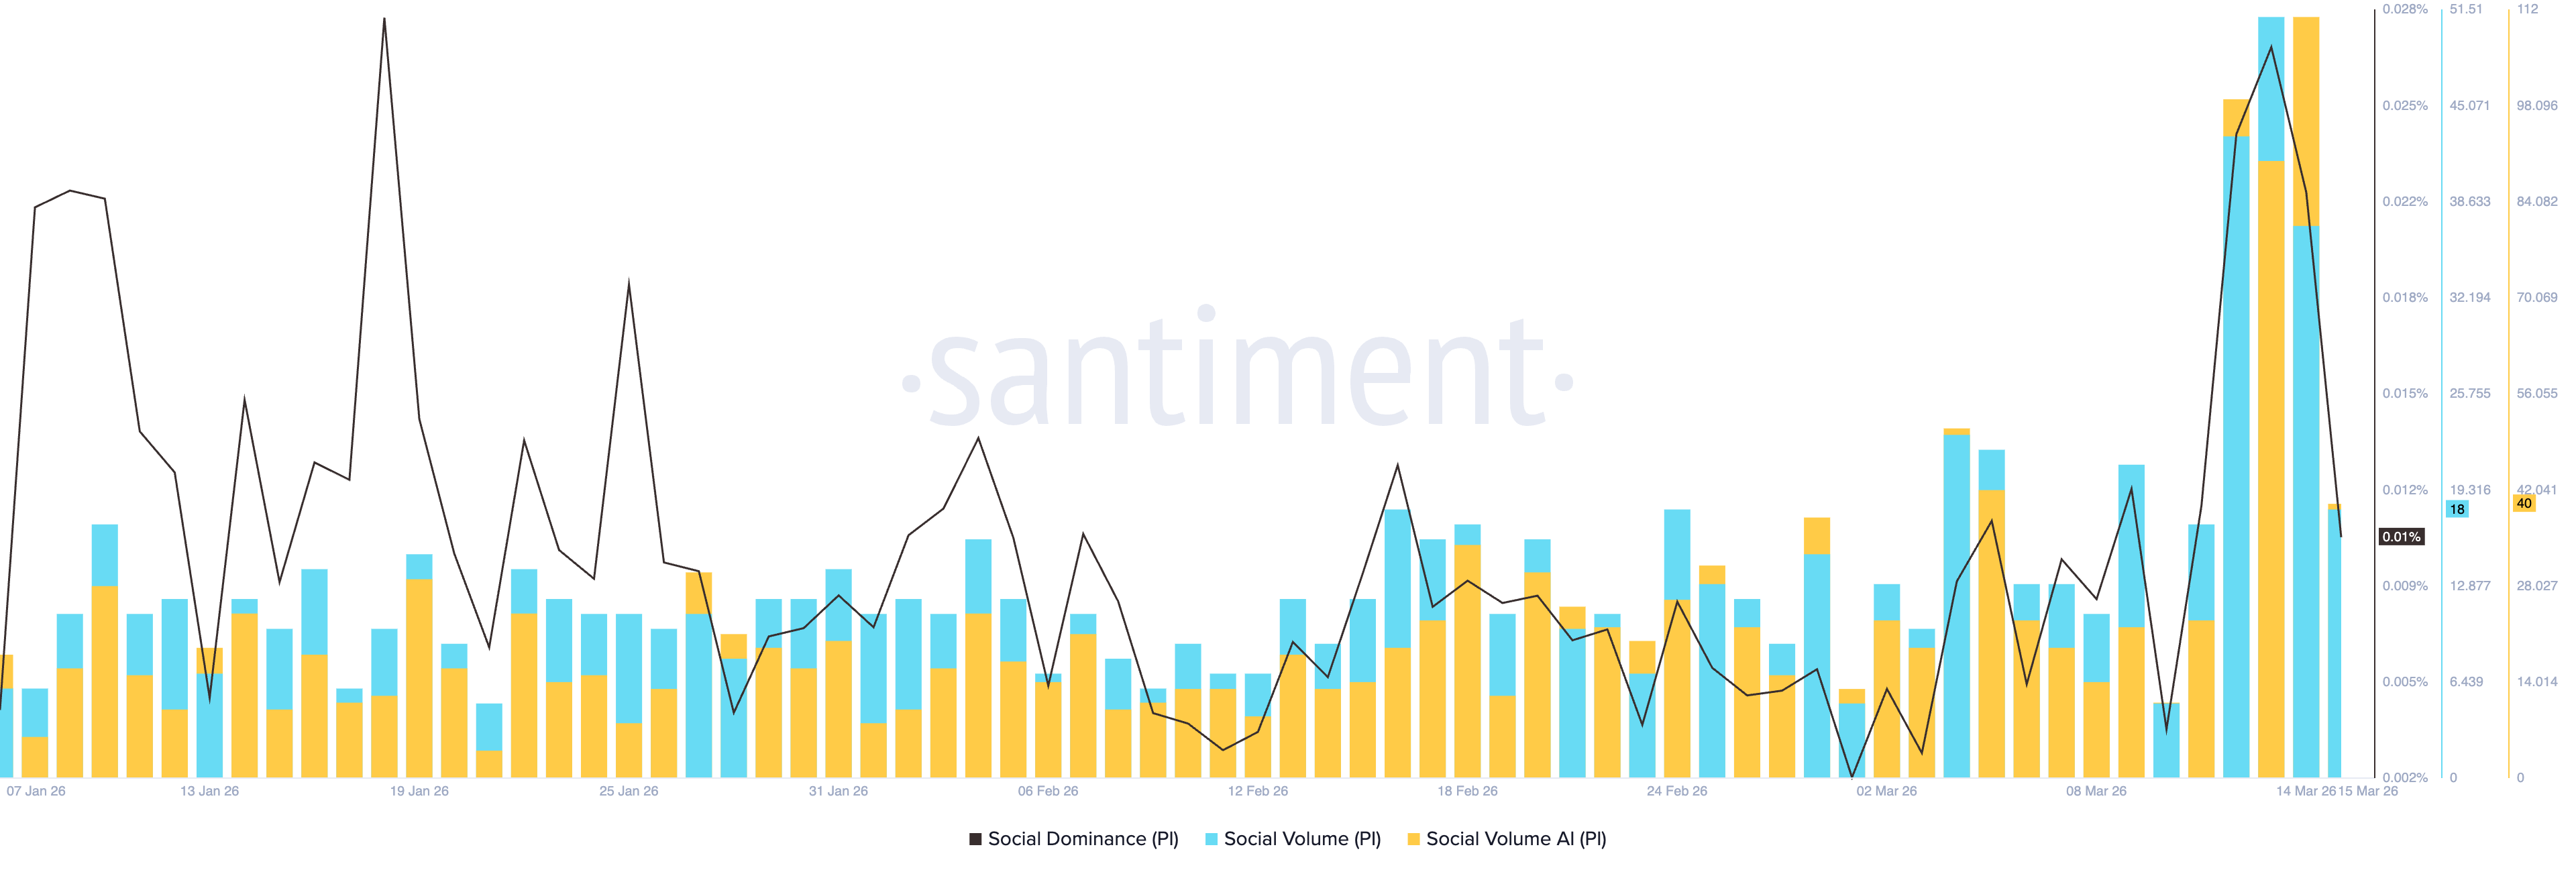
Pi Network is losing retail demand as the community’s interest wanes after the Kraken listing and Pi Day celebrations. Santiment data shows the social volume and dominance of PI dropped to 18 posts and 0.010% on Sunday from 37 and 0.021% on Saturday, respectively. Typically, Pi Network’s recovery phase aligns with a surge in social buzz, and a decline could signal a potential downside.
Technical outlook: Will Pi Network sustain gains above $0.20?
Pi Network rises over 3% at press time on Monday, extending Sunday's rebound from its 50-day EMA at $0.1905. This maintains a cautiously bullish near-term bias while PI retests the area around the broken descending resistance trendline at $0.1900. The 100-day EMA at $0.1999 remains just overhead and is flattening, serving as immediate resistance.
A breakout above this average could expand the rally to the $0.2360 peak from March 7, while the descending 200-day EMA at $0.2809 maintains a long-term bearish bias.
The Moving Average Convergence Divergence (MACD) line has slipped below its signal line, hinting at fading upside momentum, while the Relative Strength Index (RSI) at 51 drops to the midline from being overbought last week.
If PI slips below the 50-day EMA at $0.1905, it could risk a deeper pullback to the February 23 low at $0.1556.
(The technical analysis of this story was written with the help of an AI tool.)

100만 명이 넘는 사용자가 FXStreet를 통해 실시간 시장 데이터, 차트 도구, 전문가 인사이트, 포렉스 뉴스를 이용합니다. 포괄적인 경제 캘린더와 교육 웨비나는 트레이더가 정보를 유지하고 신중한 결정을 내리도록 돕습니다. FXStreet는 바르셀로나 본사와 전 세계 지역에 걸쳐 약 60명의 팀으로 구성되어 있습니다.
더 읽기


