
Pi Network Price Forecast: PI risks fresh record low as bears tighten their grip
작성자 Vishal Dixit
수정됨: 29 Jun 2026


인기 기사

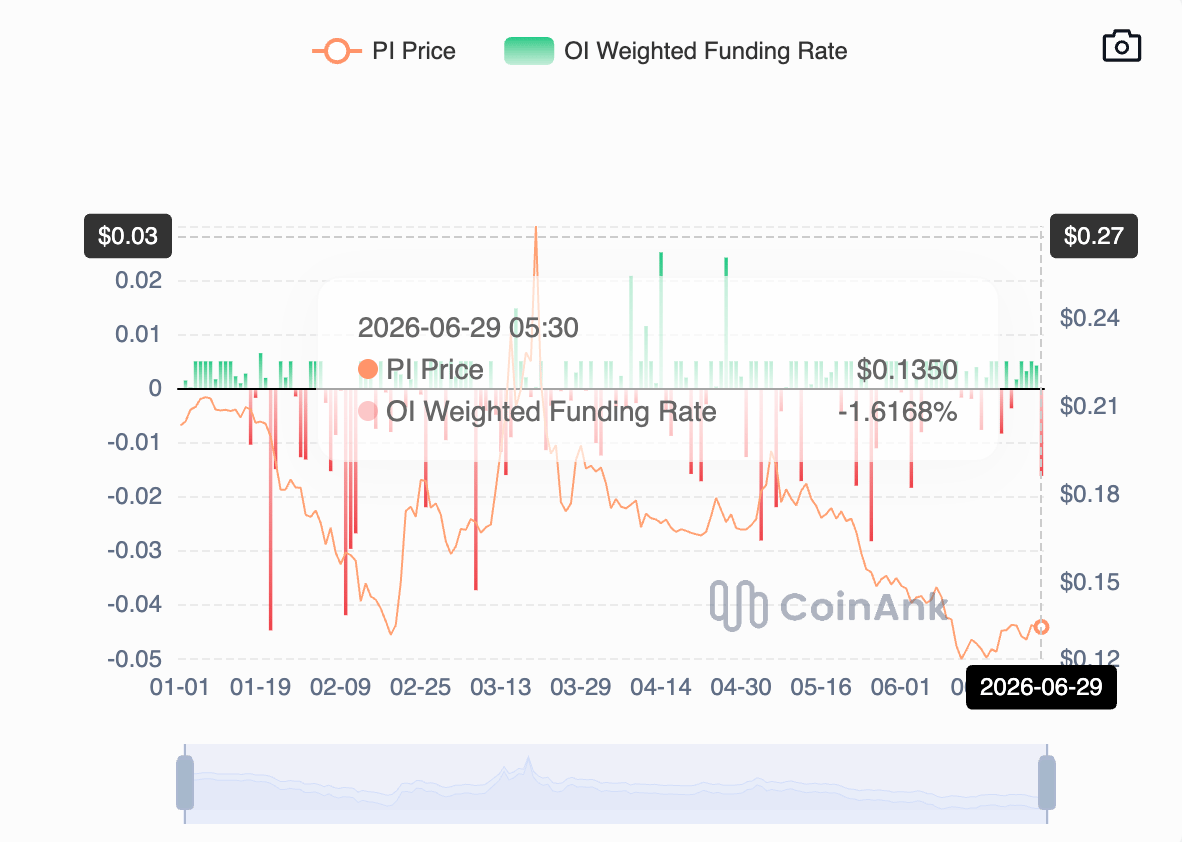
Pi Network (PI) price edges lower on Monday, threatening a steeper correction below the all-time low of $0.1184 recorded on June 6. The negative funding rate reaffirms the sell-side dominance as the Pi2Day excitement fades.
- Pi Network extends losses on Monday, risking a steeper decline to a new record low below $0.1184.
- A negative funding rate for the PI token indicates sell-side dominance among investors.
- The technical outlook for PI is bearish as MACD flashes a sell signal despite oversold RSI levels.
Pi Network (PI) price edges lower on Monday, threatening a steeper correction below the all-time low of $0.1184 recorded on June 6. The negative funding rate reaffirms the sell-side dominance as the Pi2Day excitement fades. From a technical perspective, PI continues its bearish spiral, with downside momentum gaining traction despite oversold warnings.
Sellers tighten grip despite Pi2Day announcements
Pi Network’s community celebrated Double Pi Day on Sunday (June 28), with the announcement of a local AI agent, SoloHost; the Pi Sign-In feature for users to access third-party websites and apps; and PiVerify for businesses to verify users using Pi KYC.
Despite the announcement of new features, investor sentiment remains bearish. CoinAnk data show that the PI funding rate of -1.6168% indicates that traders are willing to hold short positions at a premium, anticipating further weakness in the PI token.
Could PI avoid deeper losses?
Pi Network trades below $0.1250 at press time on Monday, extending its decline toward the broken descending trendline, near the June 6 low of $0.1184. From a technical perspective, PI retains a bearish near-term bias, as the 50- and 200-day Exponential Moving Averages (EMAs) at $0.1406 and $0.1882, respectively, sit comfortably above the price, suggesting a dominant downside trend.
That said, momentum backs this negative tone, with the Moving Average Convergence Divergence (MACD) indicator slipping fractionally below its signal line. Meanwhile, the Relative Strength Index (RSI) is hovering near 33, suggesting persistent selling pressure but not yet extreme oversold conditions.
A slip below the prior downward trendline around the June 6 low of $0.1184 would mark a new record low for PI. The downside discovery mode could target the $0.1000 psychological level.
On the topside, initial resistance emerges at the 50-day EMA at $0.1406, which caps the first meaningful recovery attempt. Meanwhile, the 200-day EMA at $0.1882 marks a more distant barrier, reinforcing the broader downtrend.
(The technical analysis of this story was written with the help of an AI tool.)

100만 명이 넘는 사용자가 FXStreet를 통해 실시간 시장 데이터, 차트 도구, 전문가 인사이트, 포렉스 뉴스를 이용합니다. 포괄적인 경제 캘린더와 교육 웨비나는 트레이더가 정보를 유지하고 신중한 결정을 내리도록 돕습니다. FXStreet는 바르셀로나 본사와 전 세계 지역에 걸쳐 약 60명의 팀으로 구성되어 있습니다.
더 읽기


