
Pi Network Price Forecast: PI risks further decline amid key support level breakdown
작성자 Vishal Dixit
수정됨: 3 Apr 2026


인기 기사

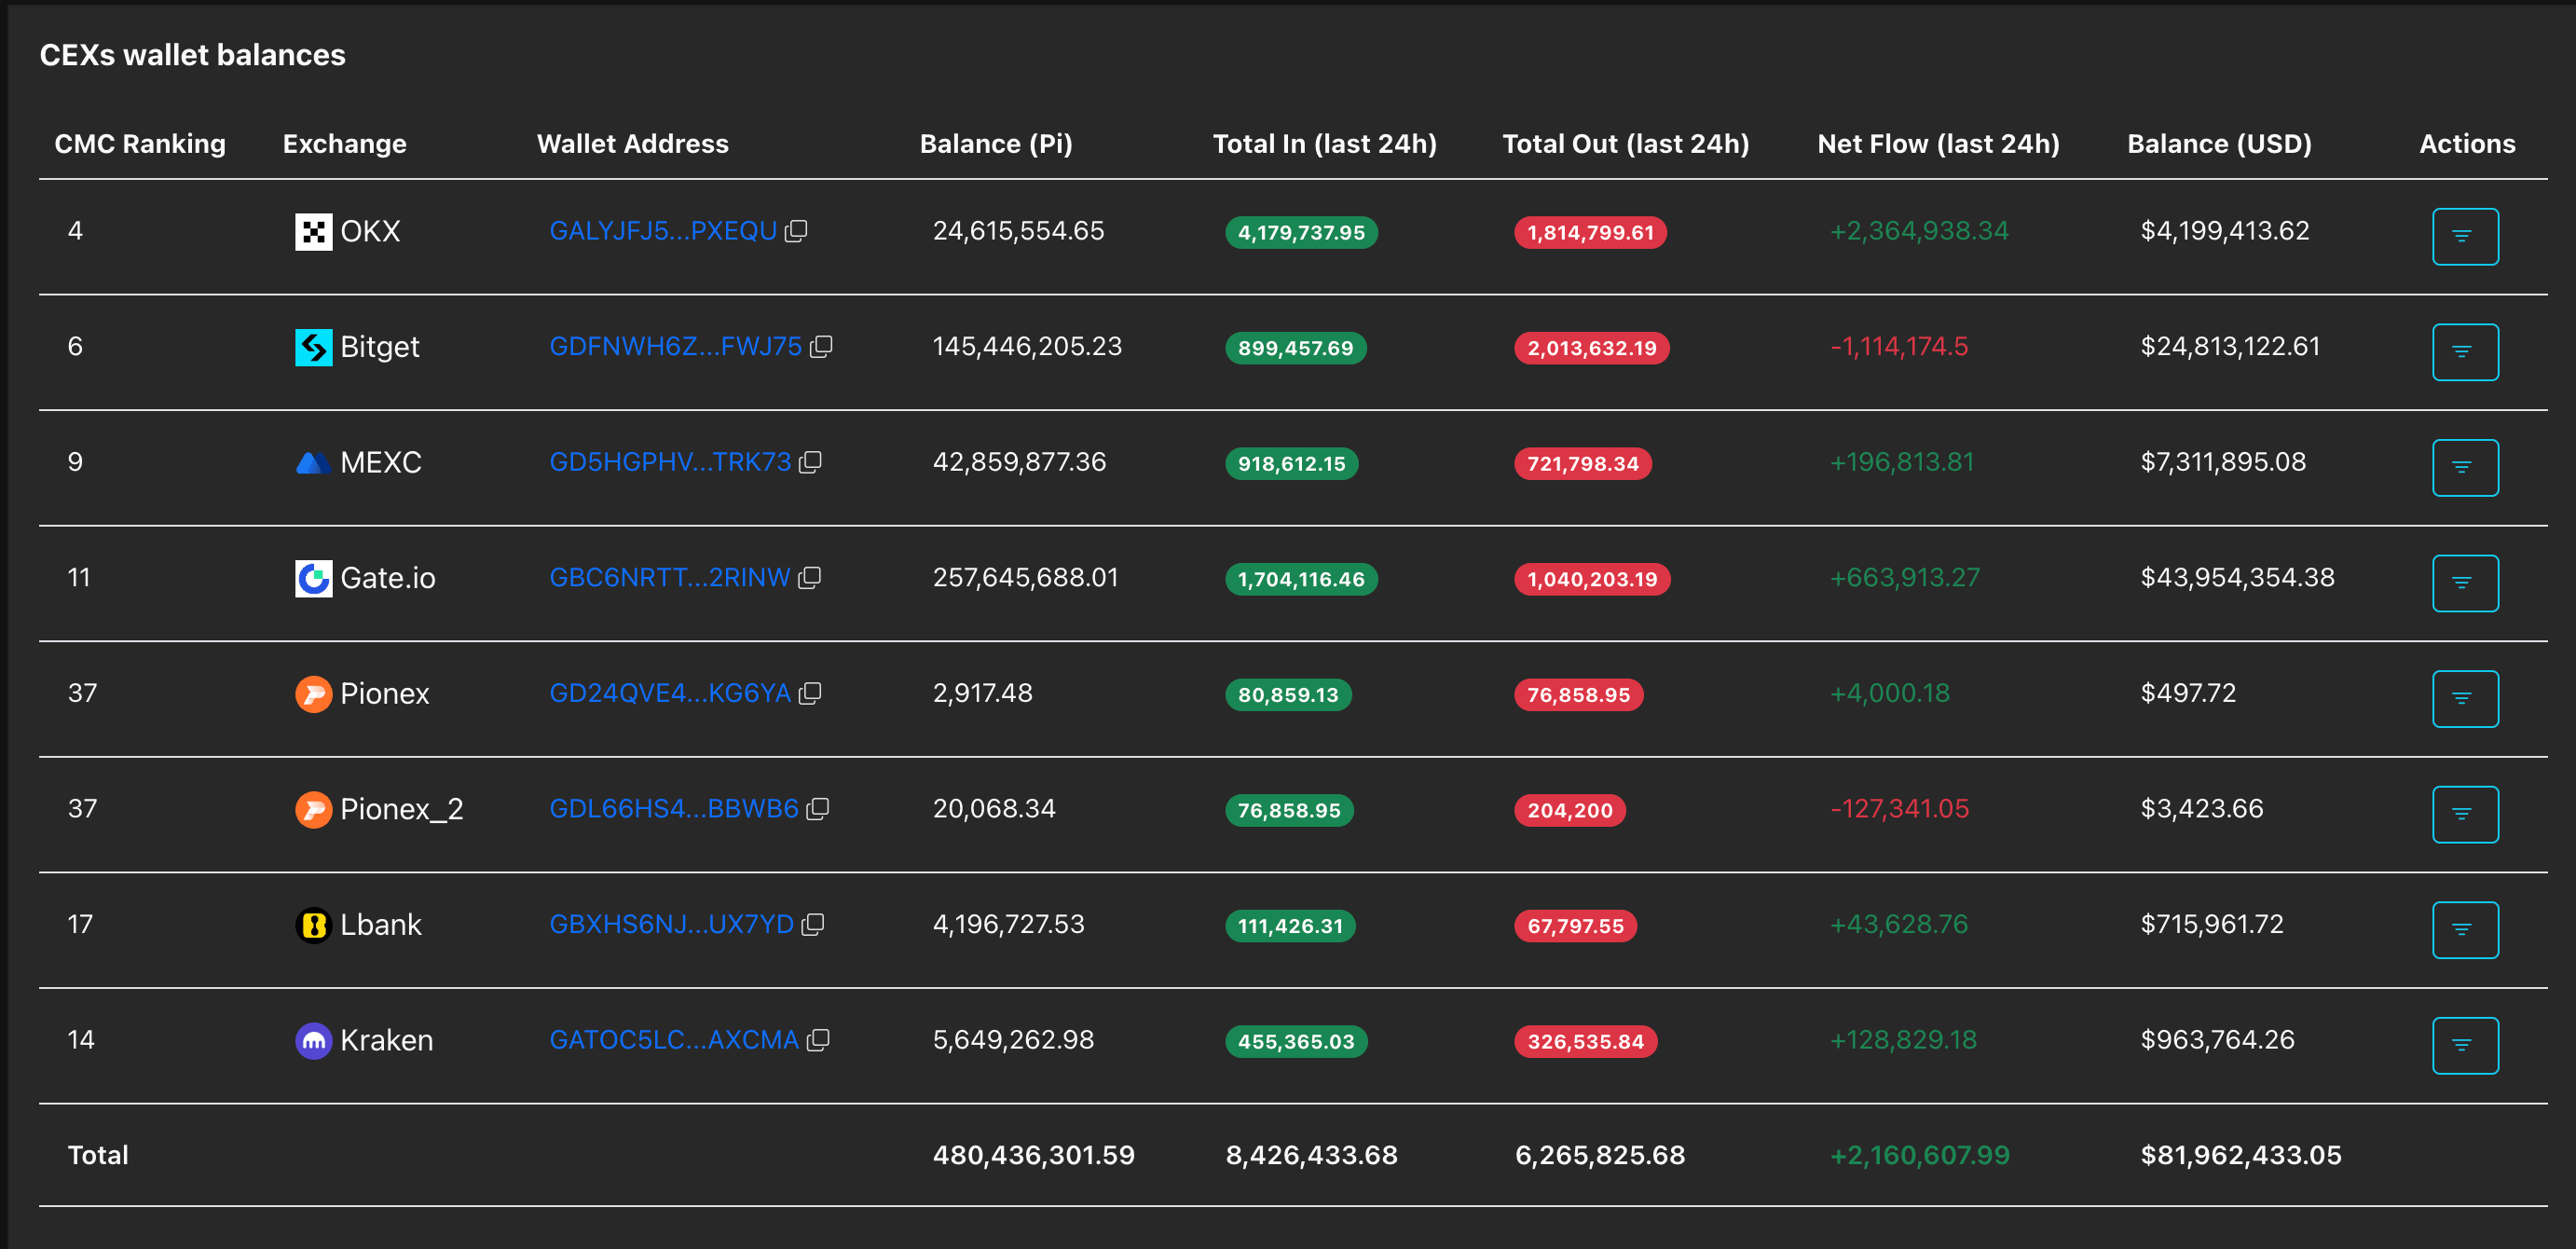
Pi Network (PI) is trading near $0.1700 at press time on Friday after losing over 5% the previous day. Deposits on Centralized Exchanges (CEXs) totaled over 2 million PI tokens in the last 24 hours, suggesting a profit-taking from investors amid the second rounds of mainnet migration.
- Pi Network clings to $0.1700 on Friday after a 5% loss the previous day.
- Over 2 million PI tokens were deposited on CEXs in the last 24 hours amid the second migration phase, weighing down on Pi Network price.
- The PI token risks an extended decline to $0.1556 amid a bearish technical picture.
Pi Network (PI) is trading near $0.1700 at press time on Friday after losing over 5% the previous day. Deposits on Centralized Exchanges (CEXs) totaled over 2 million PI tokens in the last 24 hours, suggesting a profit-taking from investors amid the second rounds of mainnet migration. The technical outlook for the PI token is bearish following a daily close below the $0.1736 support level, with the next line of defense at $0.1556.
Softened investor confidence redirects mainnet migration to CEXs
Pi Network faces intense supply pressure as the second wave of mainnet migration increases inflows to CEXs. PiScan data shows that CEXs recorded 2.16 million PI tokens in inflows over the last 24 hours, which aligns with Thursday’s sell-off and resulted in a 5% drop in the spot market. The rise in deposits on CEXs as more Pi Network testnet migrants move to mainnet reflects a weakening of investors' confidence in the project, leading to immediate profit-booking.
Pi Network at risk of steeper correction
Pi Network shows a minor intraday recovery above $0.1700 at press time on Friday, following the 5% drop the previous day. The near-term bias stays mildly bearish as price holds below the declining 50-day, 100-day, and 200-day Exponential Moving Averages (EMAs), which now slope lower and weigh on intraday rebounds.
On the downside, Thursday's close below $0.1736 has exposed a clean path toward the February 23 low at $0.1556 as the next significant level. A sustained loss of $0.1556 would extend the prevailing downtrend toward the February 11 low at $0.1310.
The Moving Average Convergence Divergence (MACD) line sits marginally below its signal line on the daily chart with a slightly negative histogram, reinforcing a weak downside tone rather than impulsive selling. Meanwhile, the Relative Strength Index (RSI) near 42 stays below the midline and signals persistent yet moderate bearish momentum.
Initial resistance emerges at the 50-day EMA at $0.1851, close to the 100-day EMA at $0.1942, both maintaining a broader downtrend. A daily close above $0.1942 would extend a recovery toward the March 7 high at $0.2396.
(The technical analysis of this story was written with the help of an AI tool.)

100만 명이 넘는 사용자가 FXStreet를 통해 실시간 시장 데이터, 차트 도구, 전문가 인사이트, 포렉스 뉴스를 이용합니다. 포괄적인 경제 캘린더와 교육 웨비나는 트레이더가 정보를 유지하고 신중한 결정을 내리도록 돕습니다. FXStreet는 바르셀로나 본사와 전 세계 지역에 걸쳐 약 60명의 팀으로 구성되어 있습니다.
더 읽기


