
Pi Network Price Forecast: PI signals rebound chances amid new mainnet upgrade
작성자 Vishal Dixit
수정됨: 20 May 2026


인기 기사

Pi Network (PI) extends losses in a downward spiral below $0.1500 at press time on Wednesday, overlooking the major mainnet nodes upgrade to protocol version 23.
- Pi Network edges below $0.1500 on Wednesday, extending losses for the sixth straight day.
- Pi Core Team announces that major mainnet nodes have updated to protocol version 23.
- The technical outlook is mixed, as a positive RSI divergence suggests a rebound possibility.
Pi Network (PI) extends losses in a downward spiral below $0.1500 at press time on Wednesday, overlooking the major mainnet nodes upgrade to protocol version 23. Technically, PI shows a rebound possibility from the previous day’s low at $0.1463 as the RSI indicator flashes a positive divergence on a shorter timeframe.
Major mainnet nodes push forward
Pi Core Team announced on Wednesday that major mainnet nodes have upgraded to Stellar protocol version 23, as the underlying infrastructure is the Stellar blockchain. The upgrade includes an operating system update from Ubuntu 20 to 24 and a database engine update from PostgreSQL 12 to 16.

Will Pi Network bounce back?
Pi Network hovers around $0.1475 at press time on Wednesday, holding a bearish bias as price holds below the 50-period Exponential Moving Average (EMA) at roughly $0.1605 and the 200-period EMA near $0.1709.
At the same time, the Relative Strength Index (RSI) near 29 signals an overextended downside and a positive divergence as price approaches the previous day's low at $0.1463. Typically, such positive divergences lead to an upside reversal, which could target a declining trendline around $0.1519.
Meanwhile, the flat Moving Average Convergence Divergence (MACD) below the zero line hints at weak downside momentum but no clear recovery signal yet.
On the topside, a daily close above $0.1519 could extend a breakout rally toward the 50-EMA at $0.1605, with the 200-EMA at $0.1709.
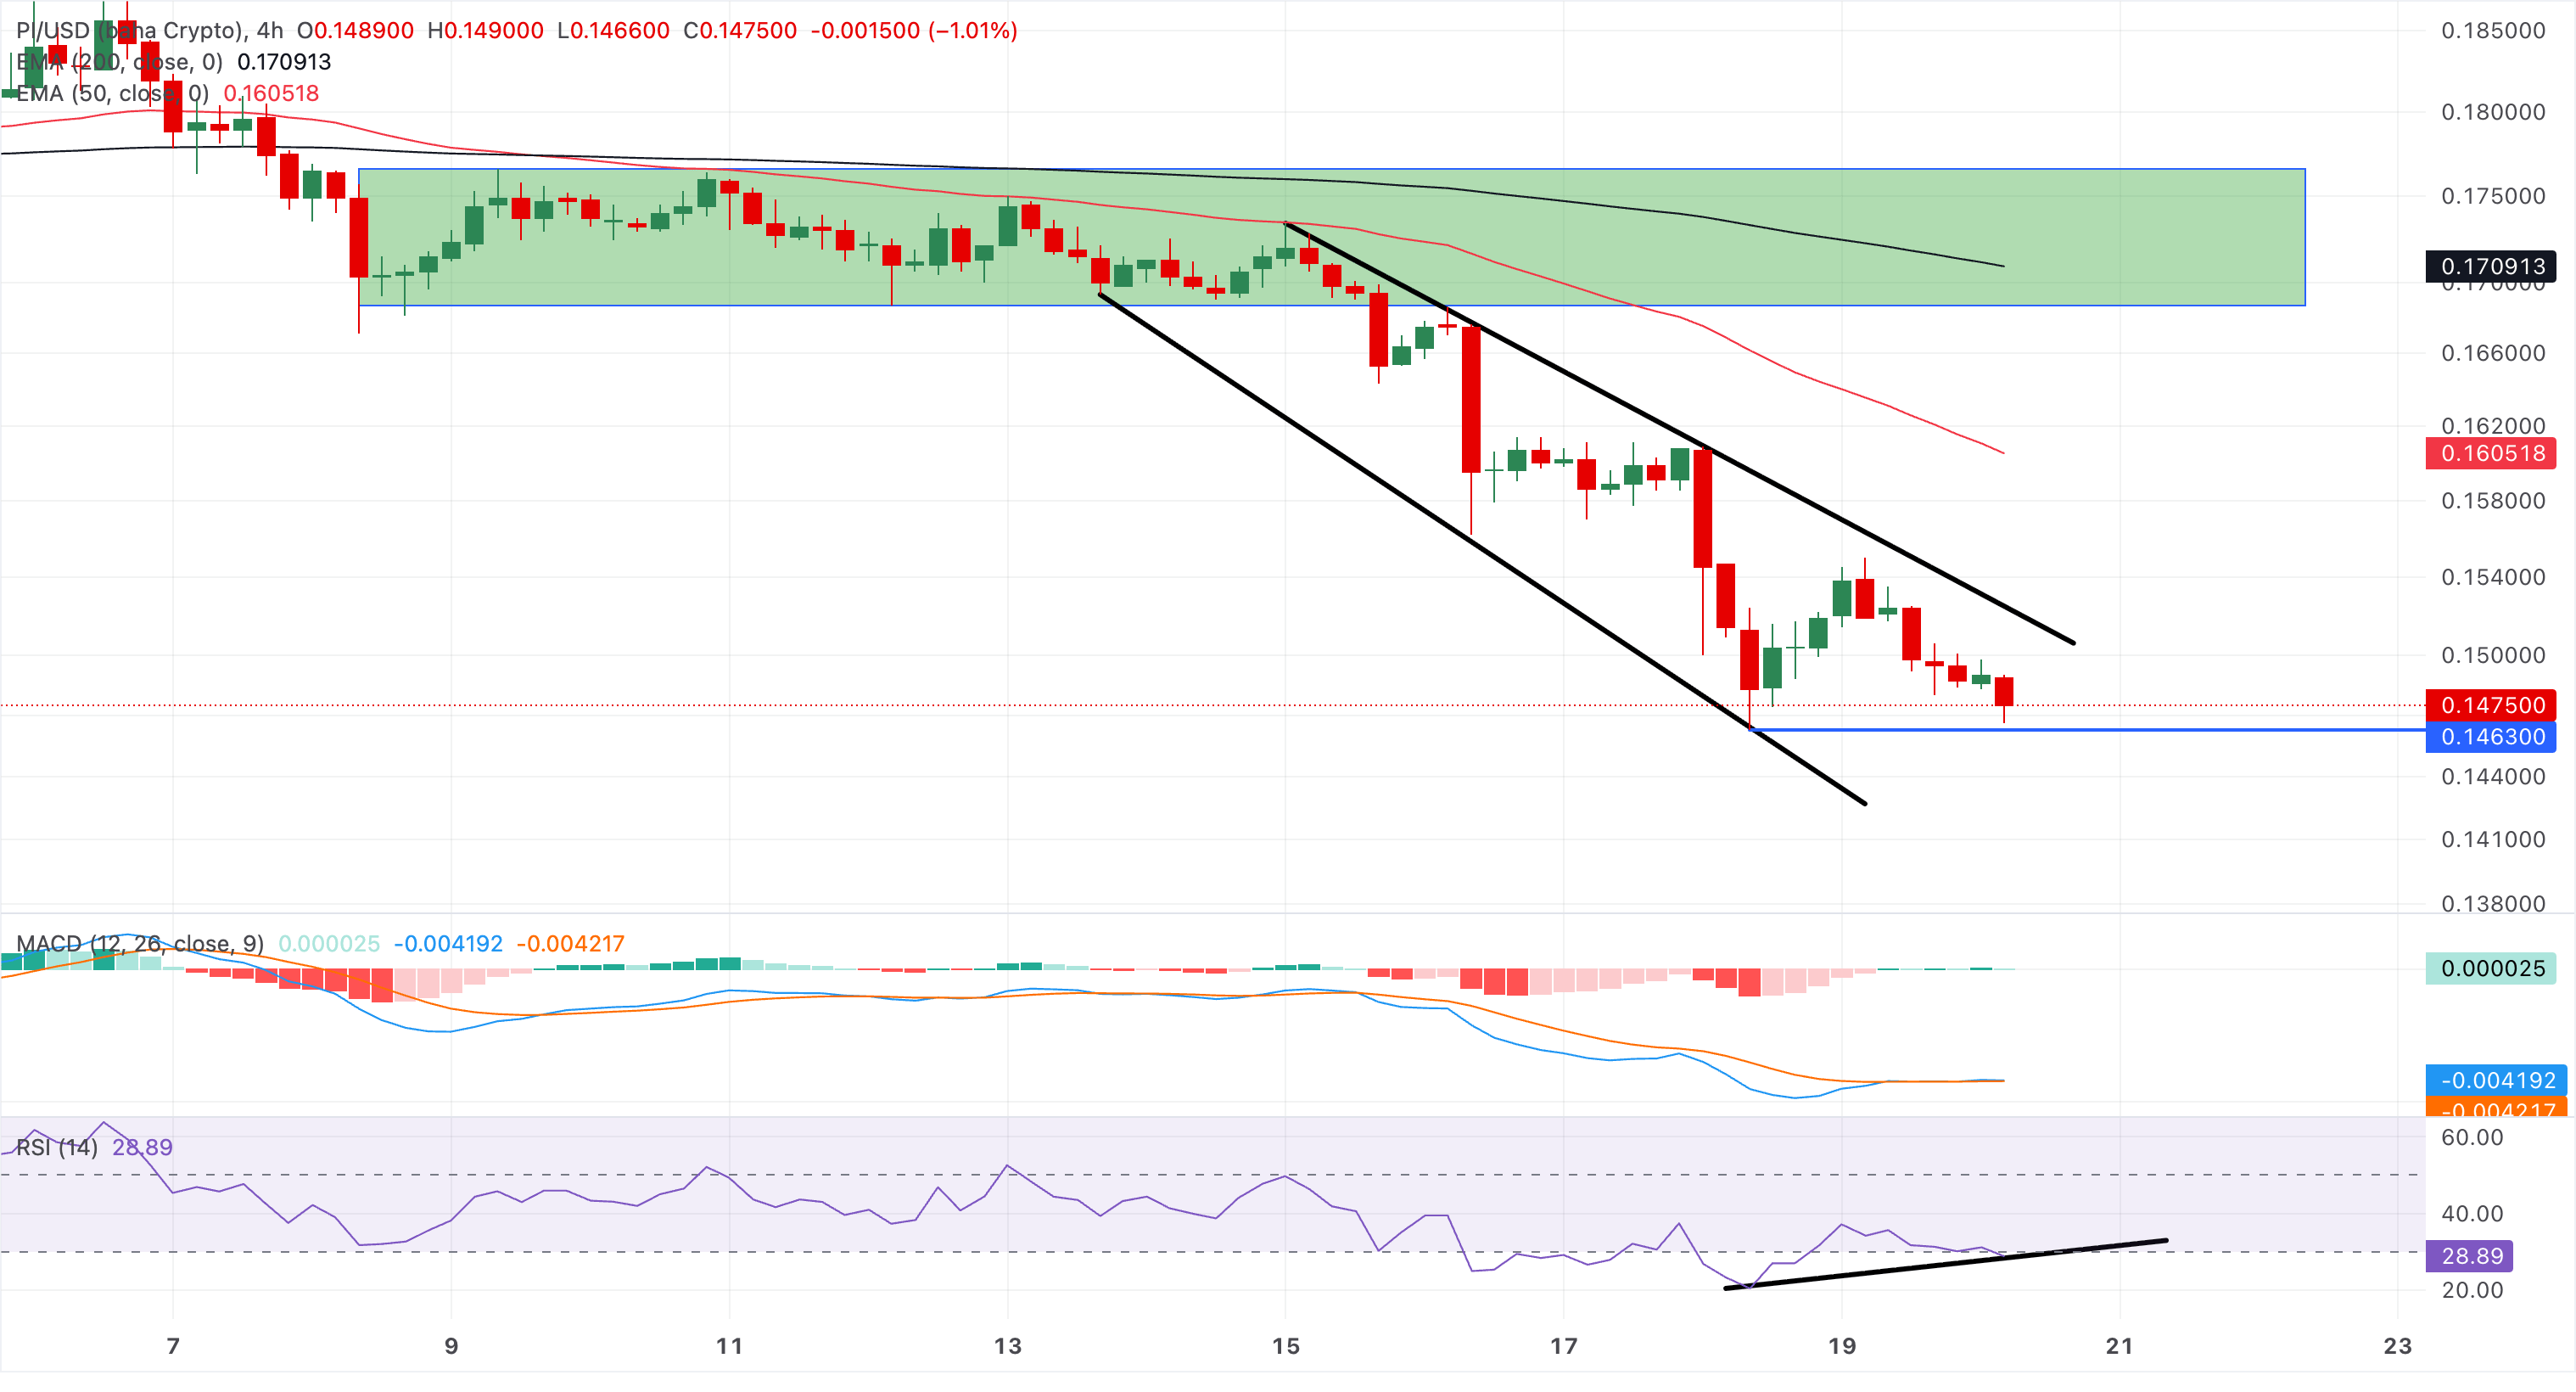
On the downside, Tuesday's low at $0.1463 serves as a key support level, and a daily close below it would nullify rebound chances.
(The technical analysis of this story was written with the help of an AI tool.)

100만 명이 넘는 사용자가 FXStreet를 통해 실시간 시장 데이터, 차트 도구, 전문가 인사이트, 포렉스 뉴스를 이용합니다. 포괄적인 경제 캘린더와 교육 웨비나는 트레이더가 정보를 유지하고 신중한 결정을 내리도록 돕습니다. FXStreet는 바르셀로나 본사와 전 세계 지역에 걸쳐 약 60명의 팀으로 구성되어 있습니다.
더 읽기


