
Pi Network Price Forecast: PI stabilizes on reduced selling pressure amid mainnet upgrades
작성자 Vishal Dixit
수정됨: 4 May 2026


인기 기사

Pi Network (PI) hovers above $0.1700 at press time on Monday, holding ground near its 50-day Exponential Moving average (EMA) at $0.1782 after a two-day decline.
- Pi Network holds above $0.1700 on Monday, testing its 50-day EMA at $0.1782.
- Data shows inflows into exchanges decreased, suggesting reduced selling pressure.
- The Pi Core Team has set a May 15 deadline for the mainnet upgrade to protocol 23, advancing toward smart contract functionality.
Pi Network (PI) hovers above $0.1700 at press time on Monday, holding ground near its 50-day Exponential Moving average (EMA) at $0.1782 after a two-day decline. A drop in deposit rate on Centralized Exchanges (CEXs), together with the ongoing push for mainnet upgrades, positions PI token for a potential rebound.
Deposits cool down amid the Core Team’s push for protocol 23 upgrade
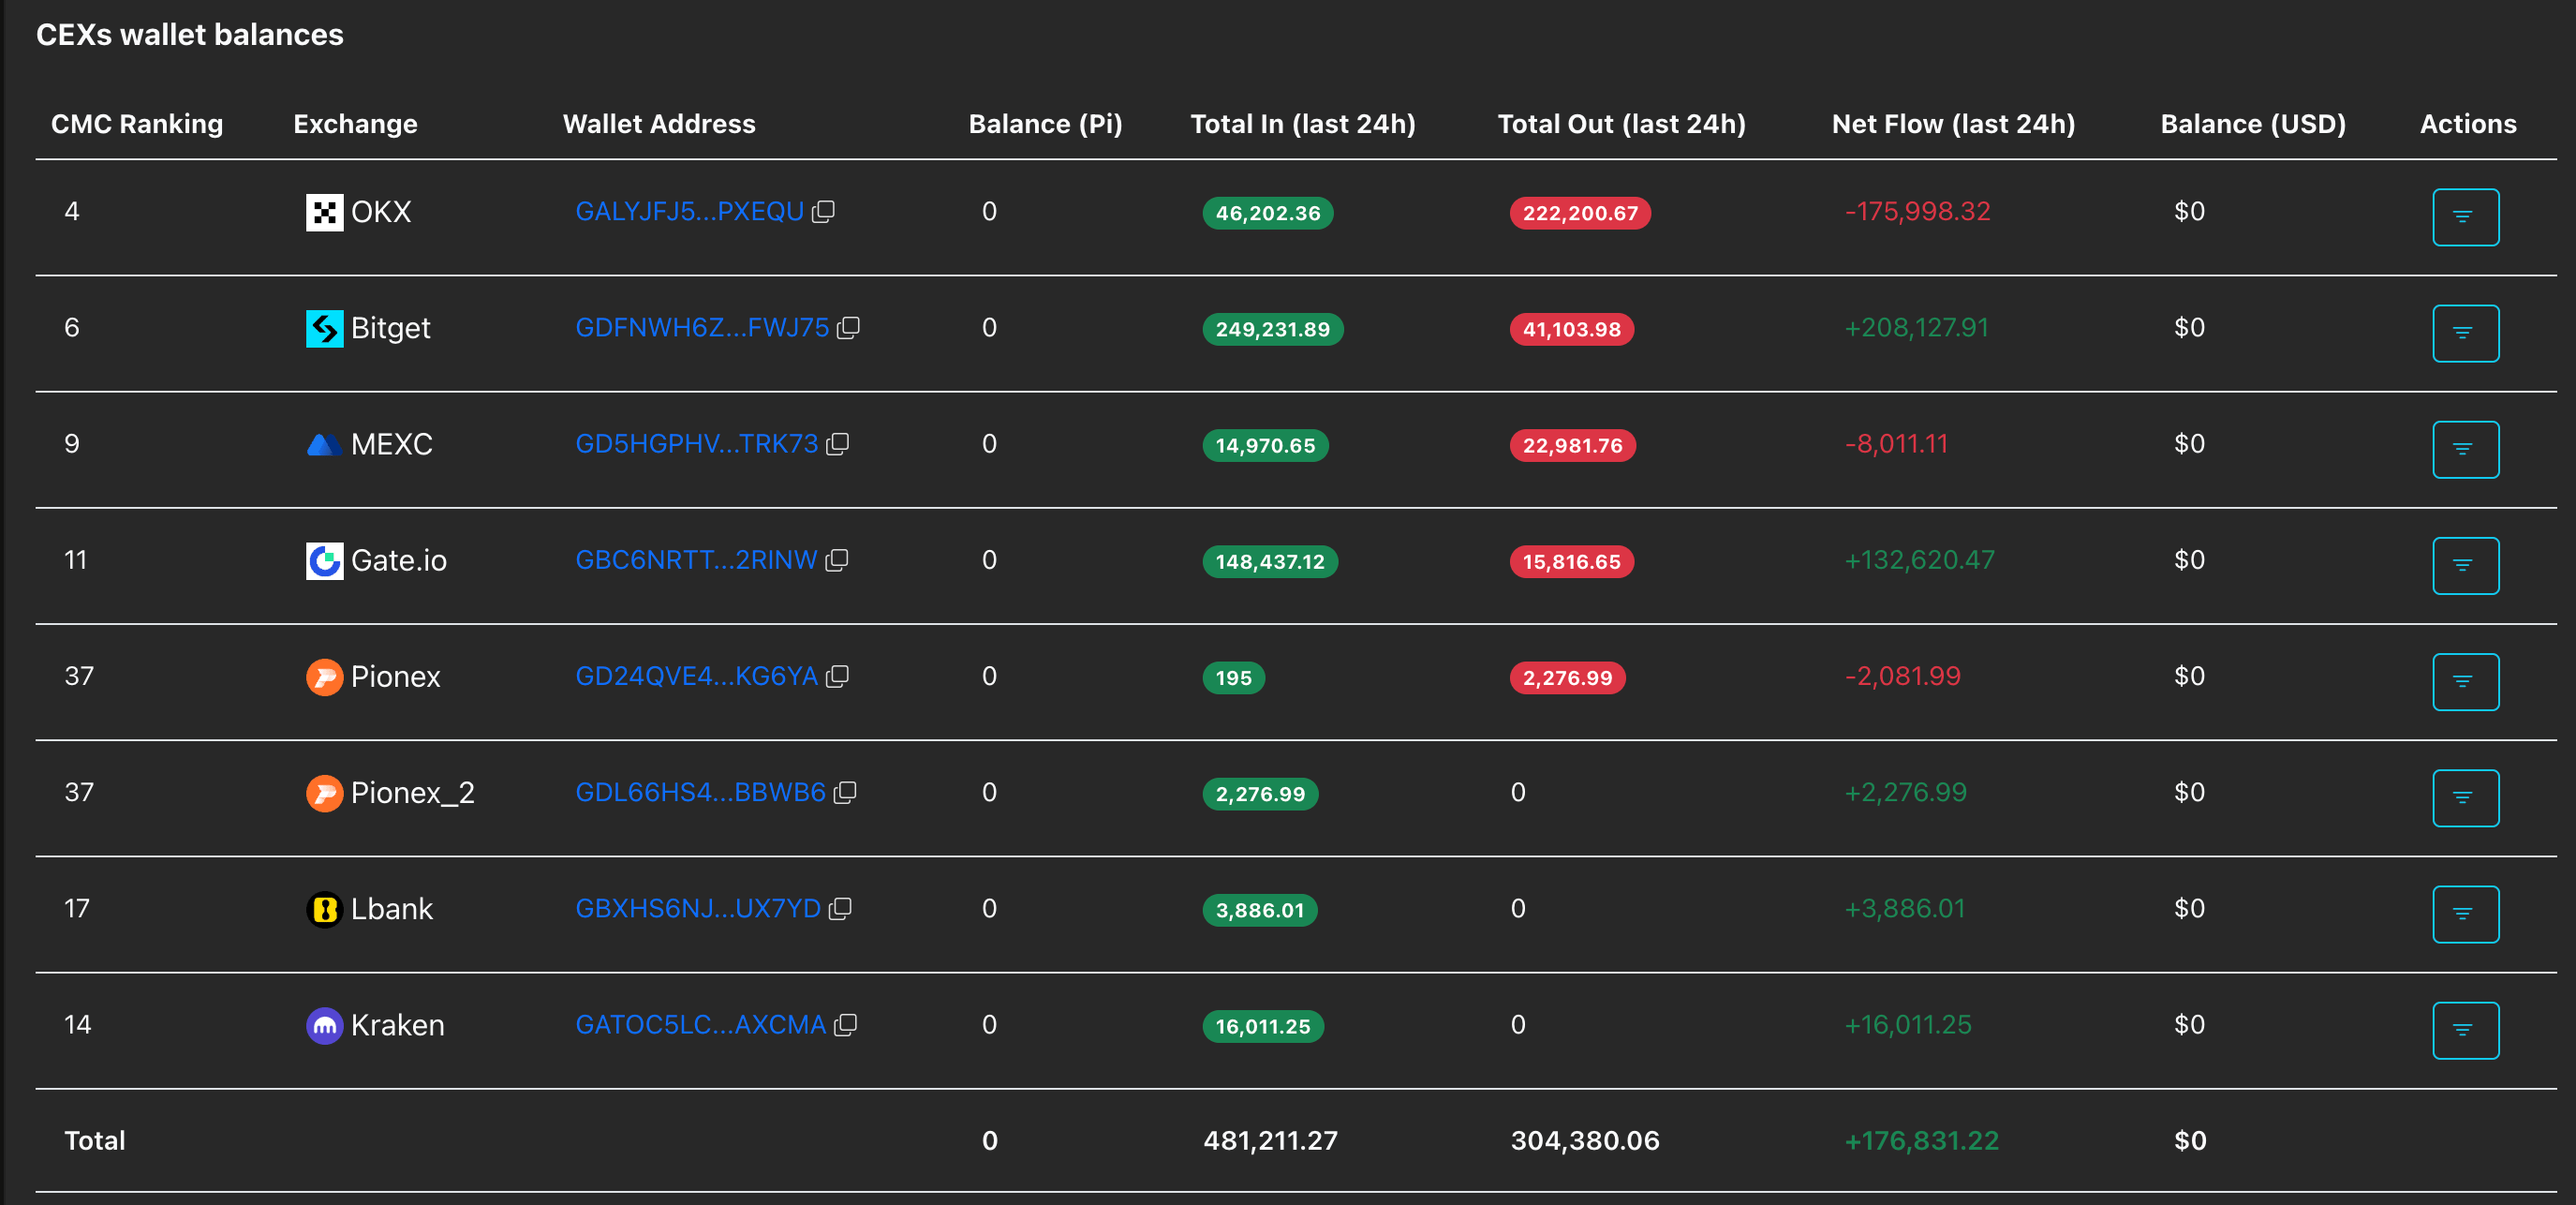
Pi Network faces persistent downside pressure, underpinned by the supply unlock migrating to the mainnet, which enables users to deposit their PI token holdings on CEXs. PiScan data reveals that 176,831 PI tokens were deposited over the last 24 hours, down from the 5 million PI token deposits reported on Friday, limiting the available supply on exchanges and reducing downside pressure.
On the other hand, the Pi Core Team is advancing the mainnet upgrade to protocol 23, with a deadline of May 15, after completing the protocol 22 upgrade on Friday. The team aims to reach protocol version 26 before June 28, to bring smart contract functionality on the mainnet, which could unlock real-world utility for the PI token.
Is Pi Network gearing up for a rebound?
Pi Network remains broadly capped in the near term by the 50-day EMA at $0.1782, while the much higher 200-day EMA at $0.2302 reinforces the prevailing medium-term bearish structure.
Momentum signals are mixed on the daily chart, with the Moving Average Convergence Divergence (MACD) in slightly positive territory but at risk of a crossover below the signal line. At the same time, the Relative Strength Index (RSI) is hovering around the neutral 50 level, suggesting a lack of decisive directional conviction despite modest underlying bid tones.
On the topside, immediate resistance is defined by the 50-day EMA at $0.1782, and a daily close above this pivot would be needed to ease near-term downside pressure. Beyond that, the March 21 high at $0.2041 and the 200-day EMA at $0.2302 stand as more substantial barriers.
On the downside, the crucial support for PI remains at the April 13 low at $0.1633, followed by the February 23 low at $0.1556.
(The technical analysis of this story was written with the help of an AI tool.)

100만 명이 넘는 사용자가 FXStreet를 통해 실시간 시장 데이터, 차트 도구, 전문가 인사이트, 포렉스 뉴스를 이용합니다. 포괄적인 경제 캘린더와 교육 웨비나는 트레이더가 정보를 유지하고 신중한 결정을 내리도록 돕습니다. FXStreet는 바르셀로나 본사와 전 세계 지역에 걸쳐 약 60명의 팀으로 구성되어 있습니다.
더 읽기


