
Polkadot Price Forecast: DOT eyes breakout as ETF records first inflow
작성자 Manish Chhetri
게시일: 13 Mar 2026 | 수정일: 13 Mar 2026


인기 기사

Polkadot (DOT) is trading at $1.52 at the time of writing on Friday, nearing a key resistance zone, where a breakout could trigger a rally. Fresh institutional interest is emerging following the first recorded inflow into the 21Shares spot DOT Exchange Traded Funds (ETFs).
- Polkadot price faces rejection near the 50-day EMA at $1.56 on Friday, a decisive breakout above this level could trigger an upside move.
- The first DOT ETF launched by 21Shares recorded its first positive inflow of $544,480 on Thursday, signaling early institutional interest.
- Derivatives data support improving sentiment, with rising Open Interest, positive funding rates and increasing bullish positioning among traders.
Polkadot (DOT) is trading at $1.52 at the time of writing on Friday, nearing a key resistance zone, where a breakout could trigger a rally. Fresh institutional interest is emerging following the first recorded inflow into the 21Shares spot DOT Exchange Traded Funds (ETFs). In addition, improving derivatives metrics supports a bullish sentiment, hinting at a potential breakout in the upcoming days.
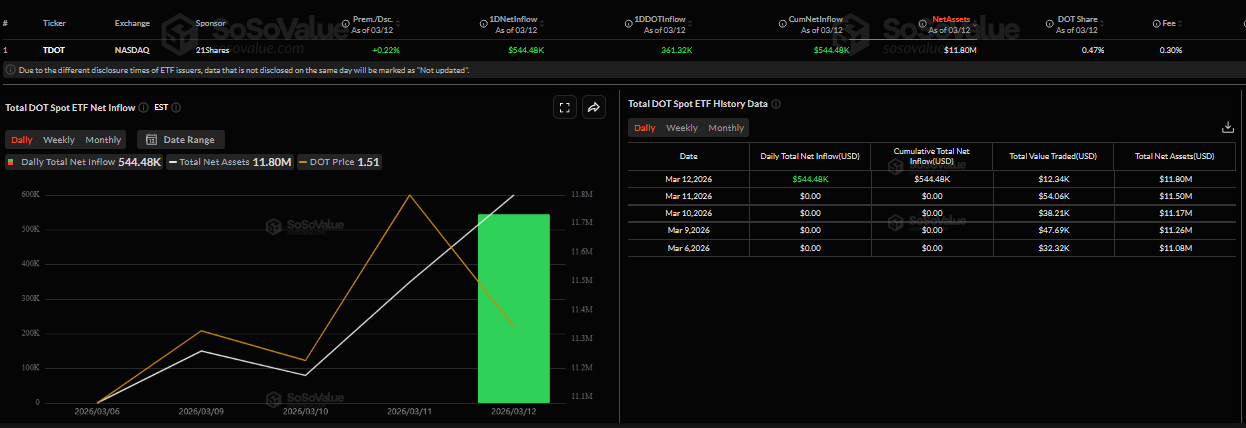
TDOT records first ETF inflow
Crypto asset manager 21Shares recently launched the first spot Polkadot ETF in the US on March 6. The product, listed on the Nasdaq under the ticker TDOT, offers investors regulated exposure to the DOT token and was seeded with approximately $11 million in initial assets.
According to SoSoValue data, the spot DOT ETF recorded its first positive inflow of $544,480 on Thursday, signaling early institutional interest. If these continue and intensify, DOT could see a price rally in the upcoming days.
Derivatives data show bullish sentiment
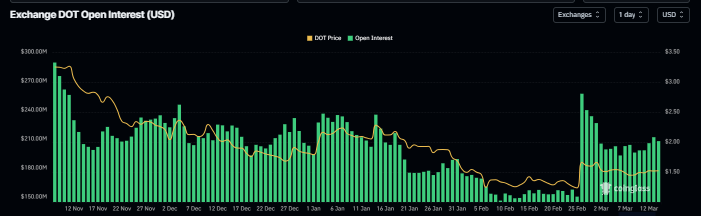
On the derivatives side, CoinGlass’ data show that the futures’ Open Interest (OI) in Polkadot at exchanges surges to $256.76 million on February 26, the highest level since November 10, before easing and stabilizing around $207.60 million on Friday. Rising OI generally indicates fresh capital entering the market and increased buying activity, which could support the ongoing DOT price rally.
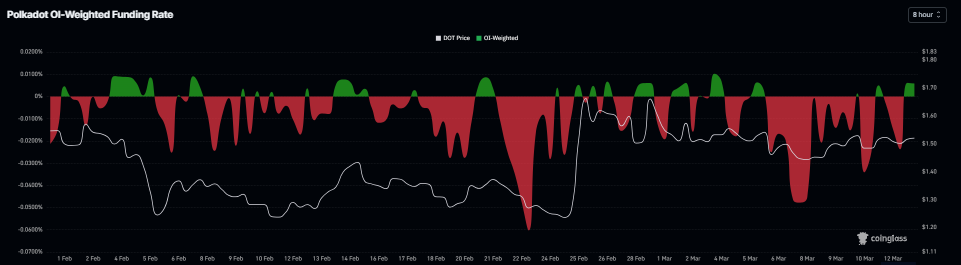
CoinGlass funding rates data also shows a positive outlook for Polkadot. The metric flipped to a positive rate on Thursday and reading 0.0058% on Friday, indicating longs are paying shorts and suggesting bullish sentiment toward DOT.
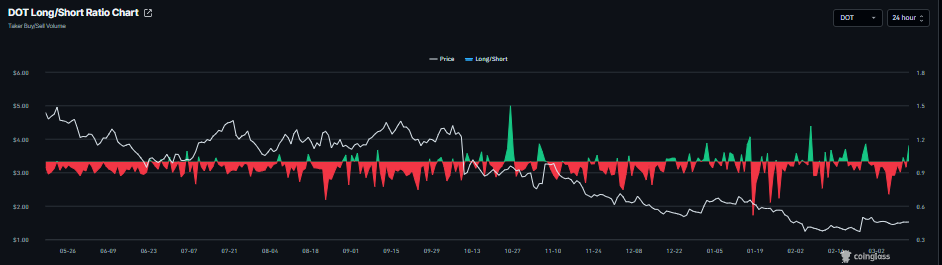
In addition, CoinGlass’s long-to-short ratio for DOT reads 1.14 on Friday. The ratio above one suggests that more traders are betting on Polkadot’s price to rally.
Polkadot Price Forecast: DOT faces resistance near 50-day EMA
Polkadot price is trading at $1.52 as of writing on Friday, up over 4% so far this week. The near-term bias is neutral with a mild bullish tilt as price holds above the $1.45 area after last week’s surge and consolidates below the $1.68 horizontal resistance. Daily closes remain well under the 50-day and 100-day Exponential Moving Averages (EMAs) clustered between $1.56 and $1.83, keeping the broader trend capped even as downside pressure has faded.
The Relative Strength Index (RSI) on the daily chart at 52 signals balanced momentum with a slight upside lean, while the Moving Average Convergence Divergence (MACD) indicator holds in positive territory with the MACD line just above the signal line, suggesting steady but not aggressive buying interest.
Immediate resistance is located at $1.56, the 50-day EMA, then at the $1.68 horizontal resistance. A break higher of the latter would open the way toward the 23.6% Fibonacci retracement of the broader decline from the September high of $4.88 to the October 10 low at $0.63, at $1.63, then the $2.25 region near the 38.2% retracement.
On the downside, initial support is seen at $1.45 recent lows, followed by the horizontal support at $1.23, which guards the low-$1.20s range and keeps price well above the $0.63 cycle trough.
A daily close below $1.23 would weaken the budding positive tone and expose a deeper pullback within the longer-term downtrend, while sustained trading above $1.52 would keep the focus on a potential test of $1.68.
-1773385128740-1773385128741.png)
(The technical analysis of this story was written with the help of an AI tool.)

100만 명이 넘는 사용자가 FXStreet를 통해 실시간 시장 데이터, 차트 도구, 전문가 인사이트, 포렉스 뉴스를 이용합니다. 포괄적인 경제 캘린더와 교육 웨비나는 트레이더가 정보를 유지하고 신중한 결정을 내리도록 돕습니다. FXStreet는 바르셀로나 본사와 전 세계 지역에 걸쳐 약 60명의 팀으로 구성되어 있습니다.
더 읽기


