
Pump.fun Price Forecast: PUMP sees bearish reversal despite buyback
작성자 Vishal Dixit
게시일: 23 Jan 2026 | 수정일: 23 Jan 2026


인기 기사

Pump.fun (PUMP) trades below $0.0025 at the time of writing on Friday, after a nearly 7% decline from the 50-day Exponential Moving Average (EMA) at $0.002601. The recent purchase of over $1 million in PUMP tokens failed to revive retail support, as PUMP futures continue to see capital outflow.
- PUMP reverses by nearly 7% from the 50-day EMA at $0.002601, dropping below $0.0025 on Friday.
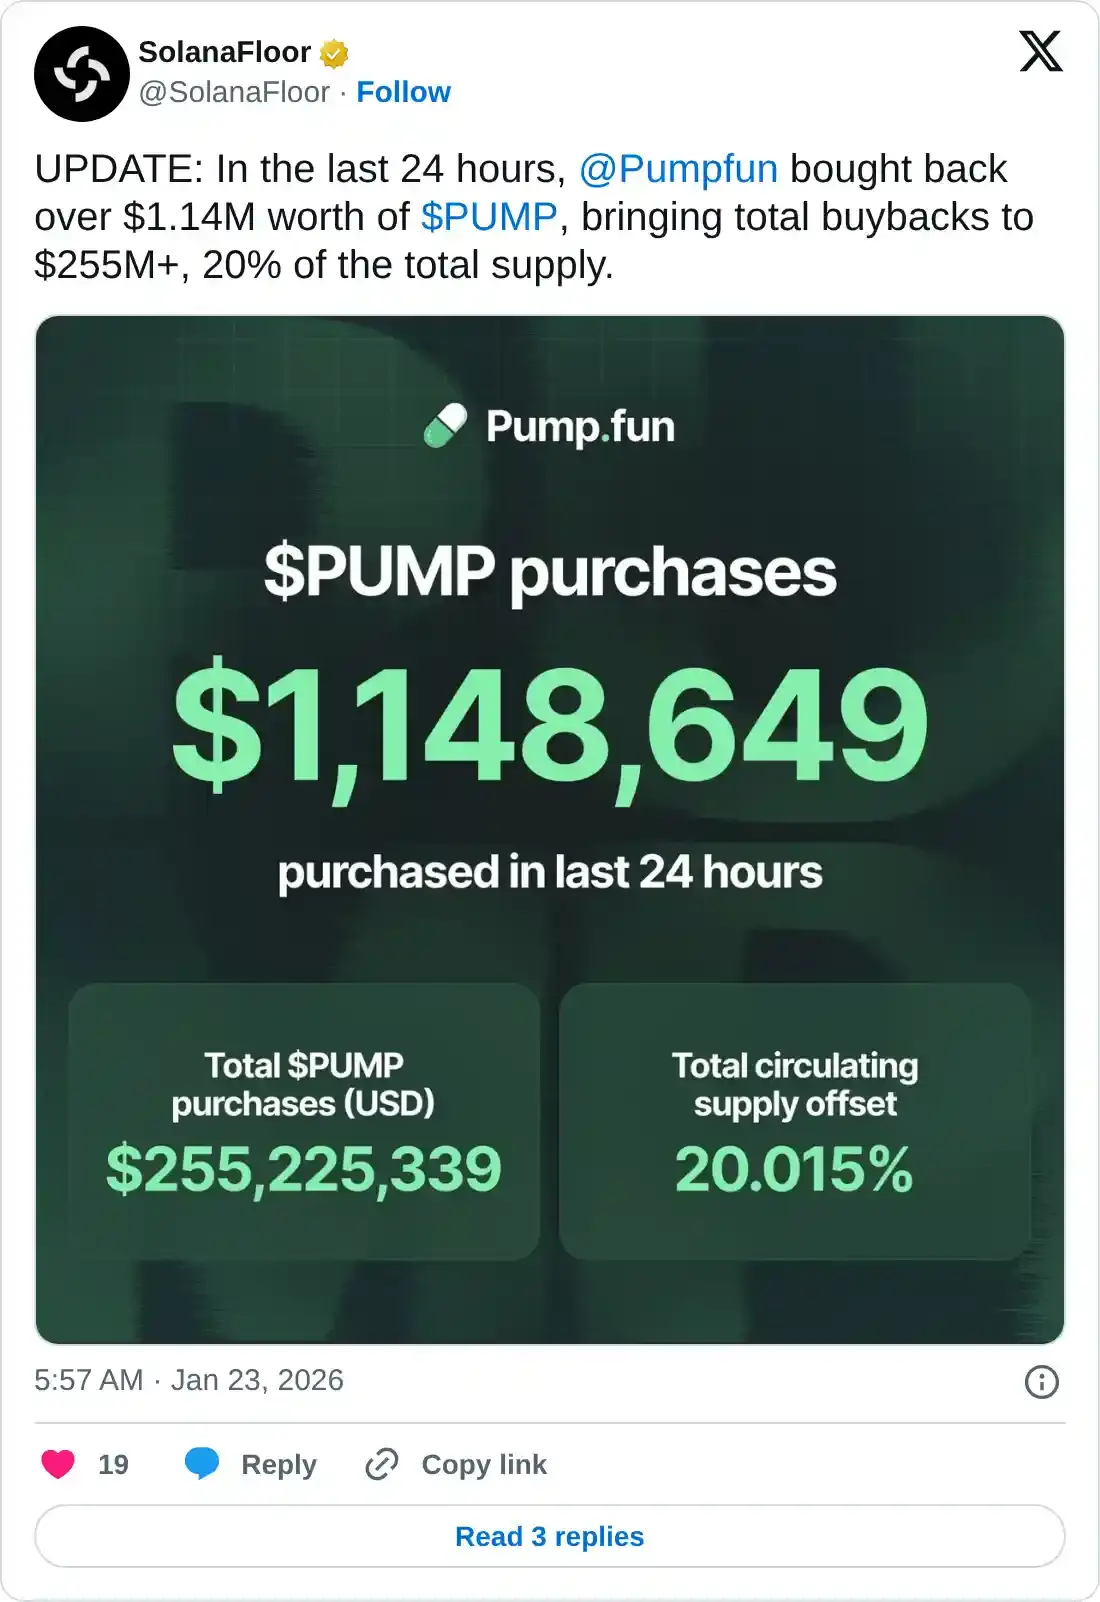
- Pump.fun repurchases over $1 million in PUMP, securing 20% of the total supply.
- The technical outlook is bearish, as the MACD indicator gives a sell signal.
Pump.fun (PUMP) trades below $0.0025 at the time of writing on Friday, after a nearly 7% decline from the 50-day Exponential Moving Average (EMA) at $0.002601. The recent purchase of over $1 million in PUMP tokens failed to revive retail support, as PUMP futures continue to see capital outflow. Technically, the PUMP token rests at a crucial crossroads as the previous bullish momentum fades.
Buybacks fail to offset declining demand for PUMP
Pump.fun has purchased $1.14 million worth of PUMP tokens over the last 24 hours, totaling $255.22 million or 20% of the total circulation. Typically, a reduction of such a margin in circulation leads to a demand bias, driving the prices higher. However, PUMP remains under selling pressure as the retail demand for the launchpad token weakens.
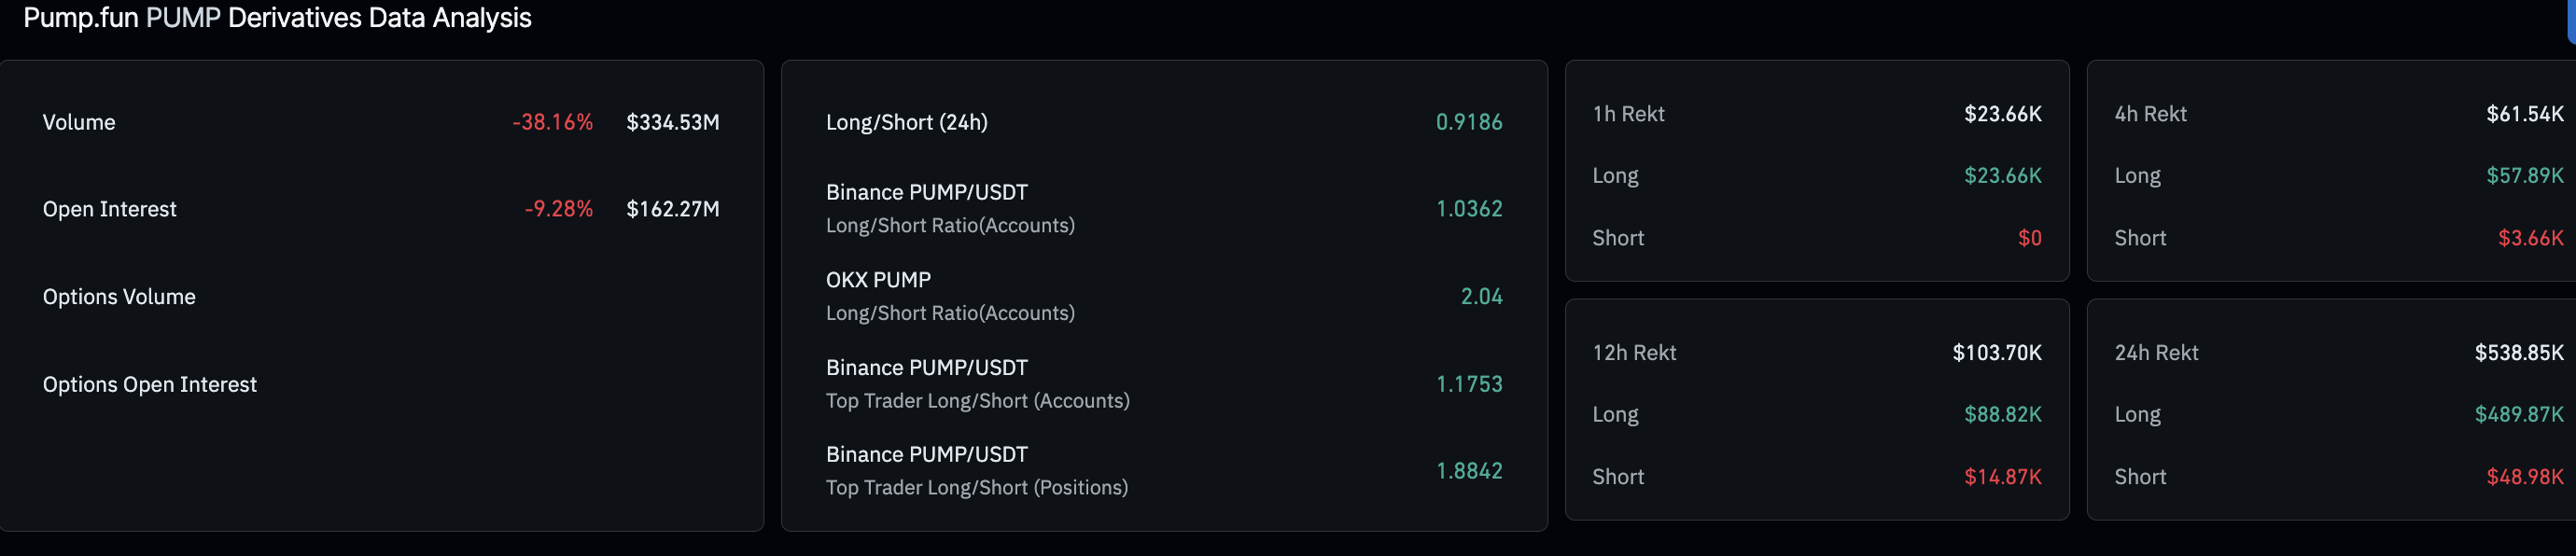
On the derivatives side, CoinGlass data shows a 9.28% drop in PUMP futures Open Interest (OI) over the last 24 hours to $162.27 million, reaffirming the declining demand. Furthermore, the $489,870 in long liquidations outpaced the $48,980 in short liquidations over the last 24 hours, suggesting a biased wipeout of bullish positions. Long liquidation spikes and declining OI are consistent with the bearish outlook for PUMP.
Technical outlook: Will PUMP extend the correction phase?
PUMP’s breakout rally from a descending trendline connecting the September 18 and January 6 highs failed to clear the R1 Pivot Point at $0.002983, returning to the breakout zone.
The bullish momentum has cooled after the breakout, and the technical indicators suggest a downside bias. The Moving Average Convergence Divergence (MACD) slips below the red line on the daily chart near the zero level, giving a sell signal and suggesting renewed bearish pressure. At the same time, the Relative Strength Index (RSI) is at 49, violating the midline support and suggesting subdued buying pressure.
If the Solana-based launchpad token slips below the January 19 low at $0.002247, it would expose the $0.002000 psychological support and the deeper support near the December 24 low at $0.001678.
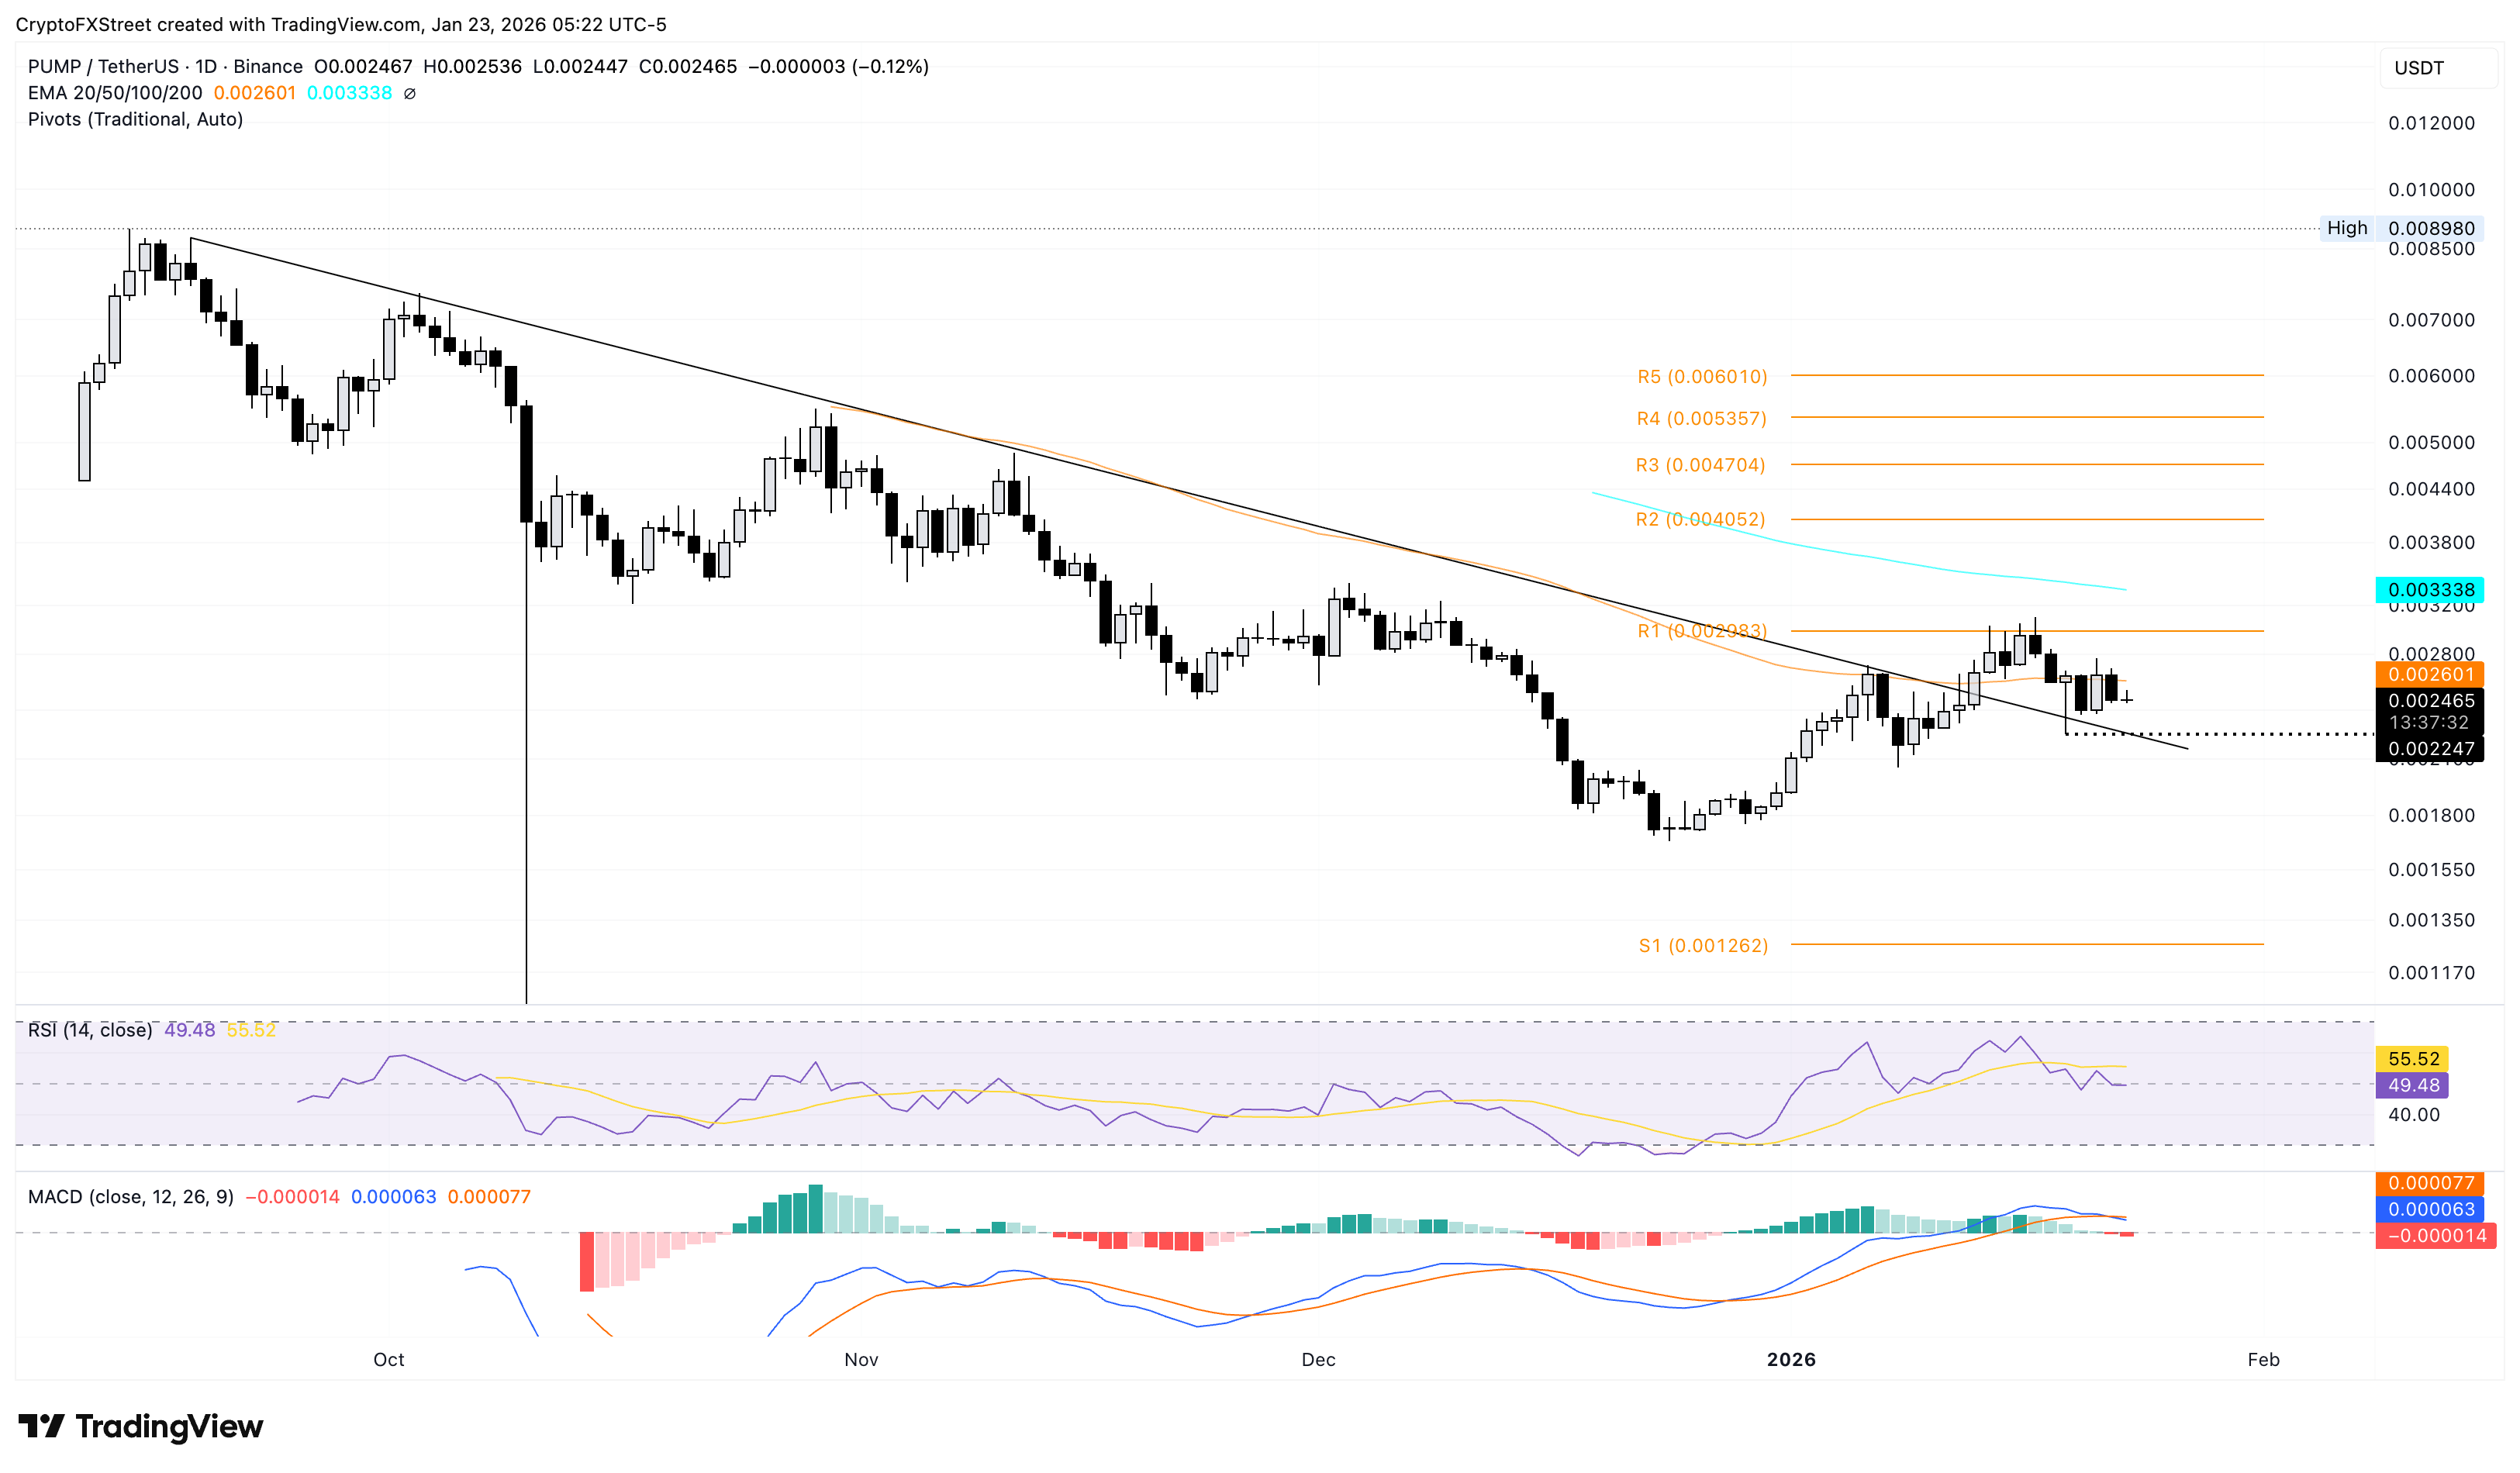
On the upside, PUMP should clear $0.002983 to reinstate an upward trend toward the 100-day EMA at $0.003338.
(The technical analysis of this story was written with the help of an AI tool.)

100만 명이 넘는 사용자가 FXStreet를 통해 실시간 시장 데이터, 차트 도구, 전문가 인사이트, 포렉스 뉴스를 이용합니다. 포괄적인 경제 캘린더와 교육 웨비나는 트레이더가 정보를 유지하고 신중한 결정을 내리도록 돕습니다. FXStreet는 바르셀로나 본사와 전 세계 지역에 걸쳐 약 60명의 팀으로 구성되어 있습니다.
더 읽기


