
Ripple Price Forecast: XRP retests $1.30 support amid volatile on-chain activity
작성자 John Isige
수정됨: 2 Apr 2026


인기 기사

Ripple (XRP) is trading near $1.30 at the time of writing on Thursday, as Iran's war-driven sentiment weighs on risk assets. XRP’s attempt to regain momentum this week stalled near $1.37 on Monday, reflecting risk-off sentiment amid capital exiting digital investment products.
- XRP extends its pullback near the $1.30 support level as crypto prices broadly correct on Thursday.
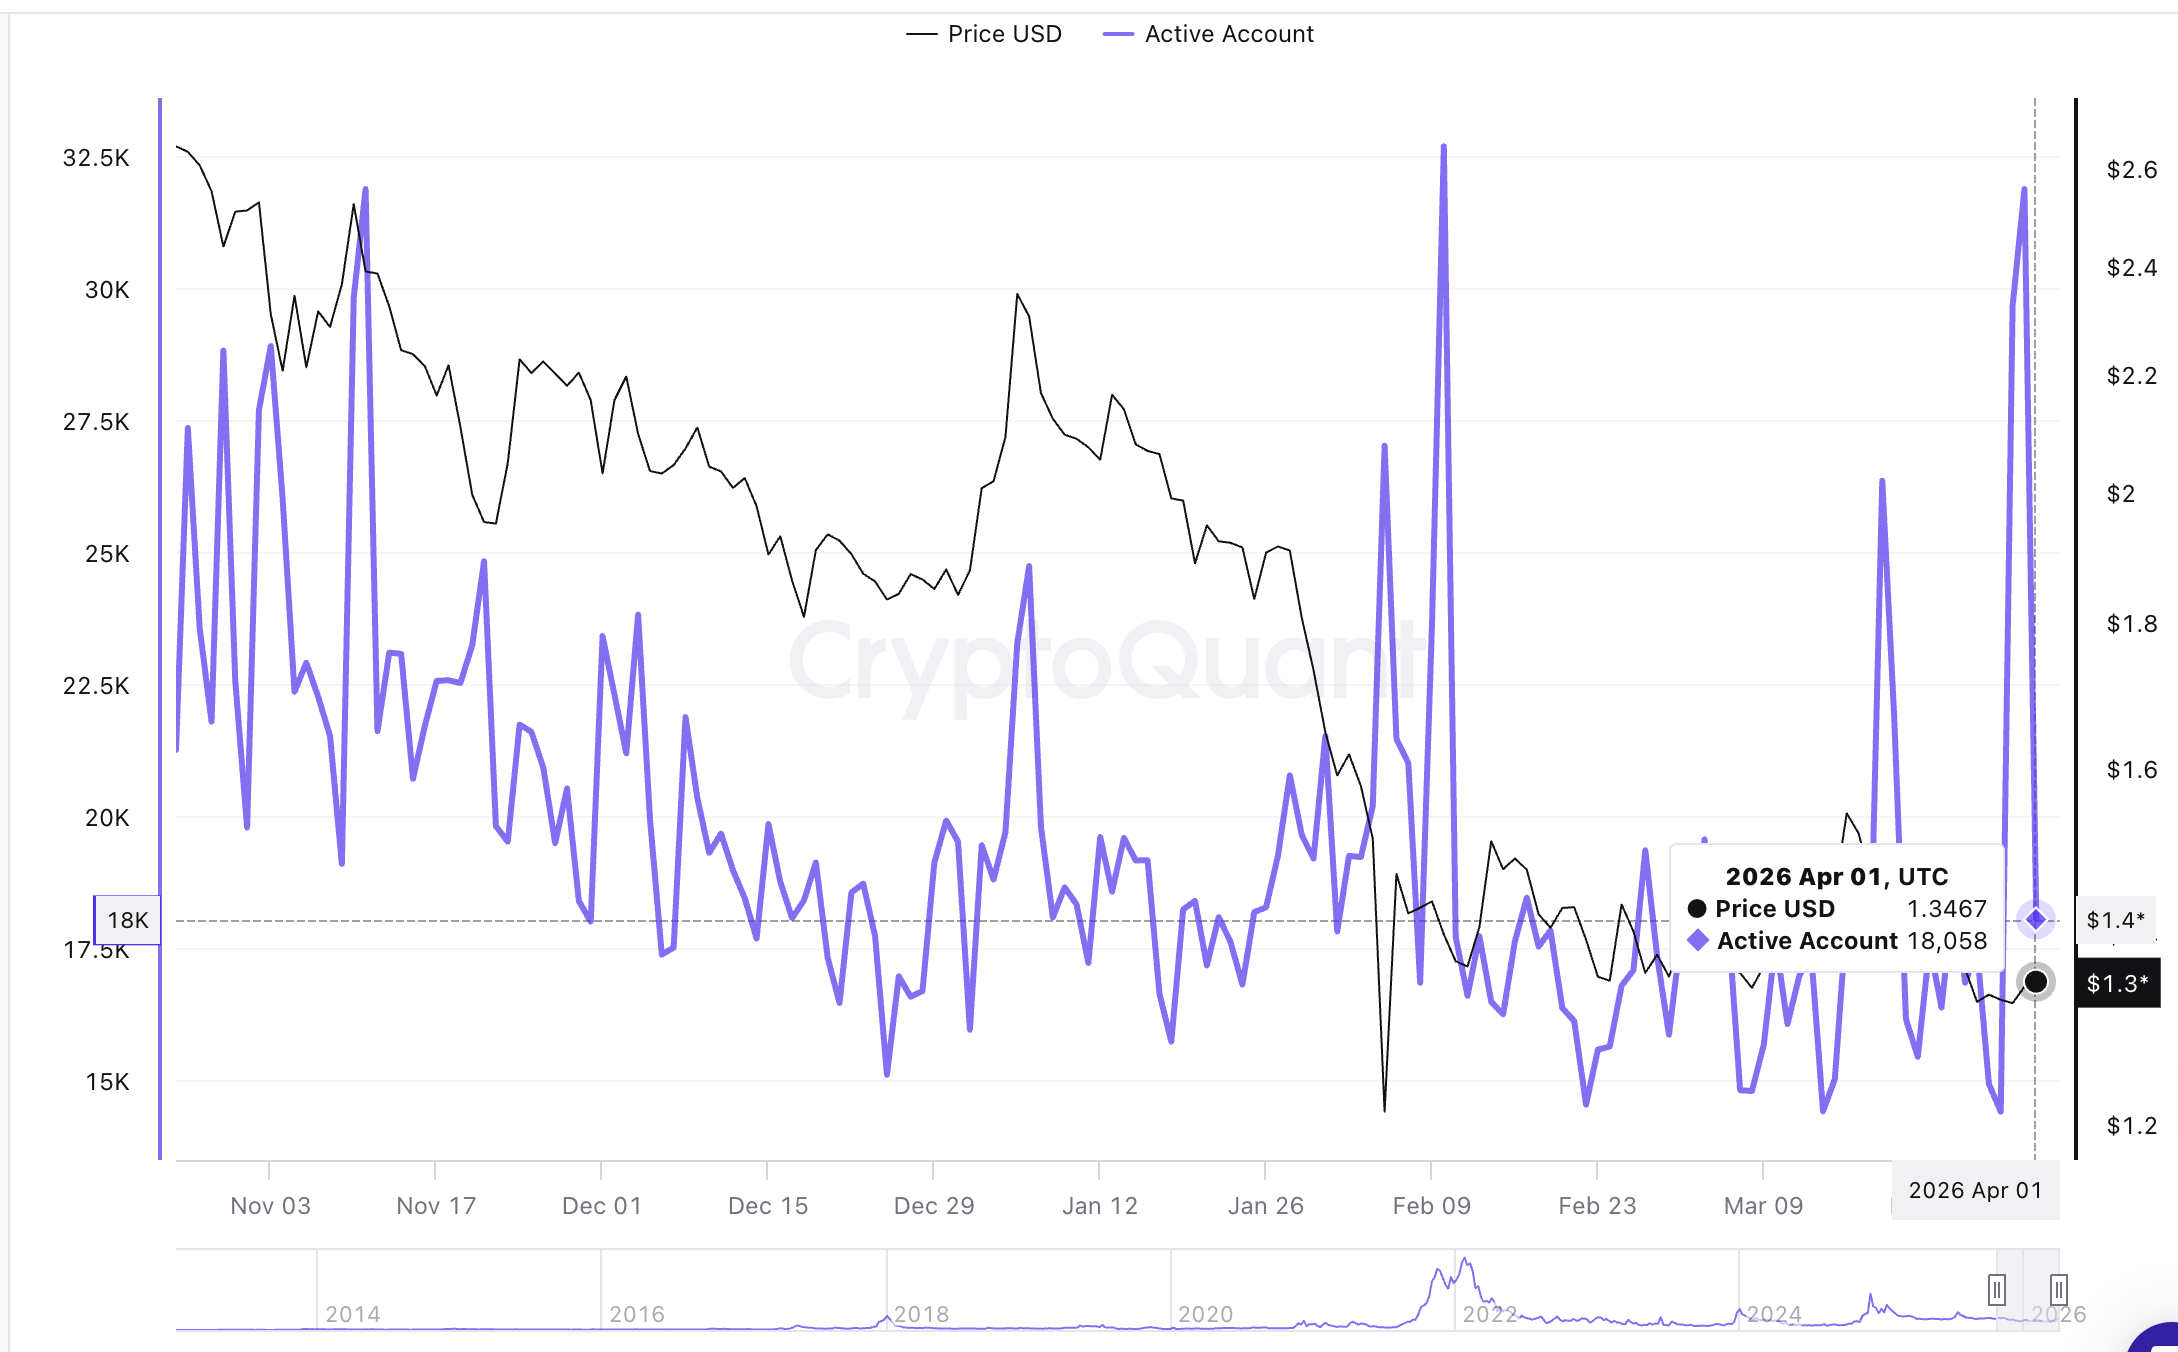
- XRP’s number of addresses plunged to nearly 18,000 on Wednesday after spiking to above 31,000 on Tuesday.
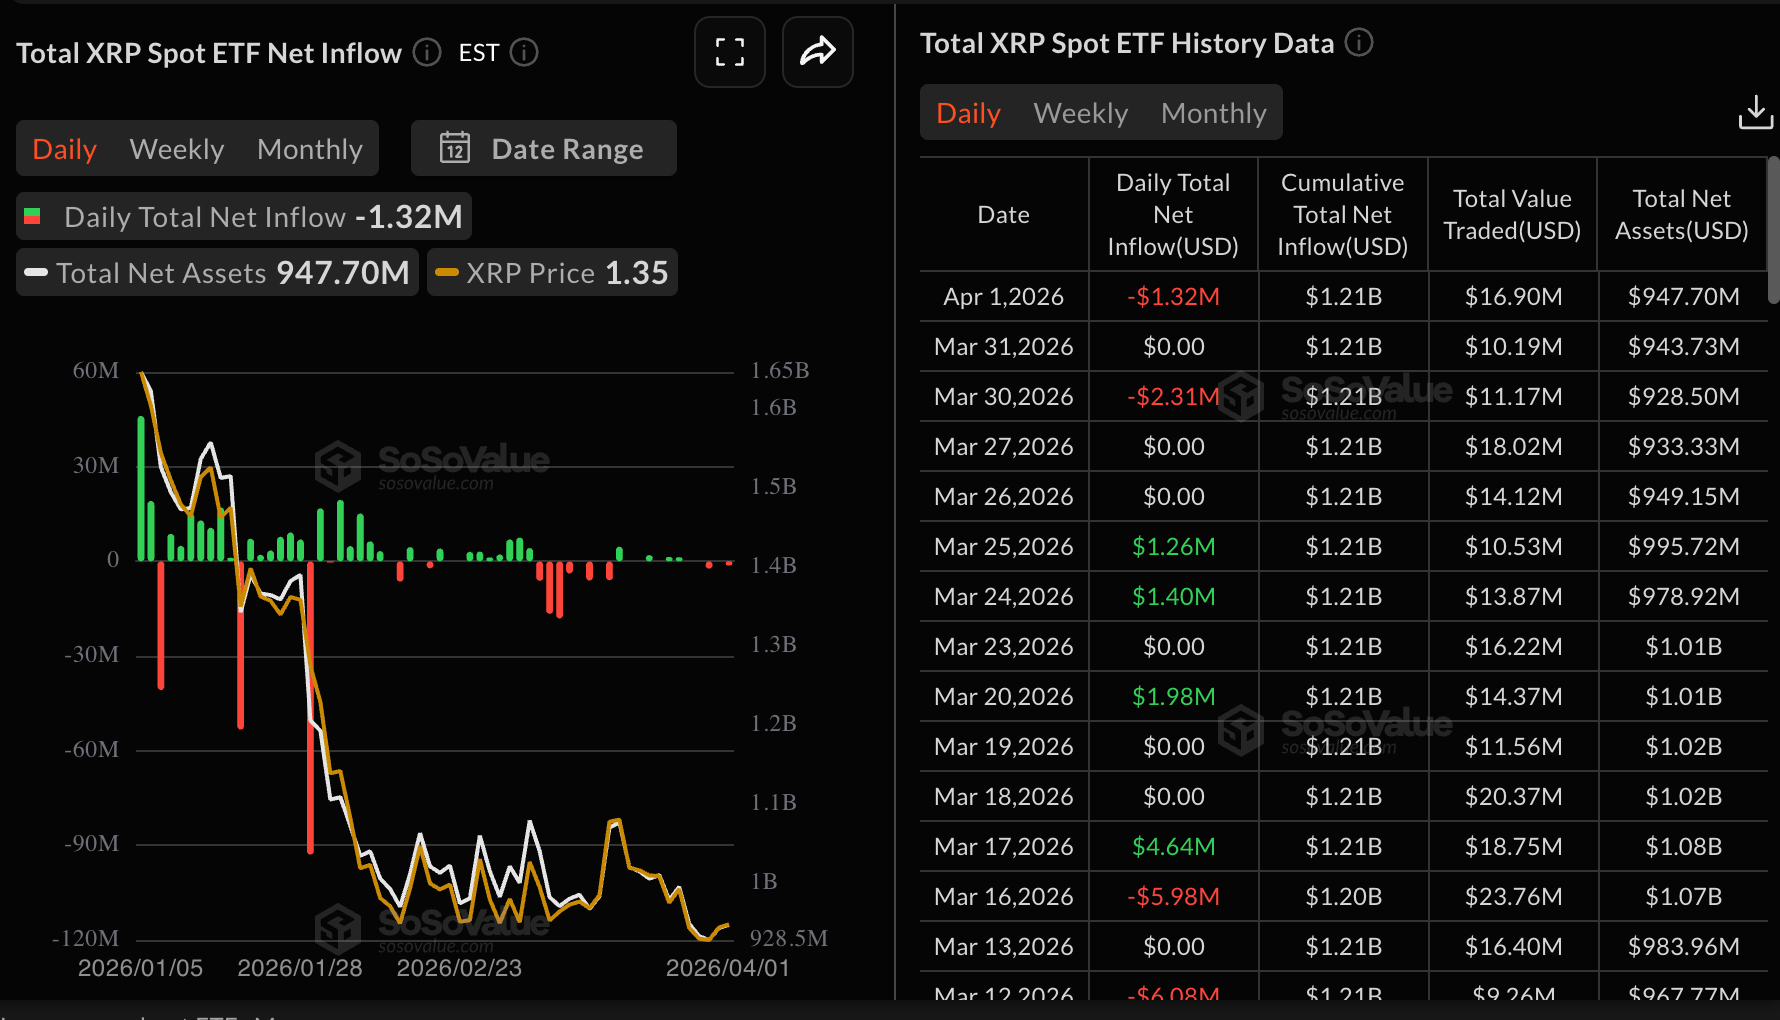
- XRP ETFs face capital flight as outflows total $1.32 million on Wednesday, reflecting sticky risk-averse sentiment.
Ripple (XRP) is trading near $1.30 at the time of writing on Thursday, as Iran's war-driven sentiment weighs on risk assets. XRP’s attempt to regain momentum this week stalled near $1.37 on Monday, reflecting risk-off sentiment amid capital exiting digital investment products.
XRP wobbles on fading on-chain activity, institutional interest
The number of active addresses transacting on the XRP Ledger (XRPL) dropped by nearly 42% to around 18,000 on Wednesday, from nearly 32,000 on Tuesday, suggesting volatile activity amid the war in the Middle East, which has continued to pressure risk assets.
The CryptoQuant chart below suggests that demand for XRP has remained subdued since early February, apart from a few isolated spikes in active addresses. Without steady user engagement, buying pressure narrows, weakening momentum.
Interest in XRP Exchange-Traded Funds (ETFs) has deteriorated further, as evidenced by mild outflows of $1.32 million on Wednesday following muted activity on Tuesday. XRP ETFs also recorded outflows of roughly $2.3 million on Monday, undermining risk appetite.
If outflows persist, they would suggest that sentiment is deteriorating, limiting XRP’s potential recovery.
Technical outlook: XRP risks extending sell-off below $1.30
XRP edges lower near $1.30 amid a dominant near-term bearish bias, as the price extends its slide below the descending resistance trendline. The remittance token is holding below the 50-day Exponential Moving Average (EMA) that sits near $1.44. At the same time, the 100-day and 200-day EMAs near $1.61 and $1.89 remain well above spot, reinforcing a broader downside context.
The Moving Average Convergence Divergence (MACD) indicator is below its signal line on the daily chart and has slipped into negative territory, with mildly expanding bearish histogram bars, suggesting selling pressure persists. Moreover, the Relative Strength Index (RSI) near 38 remains below the 50 mark on the same chart, suggesting weakening momentum rather than oversold conditions.
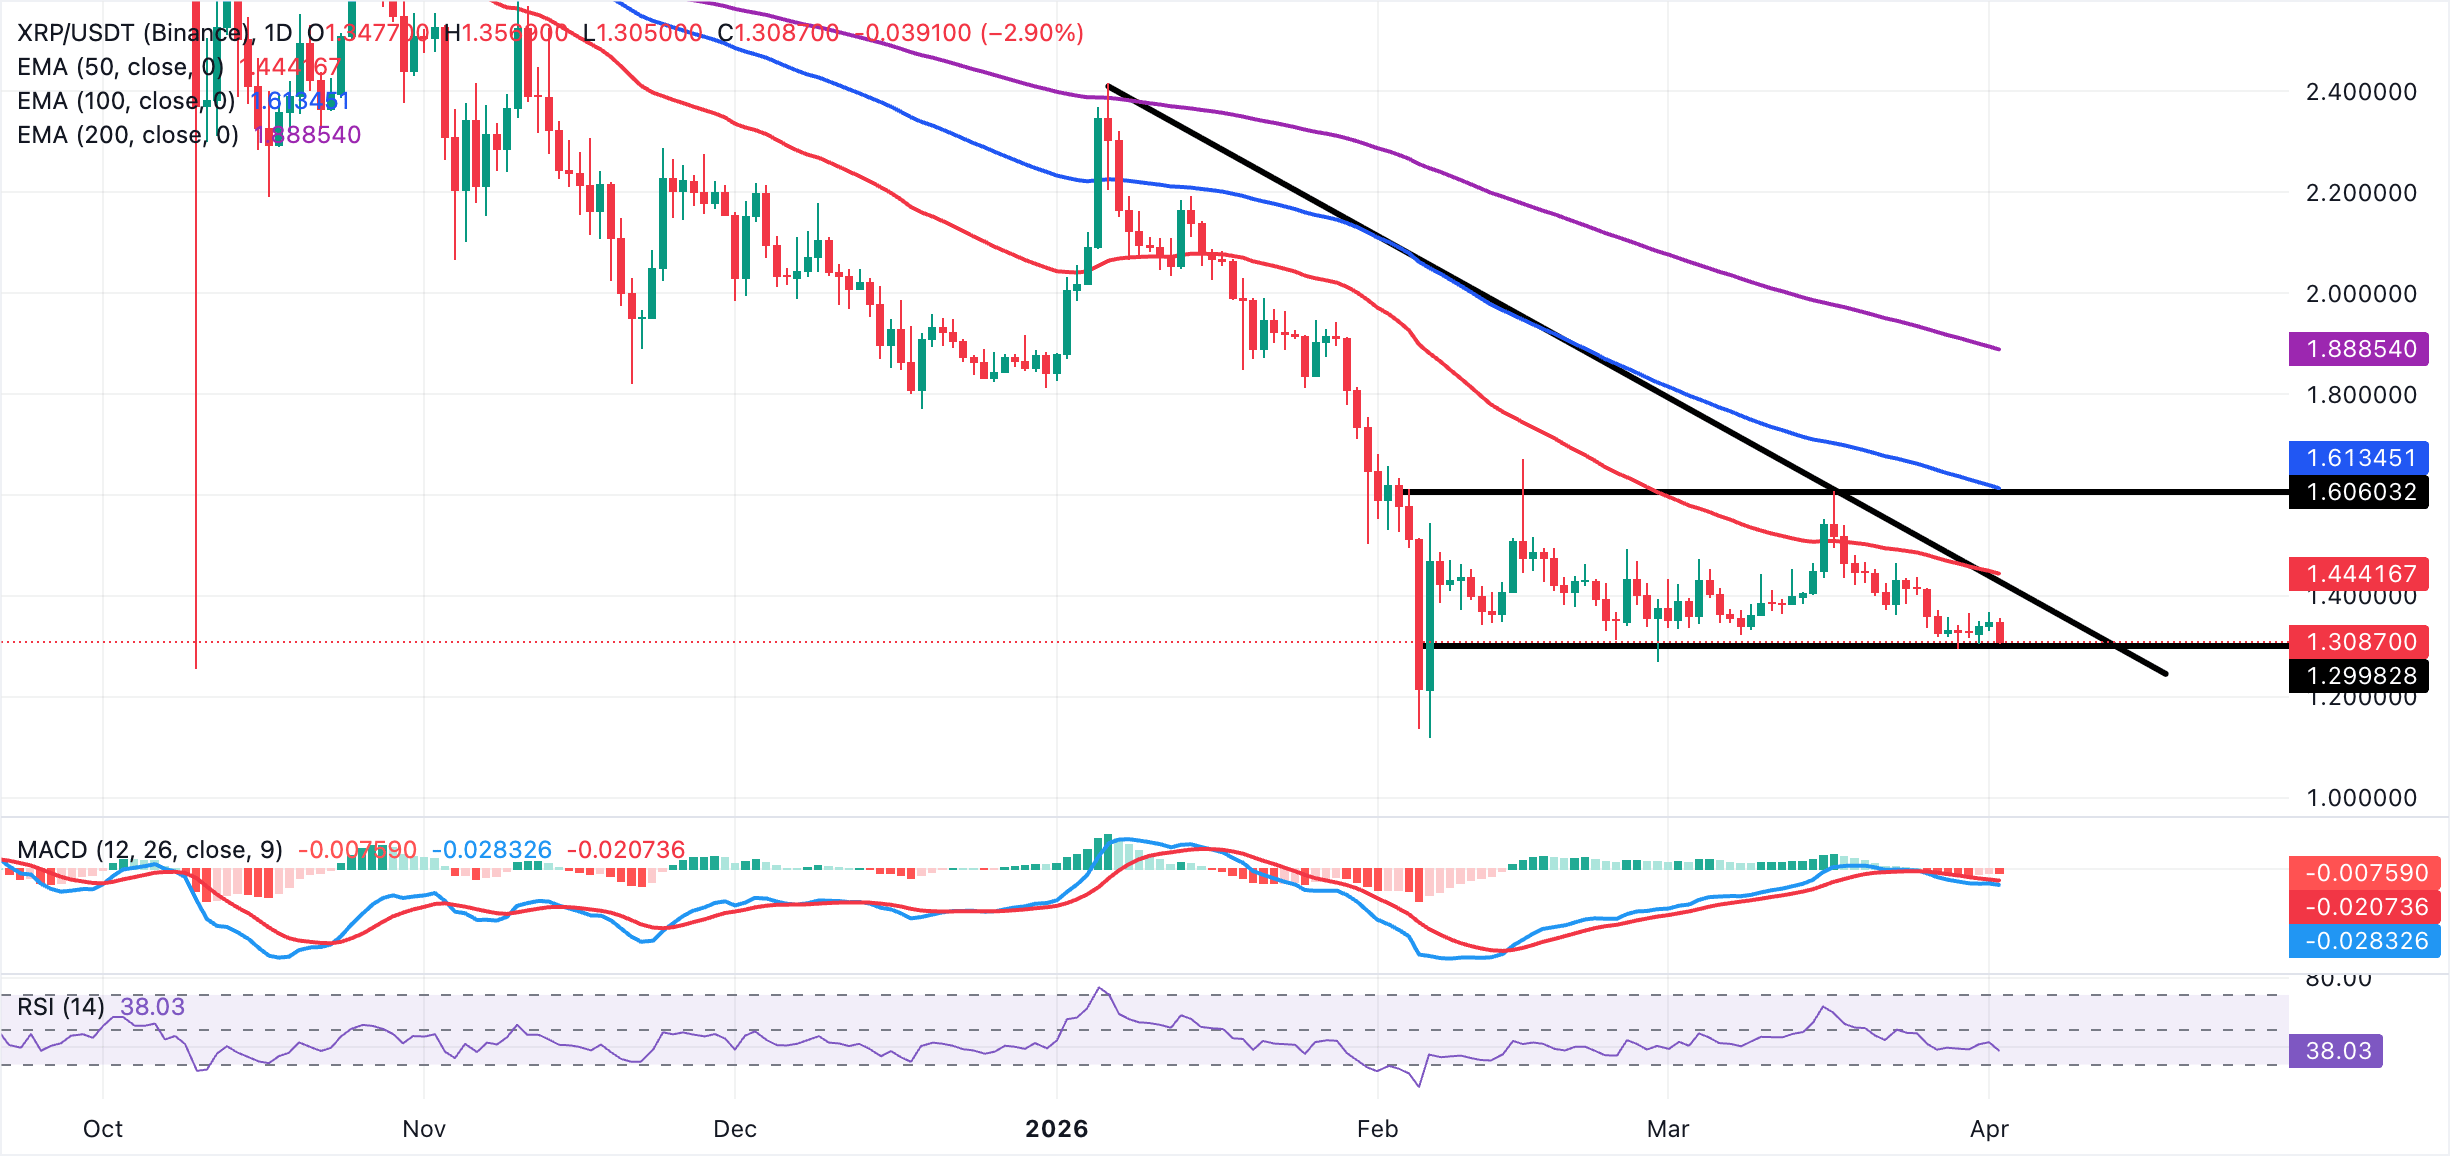
XRP's immediate support lies at the recent low around $1.30, and a decisive break below this area would expose the next downside levels at $1.27 and then $1.25. On the topside, initial resistance aligns with the prior breakdown zone near $1.36, where recent candles stalled, followed by the $1.41–$1.42 band. A recovery above $1.42 would be needed to ease the current bearish pressure and open a move back toward the 50-day EMA around 1.44, where a denser resistance zone is expected to cap first attempts higher.
Cryptocurrency metrics FAQs
The developer or creator of each cryptocurrency decides on the total number of tokens that can be minted or issued. Only a certain number of these assets can be minted by mining, staking or other mechanisms. This is defined by the algorithm of the underlying blockchain technology. On the other hand, circulating supply can also be decreased via actions such as burning tokens, or mistakenly sending assets to addresses of other incompatible blockchains.
Market capitalization is the result of multiplying the circulating supply of a certain asset by the asset’s current market value.
Trading volume refers to the total number of tokens for a specific asset that has been transacted or exchanged between buyers and sellers within set trading hours, for example, 24 hours. It is used to gauge market sentiment, this metric combines all volumes on centralized exchanges and decentralized exchanges. Increasing trading volume often denotes the demand for a certain asset as more people are buying and selling the cryptocurrency.
Funding rates are a concept designed to encourage traders to take positions and ensure perpetual contract prices match spot markets. It defines a mechanism by exchanges to ensure that future prices and index prices periodic payments regularly converge. When the funding rate is positive, the price of the perpetual contract is higher than the mark price. This means traders who are bullish and have opened long positions pay traders who are in short positions. On the other hand, a negative funding rate means perpetual prices are below the mark price, and hence traders with short positions pay traders who have opened long positions.
(The technical analysis of this story was written with the help of an AI tool.)

100만 명이 넘는 사용자가 FXStreet를 통해 실시간 시장 데이터, 차트 도구, 전문가 인사이트, 포렉스 뉴스를 이용합니다. 포괄적인 경제 캘린더와 교육 웨비나는 트레이더가 정보를 유지하고 신중한 결정을 내리도록 돕습니다. FXStreet는 바르셀로나 본사와 전 세계 지역에 걸쳐 약 60명의 팀으로 구성되어 있습니다.
더 읽기


