
Ripple Price Forecast: XRP risks bearish shift as price drops below $1.40
작성자 John Isige
수정됨: 28 Apr 2026


인기 기사

Ripple (XRP) is edging lower below $1.40 at the time of writing on Tuesday, as the broader crypto market faces renewed volatility. The remittance token is under intense sell-side pressure and struggling to hold key support levels amid growing risk-off sentiment.
- XRP extends its downward trajectory, slipping below $1.40 after encountering resistance at the $1.45 weekly high.
- Risk-averse sentiment deepens amid muted activity in the XRP spot ETFs.
- XRP exhibits a weak technical structure, with deteriorating momentum indicators.
Ripple (XRP) is edging lower below $1.40 at the time of writing on Tuesday, as the broader crypto market faces renewed volatility. The remittance token is under intense sell-side pressure and struggling to hold key support levels amid growing risk-off sentiment.
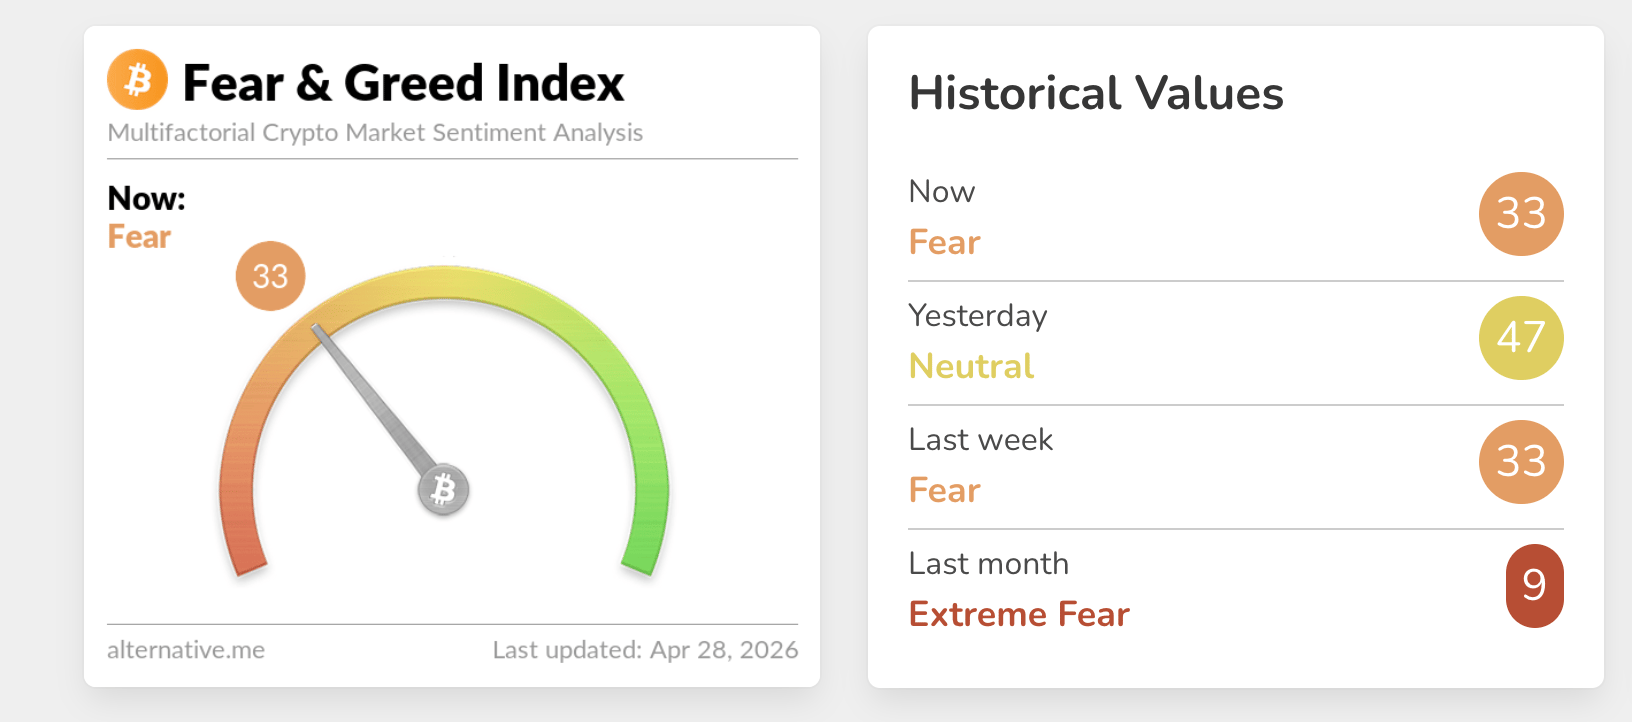
The conflict in the Middle East continues to drive investors on edge, while the crypto Fear & Greed Index declines to 33 on Tuesday, from 47 the previous day. Despite the United States (US)-Iran ceasefire holding, the Strait of Hormuz is still shut.
Reports say that US President Donald Trump is unlikely to accept Iran’s proposal to open the Strait, which skips Tehran’s nuclear program. Dismantling Iran’s nuclear program remains to be Trump’s hardline point to ending the war.
Risk-off sentiment persists amid muted ETF activity
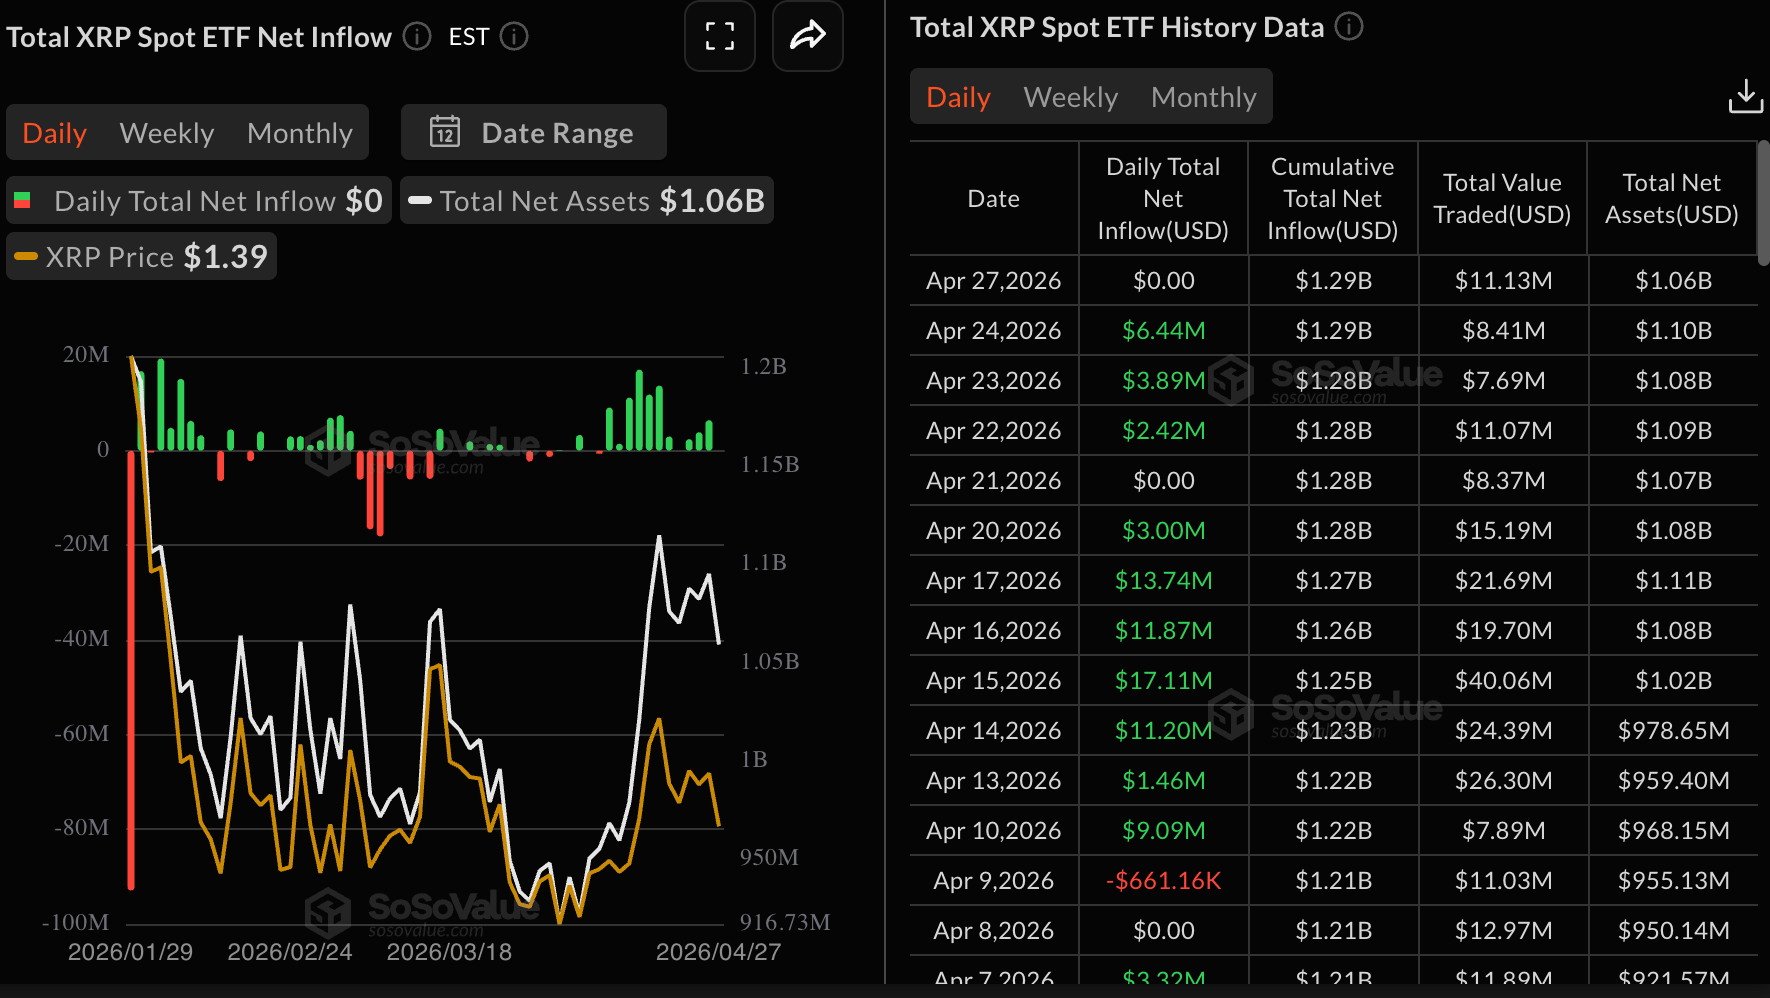
Institutional interest in XRP digital investment products shows signs of deterioration, as ETFs remained quiet on Monday, with no flows recorded, according to SoSoValue data. Cumulative inflows held at $1.29 billion, while net assets under management averaged $1.06 billion. If sentiment softens further amid deteriorating risk appetite, recovery for XRP could be an uphill battle.
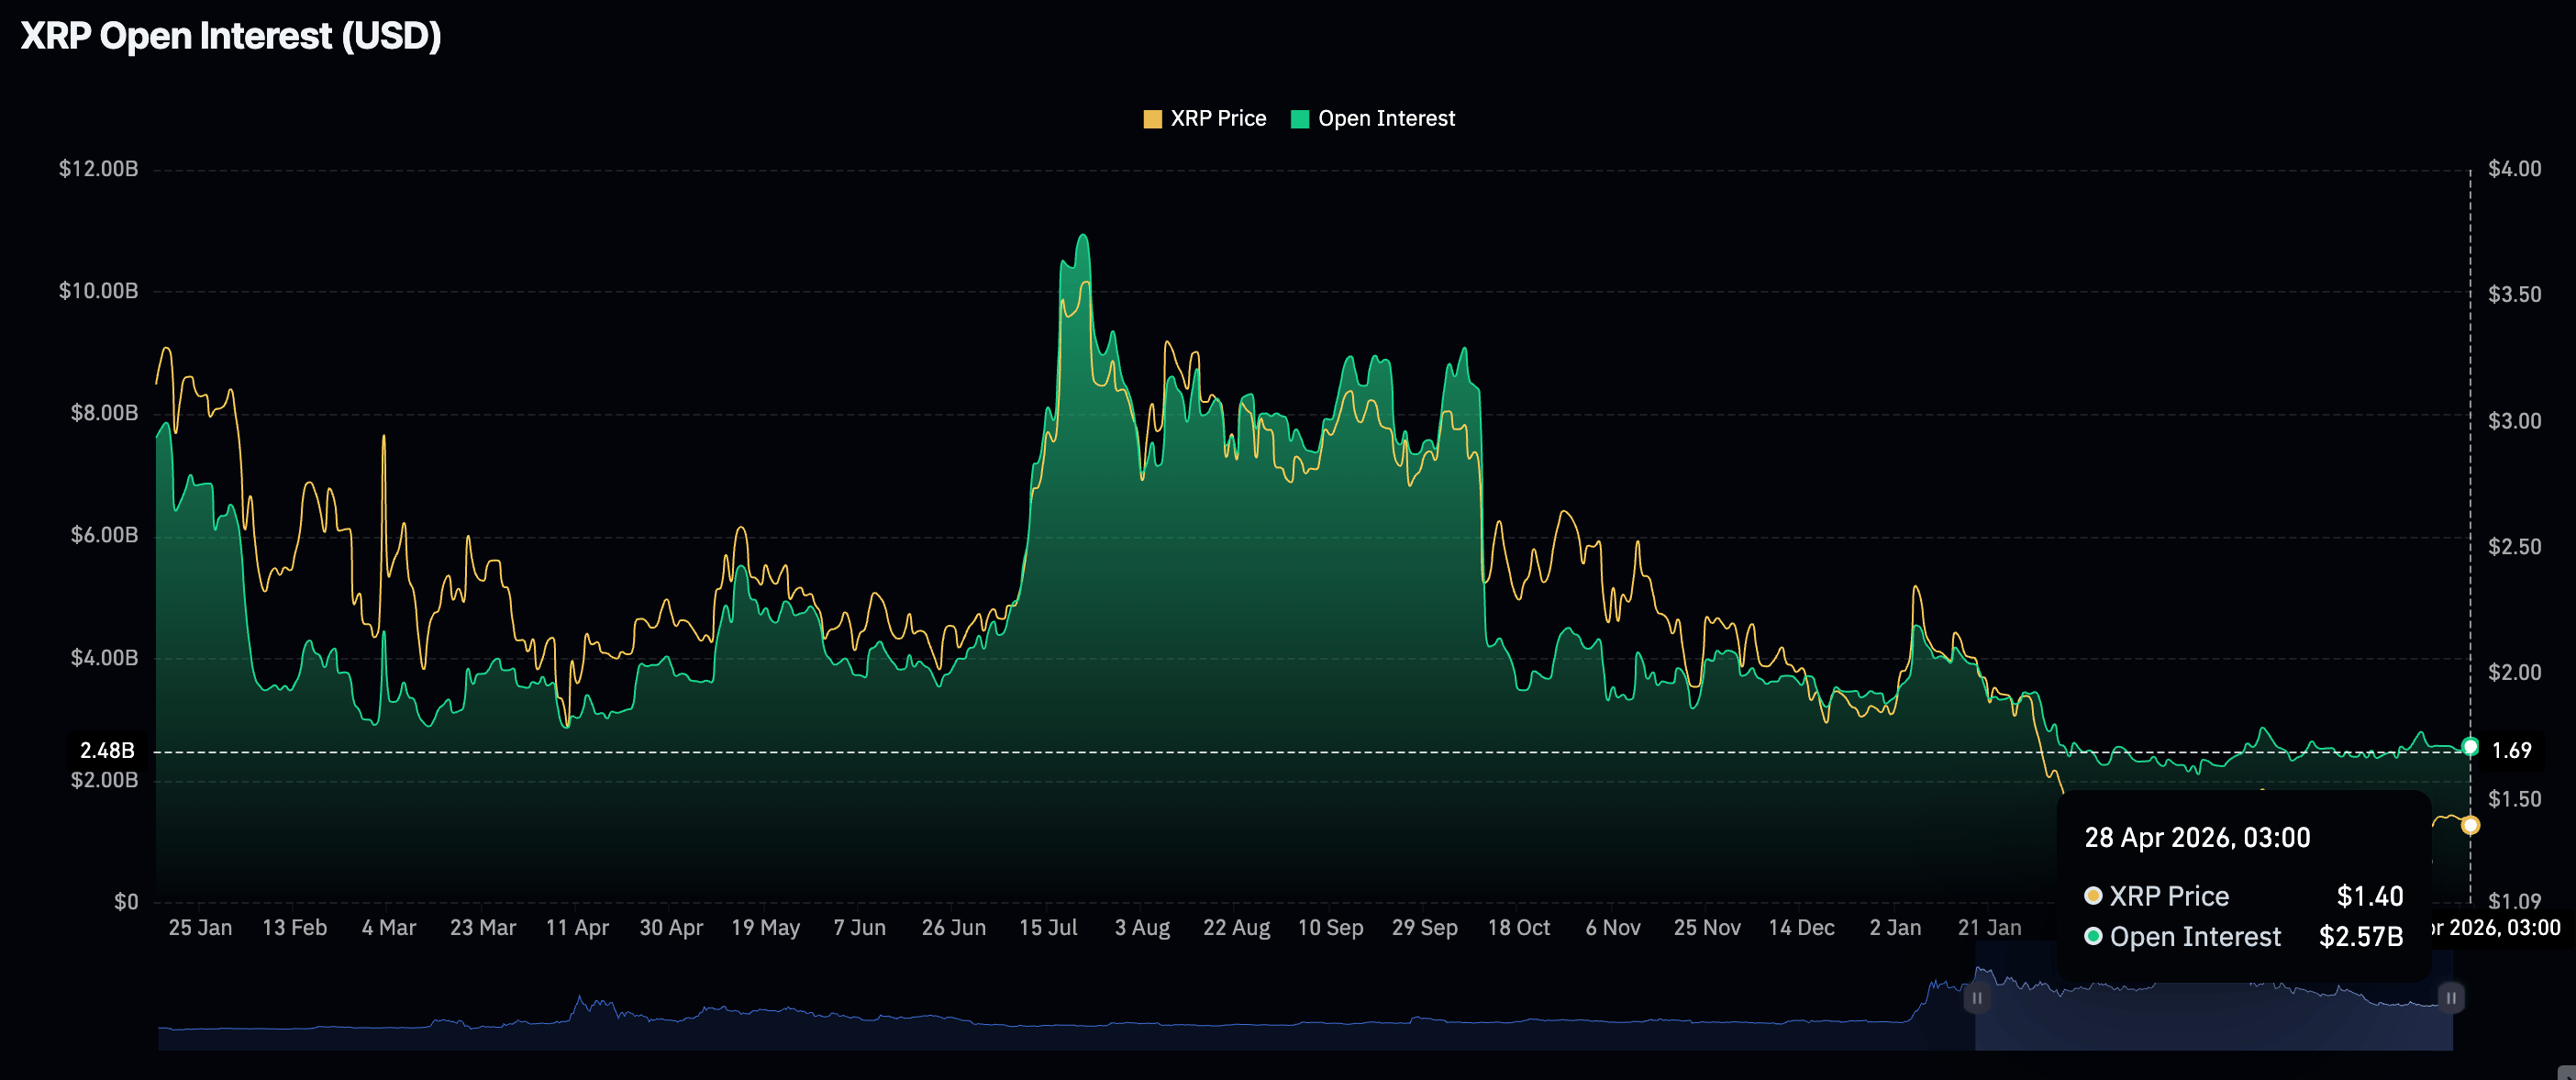
Despite retail demand holding steady with the futures Open Interest (OI) at $2.57 billion, it pales in comparison to the record $10.94 billion reached in July. Low retail demand signals that investors lack conviction in XRP’s ability to sustain the uptrend. Hence, there is an unwillingness to open new positions.
Technical outlook: XRP at risk of extending losses
XRP trades at $1.38, maintaining a bearish near-term bias. The price holds below the 20-day Simple Moving Average (SMA) of the Bollinger Bands around $1.40 and the 50-day Exponential Moving Average near $1.41, confirming a broader bearish outlook.
The Relative Strength Index (RSI) sits just below the 50 midline, around 47 on the daily chart, while the Moving Average Convergence Divergence (MACD) histogram has slipped marginally back below zero, with the signal line turning down. Both indicators suggest waning upside momentum as rallies meet overhead supply.
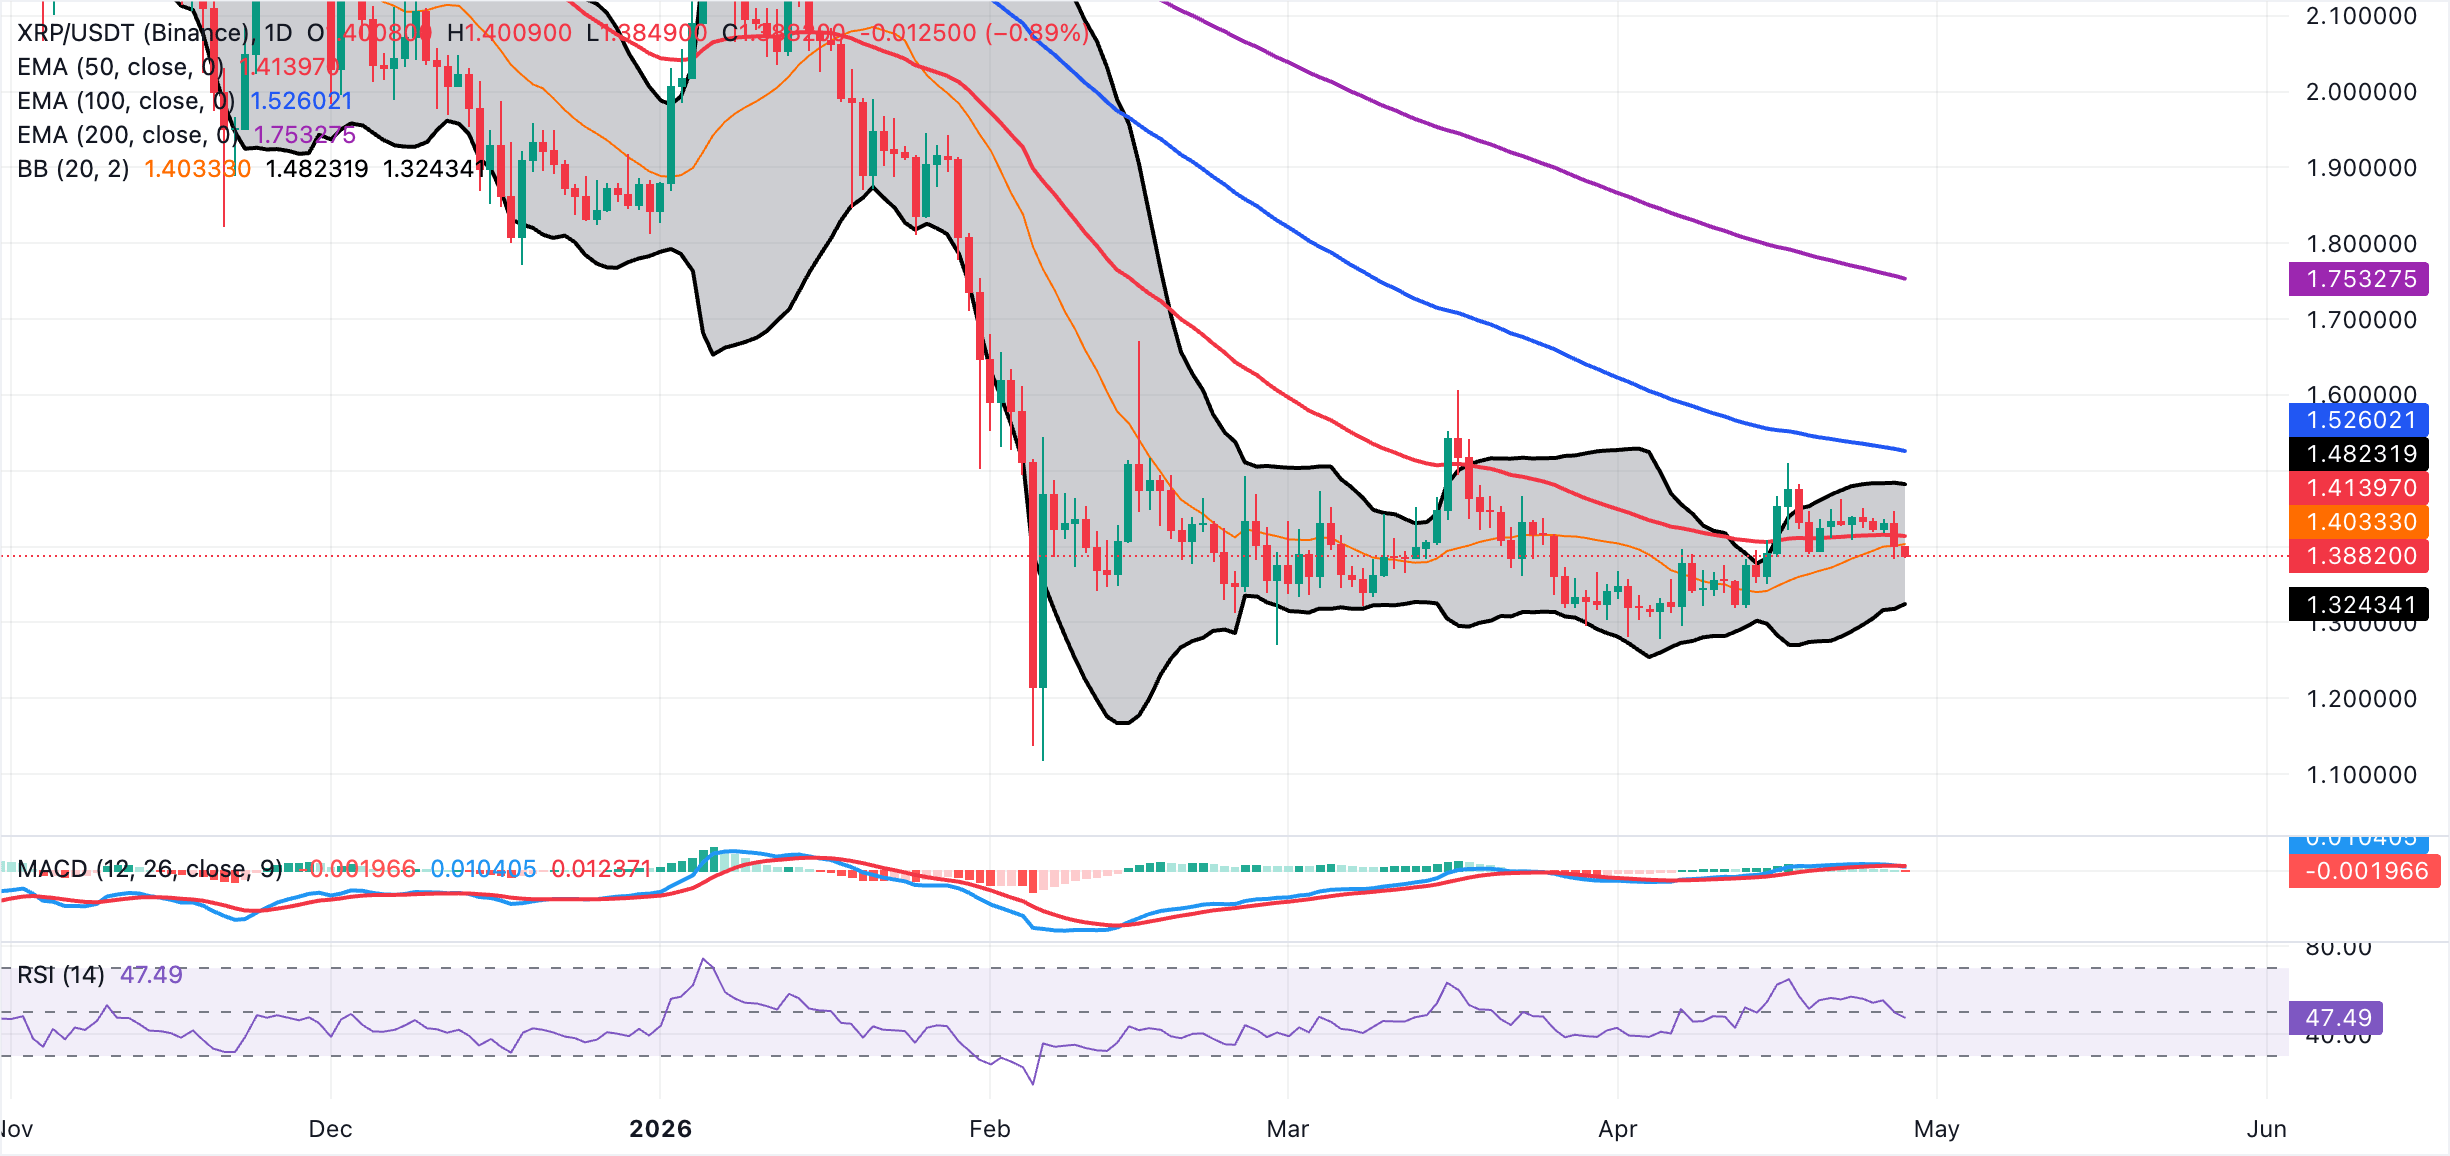
On the topside, initial resistance is aligned at the Bollinger Bands' middle boundary at $1.40, followed by the 50-day EMA around $1.41. A stronger recovery would face further caps at the upper Bollinger Band near $1.48, then at the 100-day EMA at $1.53, and the 200-day EMA near $1.75, reasserting the broader bearish structure. On the downside, the lower Bollinger Band at roughly $1.32 serves as the next notable support, with a sustained break below it likely opening the door to deeper losses within the prevailing daily downtrend.
(The technical analysis of this story was written with the help of an AI tool.)
Crypto ETF FAQs
An Exchange-Traded Fund (ETF) is an investment vehicle or an index that tracks the price of an underlying asset. ETFs can not only track a single asset, but a group of assets and sectors. For example, a Bitcoin ETF tracks Bitcoin’s price. ETF is a tool used by investors to gain exposure to a certain asset.
Yes. The first Bitcoin futures ETF in the US was approved by the US Securities & Exchange Commission in October 2021. A total of seven Bitcoin futures ETFs have been approved, with more than 20 still waiting for the regulator’s permission. The SEC says that the cryptocurrency industry is new and subject to manipulation, which is why it has been delaying crypto-related futures ETFs for the last few years.
Yes. The SEC approved in January 2024 the listing and trading of several Bitcoin spot Exchange-Traded Funds, opening the door to institutional capital and mainstream investors to trade the main crypto currency. The decision was hailed by the industry as a game changer.
The main advantage of crypto ETFs is the possibility of gaining exposure to a cryptocurrency without ownership, reducing the risk and cost of holding the asset. Other pros are a lower learning curve and higher security for investors since ETFs take charge of securing the underlying asset holdings. As for the main drawbacks, the main one is that as an investor you can’t have direct ownership of the asset, or, as they say in crypto, “not your keys, not your coins.” Other disadvantages are higher costs associated with holding crypto since ETFs charge fees for active management. Finally, even though investing in ETFs reduces the risk of holding an asset, price swings in the underlying cryptocurrency are likely to be reflected in the investment vehicle too.

100만 명이 넘는 사용자가 FXStreet를 통해 실시간 시장 데이터, 차트 도구, 전문가 인사이트, 포렉스 뉴스를 이용합니다. 포괄적인 경제 캘린더와 교육 웨비나는 트레이더가 정보를 유지하고 신중한 결정을 내리도록 돕습니다. FXStreet는 바르셀로나 본사와 전 세계 지역에 걸쳐 약 60명의 팀으로 구성되어 있습니다.
더 읽기


