

Ripple Price Forecast: XRP struggles build momentum amid subdued investor interest
- XRP remains range-bound, holding support at $1.10 as the crypto market broadly cools down.
- Demand for XRP spot ETFs fades amid steady perpetual futures Open Interest, exerting pressure on the short-term outlook.
- XRP’s downside is well-anchored at $1.10, reinforced by support at the Bollinger Band’s middle layer.
Ripple (XRP) is retracing toward its nearest technical support level of $1.10 as of Thursday. The remittance token has taken a breather after the macro-driven rally earlier in the week.
Interest in XRP remains modest amid easing US inflation

Signs of inflation easing in the United States (US) have had a notable boost to risk assets. On Tuesday, the Bureau of Labor Statistics (BLS) CPI report showed that inflation fell by 0.4% in June on a seasonally adjusted basis, marking the sharpest monthly decrease since April 2020.
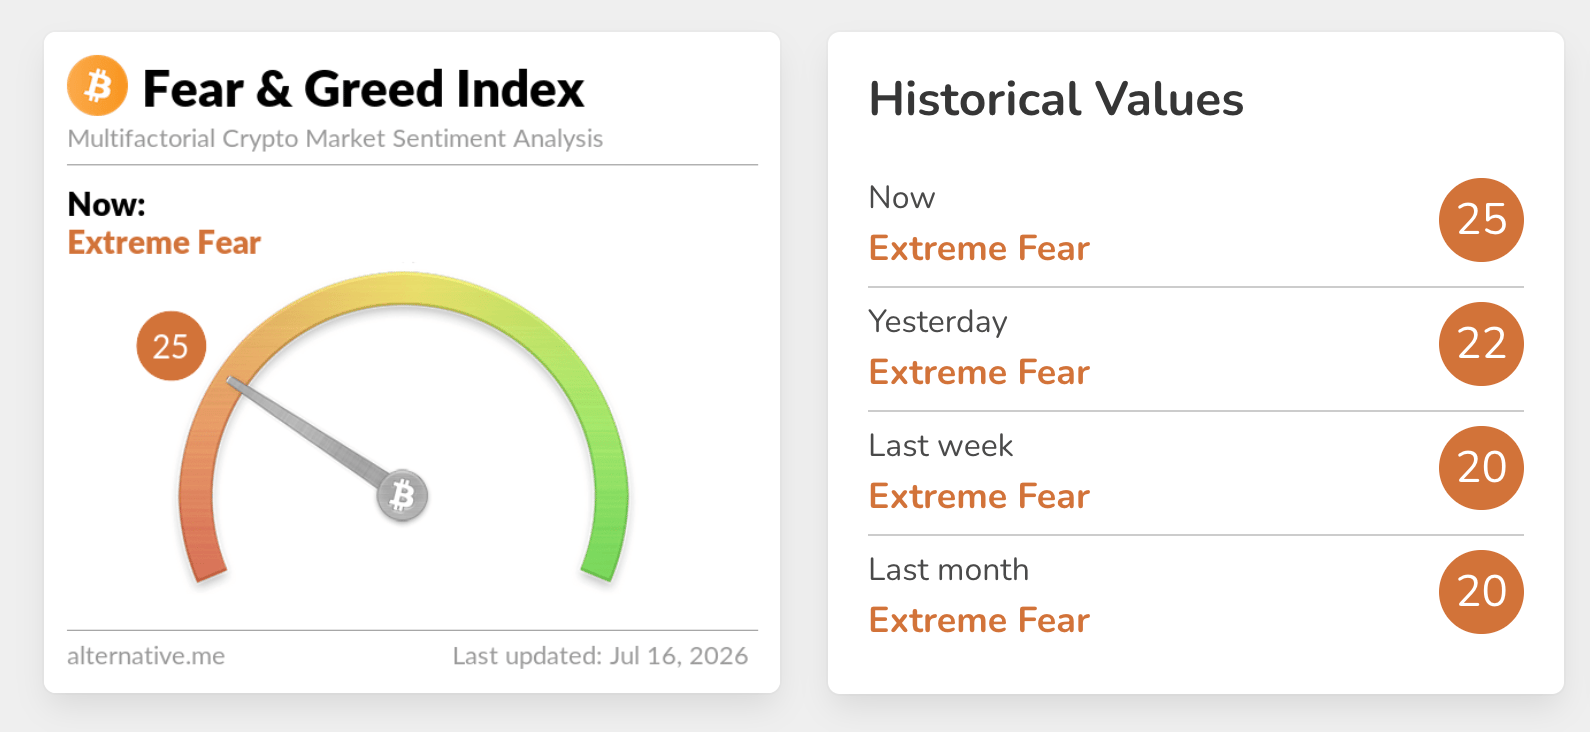
If risk-on sentiment steadily increases, demand for risk assets, including XRP, would grow, intensifying the tailwind and supporting recovery in the short to medium term. Appetite for crypto assets increased only marginally, as reflected in the Fear & Greed Index. The index is embedded in the Extreme Fear territory at 25 on Thursday, up from 22 the day before.
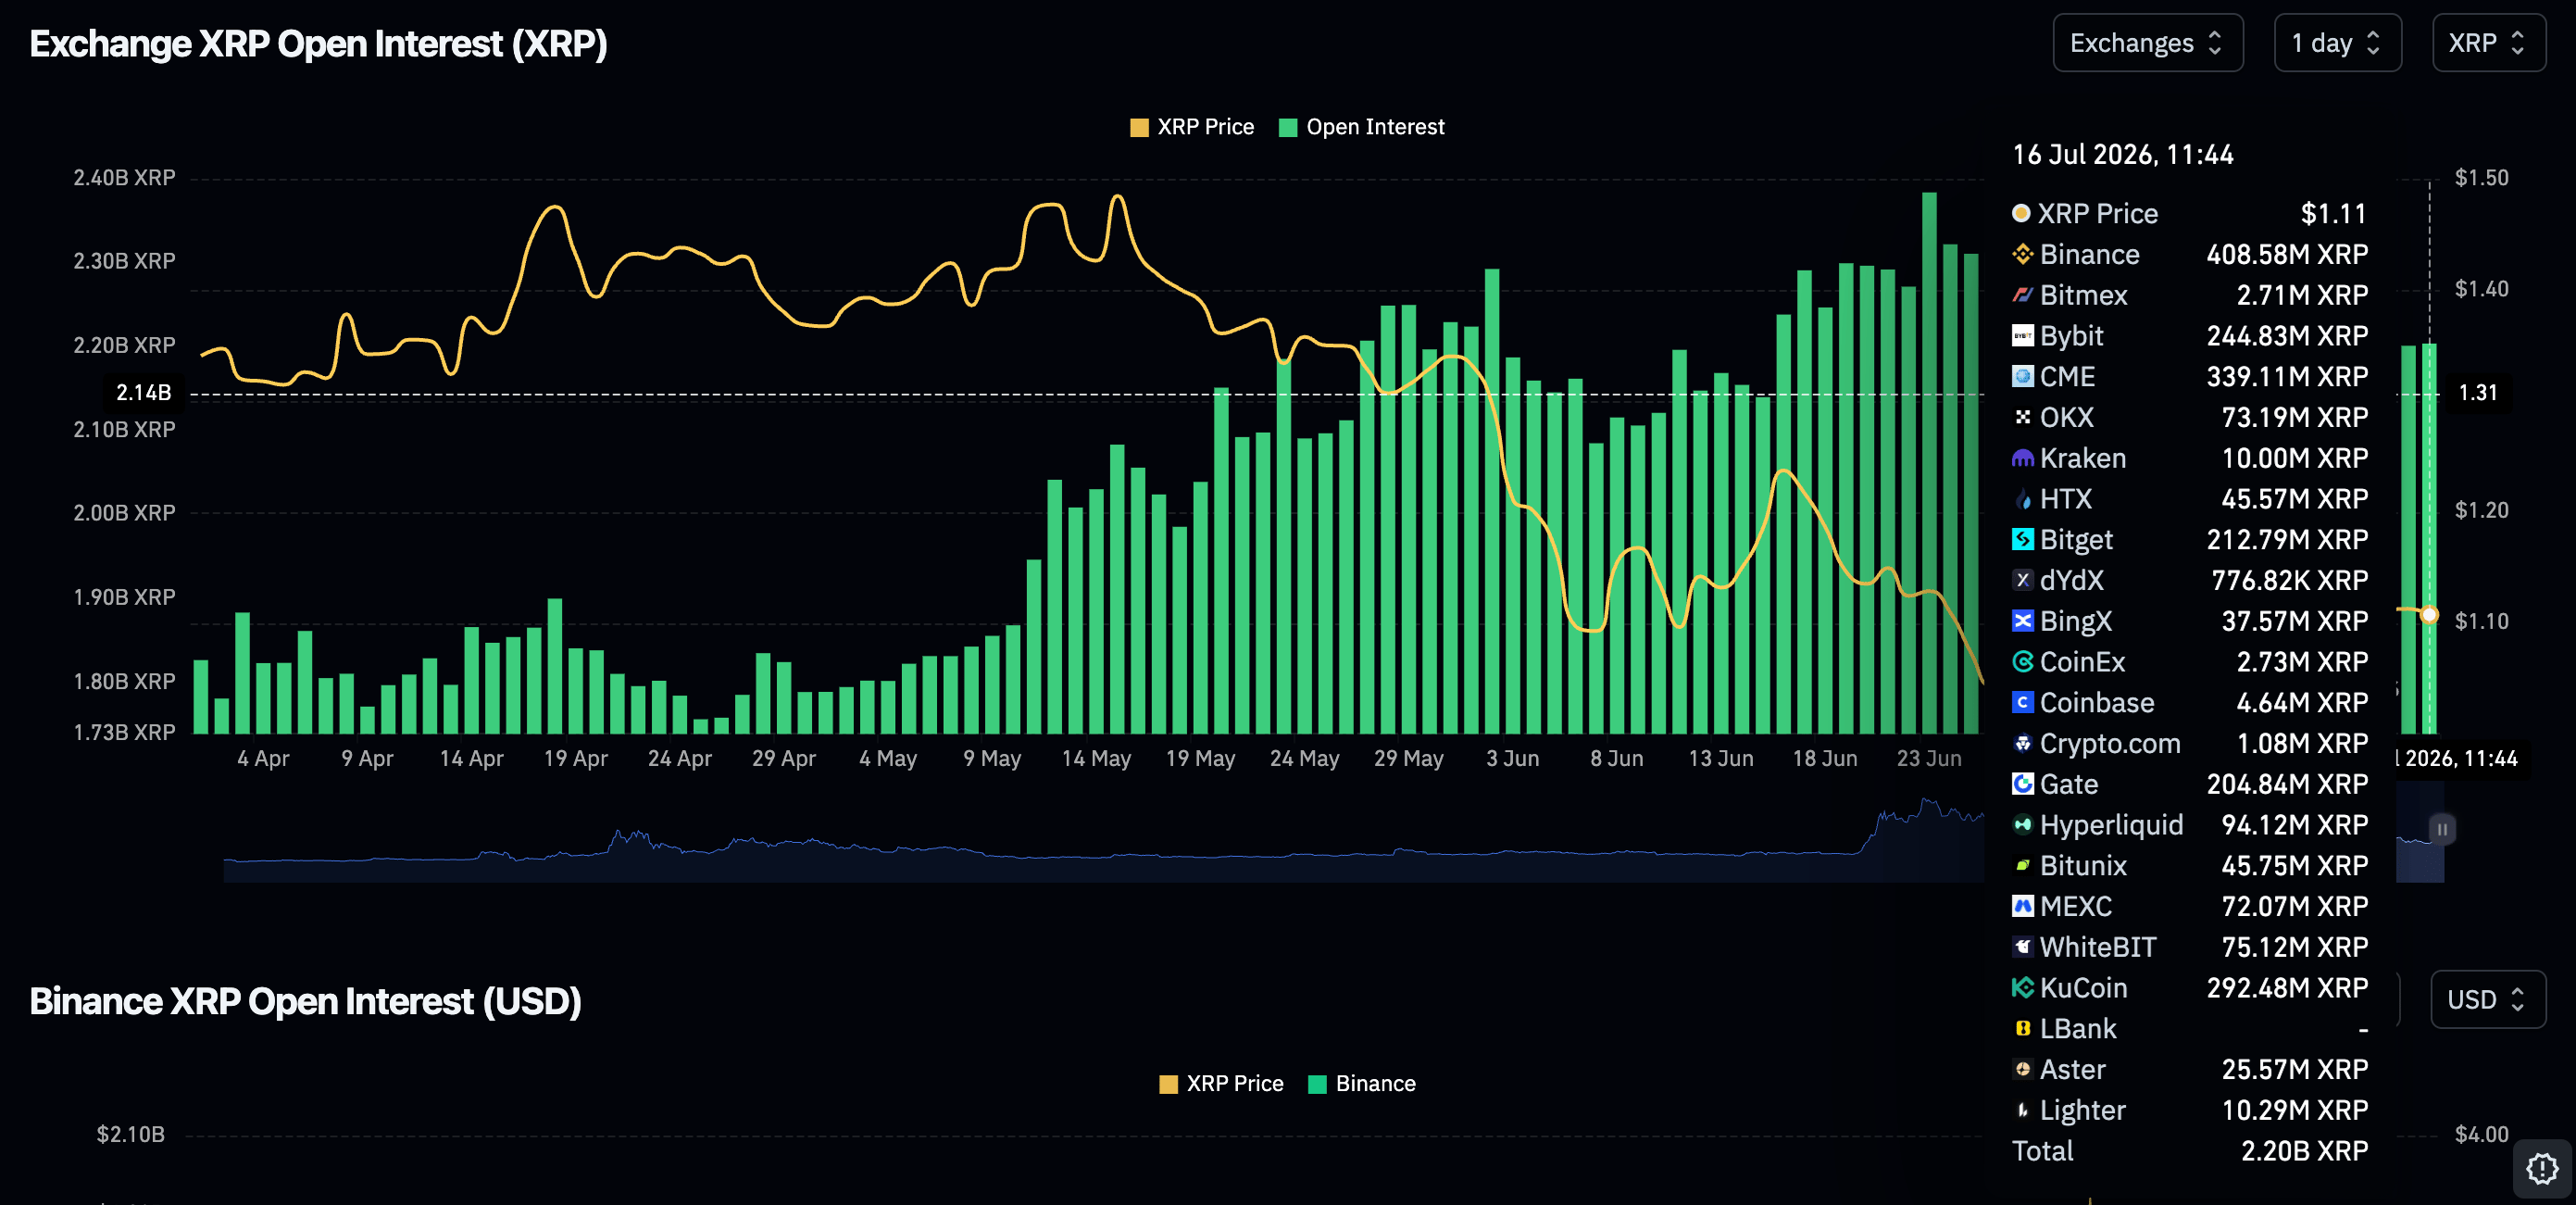
XRP retail demand shows marginal improvement, as perpetual futures OI expands to 2.21 billion XRP on Thursday, up from 2.2 billion XRP the previous day.
Despite the mild increase, CoinGlass data shows that the OI holds below the June peak of 2.28 billion XRP. This implies that steady retail demand is critical to stabilizing XRP’s short- to medium-term outlook.
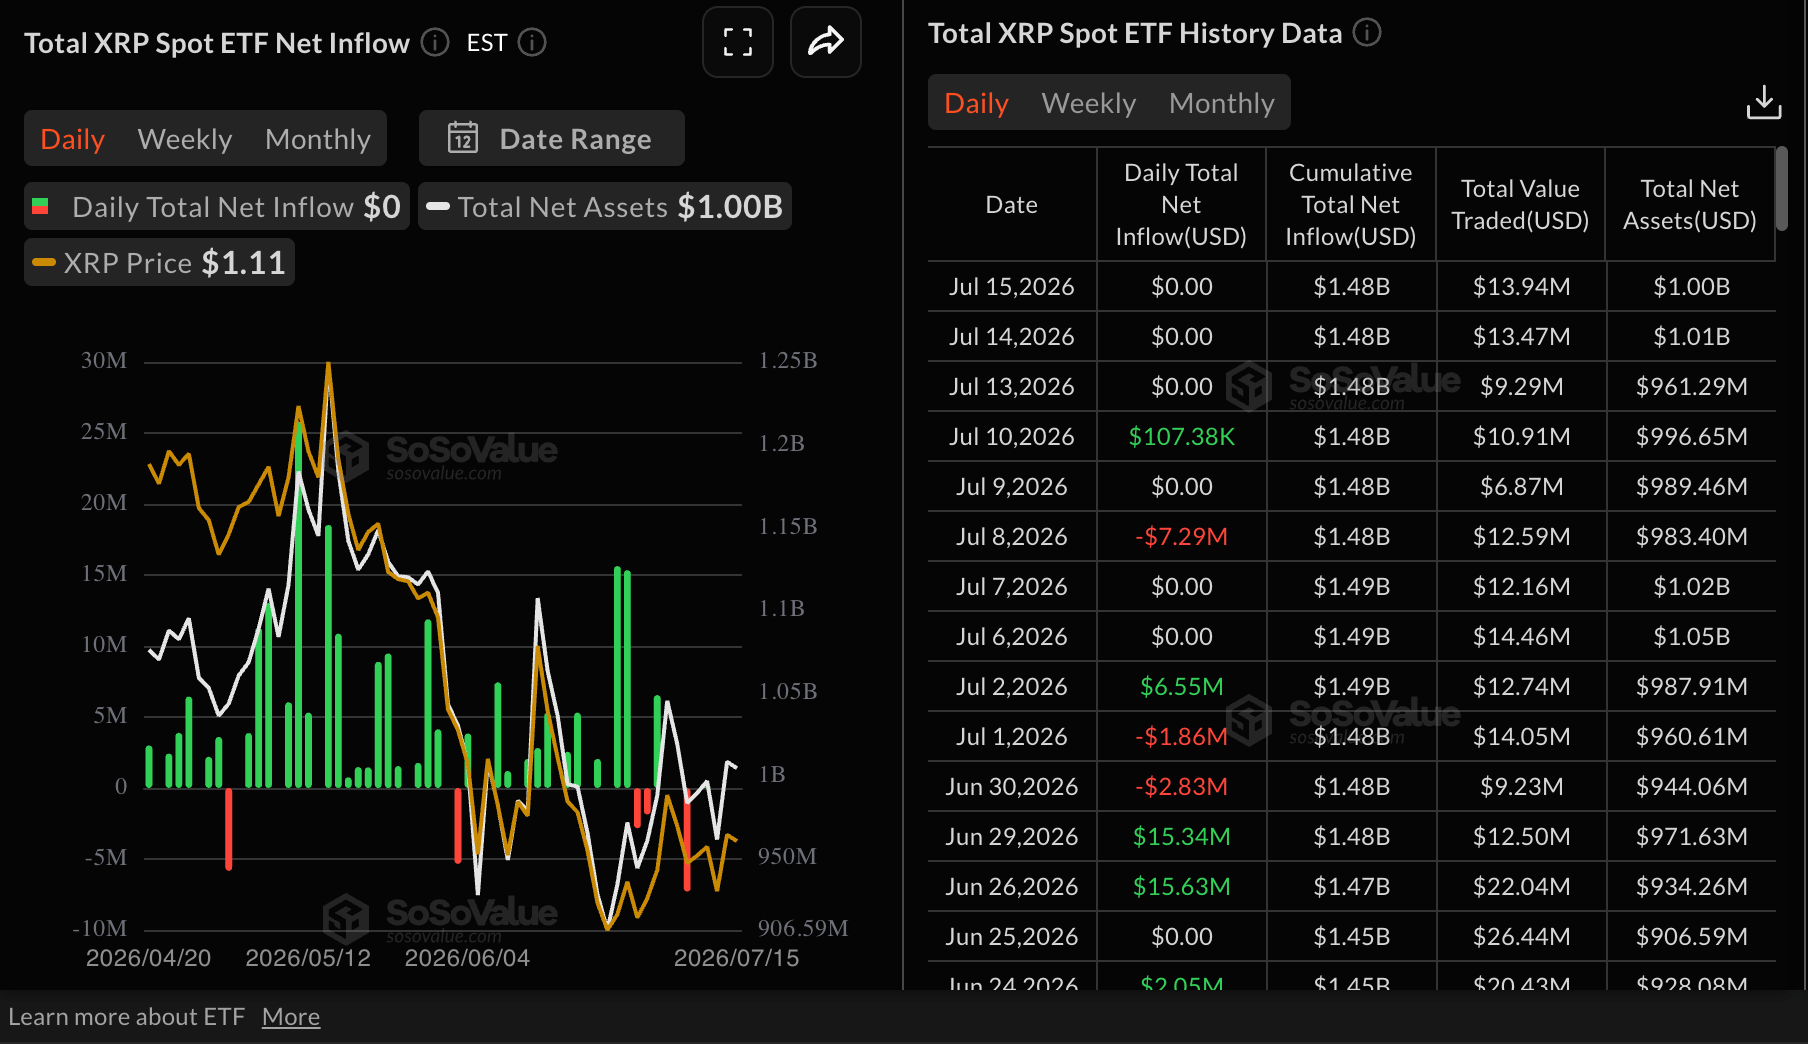
Institutional appetite for XRP spot ETFs continued to wane on Thursday, evidenced by muted trading activity on Monday, Tuesday, Wednesday and Thursday. The most recent inflows of just $107,000 occurred last Friday, while cumulative deposits remain at $1.48 billion and total net assets at $1 billion, underscoring relative diminishing demand from institutional players in the prevailing market environment.
Ripple analysis: XRP stays near key support
XRP trades above $1.10, retaining a bearish near-term bias as price holds below the key Exponential Moving Averages (EMAs), with the 50-day EMA at $1.16 and the 100-day EMA at $1.25 acting as overhead dynamic resistance, well under the longer-term 200-day EMA at $1.46.
The spot price is hovering just above the Bollinger Bands’ middle baseline at $1.10, suggesting only modest near-term support, while the Relative Strength Index (RSI) around 48 keeps momentum neutral and the Moving Average Convergence Divergence (MACD) shows a small positive reading, hinting at a weak recovery attempt that remains structurally capped.
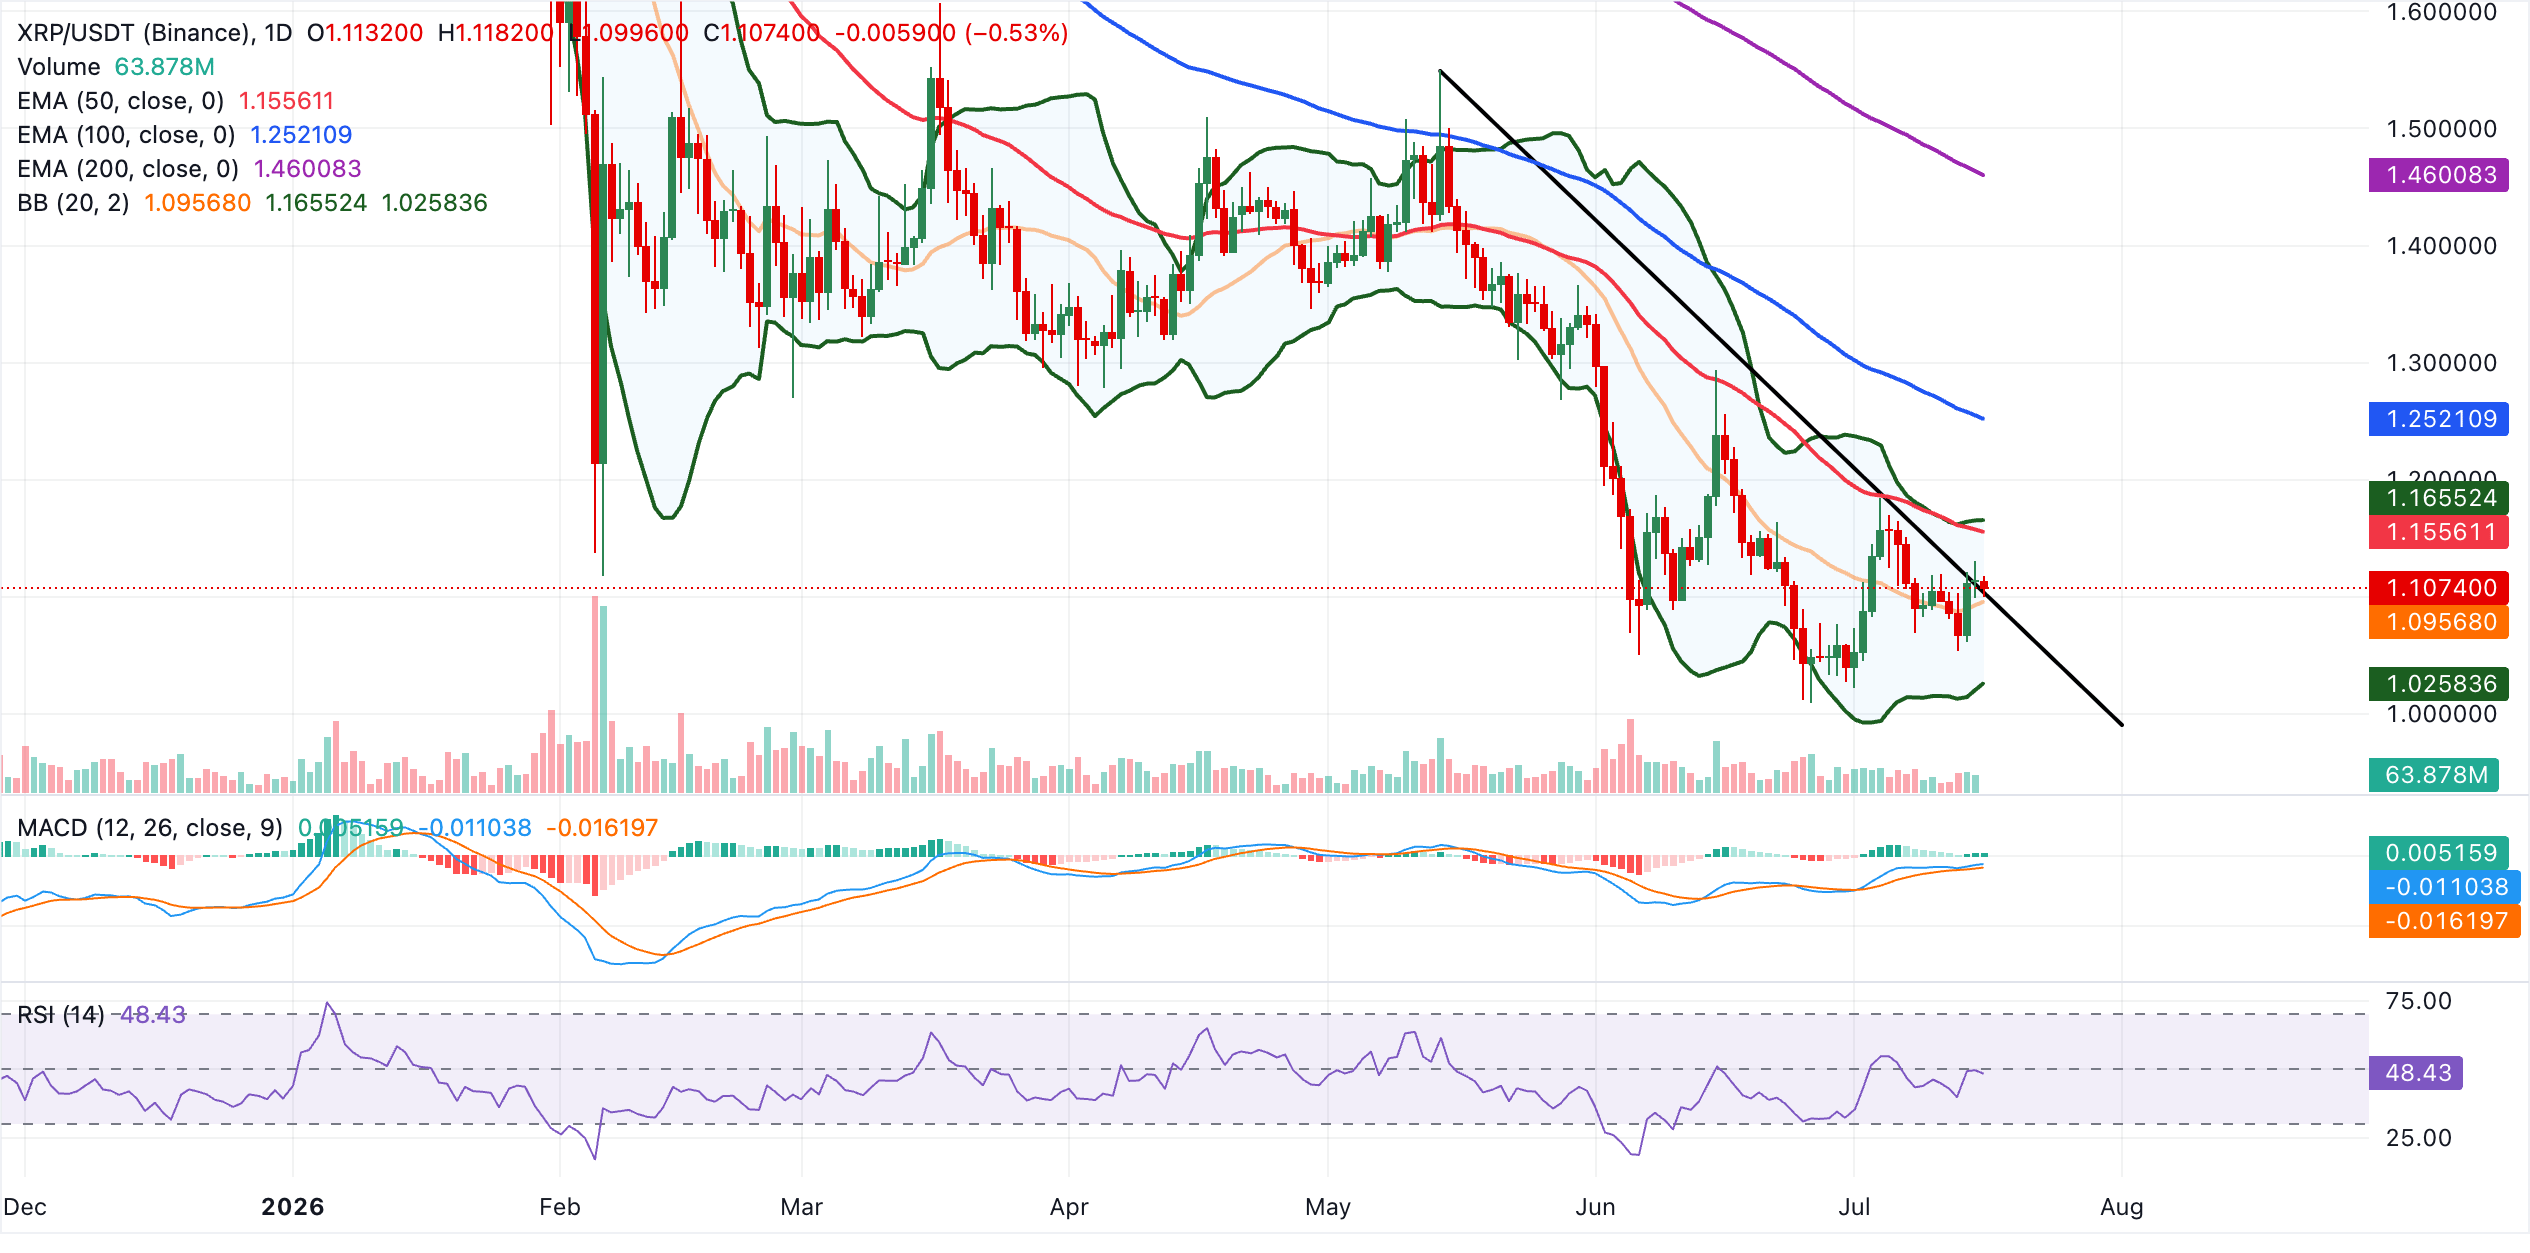
On the topside, initial resistance is seen at the 50-day EMA at $1.16, followed closely by the Bollinger upper band near $1.17, forming a first supply cluster before the 100-day EMA at $1.25 and the 200-day EMA at $1.46 reinforce the broader bearish structure, with the legacy downward trend line anchored at $1.55 marking a far more distant barrier. On the downside, immediate support lies around the former trendline break level at $1.10, ahead of the Bollinger middle band at $1.10, while a deeper slide would expose the lower Bollinger band at $1.03 as the next significant demand zone.
(The technical analysis of this story was written with the help of an AI tool. Know more.)
Open Interest, funding rate FAQs
Higher Open Interest is associated with higher liquidity and new capital inflow to the market. This is considered the equivalent of increase in efficiency and the ongoing trend continues. When Open Interest decreases, it is considered a sign of liquidation in the market, investors are leaving and the overall demand for an asset is on a decline, fueling a bearish sentiment among investors.
Funding fees bridge the difference between spot prices and prices of futures contracts of an asset by increasing liquidation risks faced by traders. A consistently high and positive funding rate implies there is a bullish sentiment among market participants and there is an expectation of a price hike. A consistently negative funding rate for an asset implies a bearish sentiment, indicating that traders expect the cryptocurrency’s price to fall and a bearish trend reversal is likely to occur.














