
Ripple Price Forecast: XRP targets $1.40 on rising capital inflows
작성자 John Isige
수정됨: 20 May 2026


인기 기사

Ripple (XRP) rises above $1.37 at the time of writing on Wednesday, after testing a short-term support at $1.35.
- XRP gains momentum with $1.37 serving as a stepping stone for a potential breakout above $1.40.
- XRP ETFs extend mild inflows for a fourth consecutive day as more capital flows in through derivatives.
- XRP momentum indicators remain fragile, which could limit upside potential in the short to medium term.
Ripple (XRP) rises above $1.37 at the time of writing on Wednesday, after testing a short-term support at $1.35. The rebound follows a rejection XRP suffered at $1.50 in mid-May, triggered largely by macroeconomic uncertainty surrounding rising United States (US) inflation and geopolitical tensions in the Middle East.
Meanwhile, the Federal Reserve (Fed) is set to release the Minutes of April’s policy meeting at 18.00 GMT on Wednesday. Market participants will look for cues on the committee’s hawkish stance and overall policy direction amid hotter-than-expected April inflation data and the prolonged US-Iran conflict, which continues to keep Oil and Gas prices elevated.
Capital inflows could boost XRP outlook
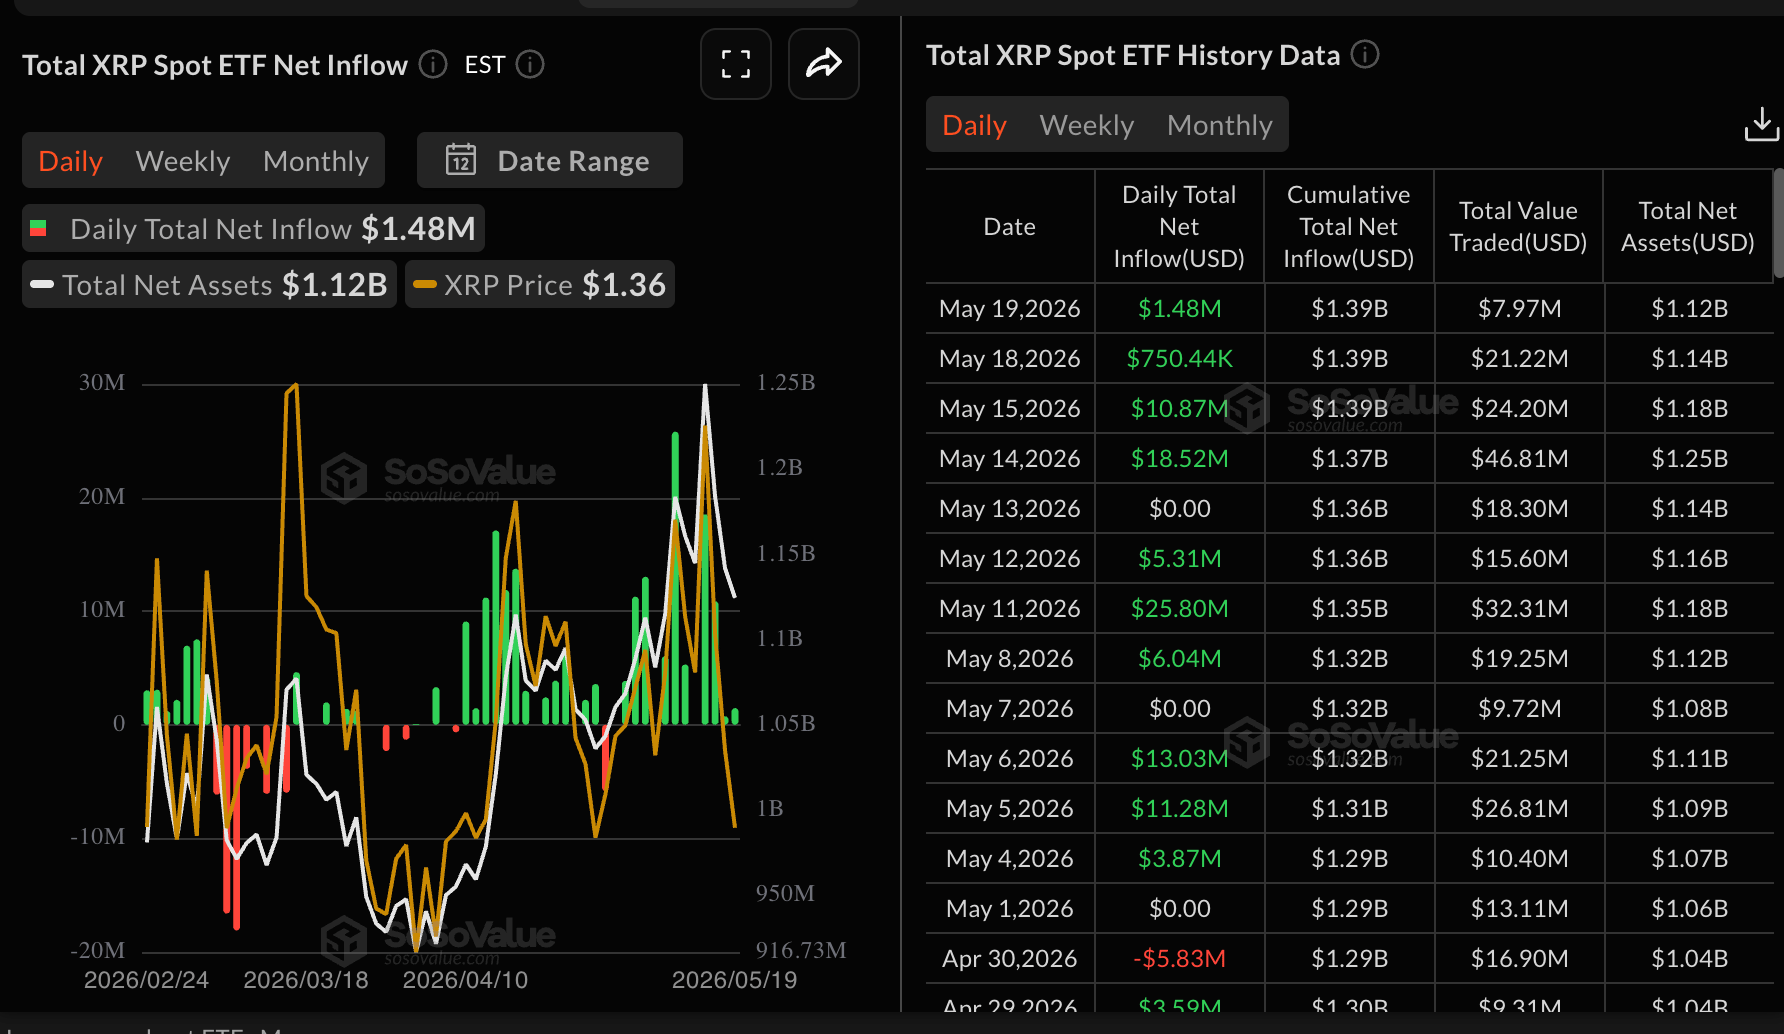
Institutional interest in XRP spot Exchange-Traded Funds (ETFs) has remained relatively steady, with inflows increasing to $1.48 million on Tuesday, from $750,000 the day before. SoSoValue data shows a four-day bullish streak, steadying cumulative inflows at $1.39 billion, while net assets under management average $1.12 billion. The rising demand for spot ETFs is helping shape sentiment positively, raising the odds of a sustained rebound.
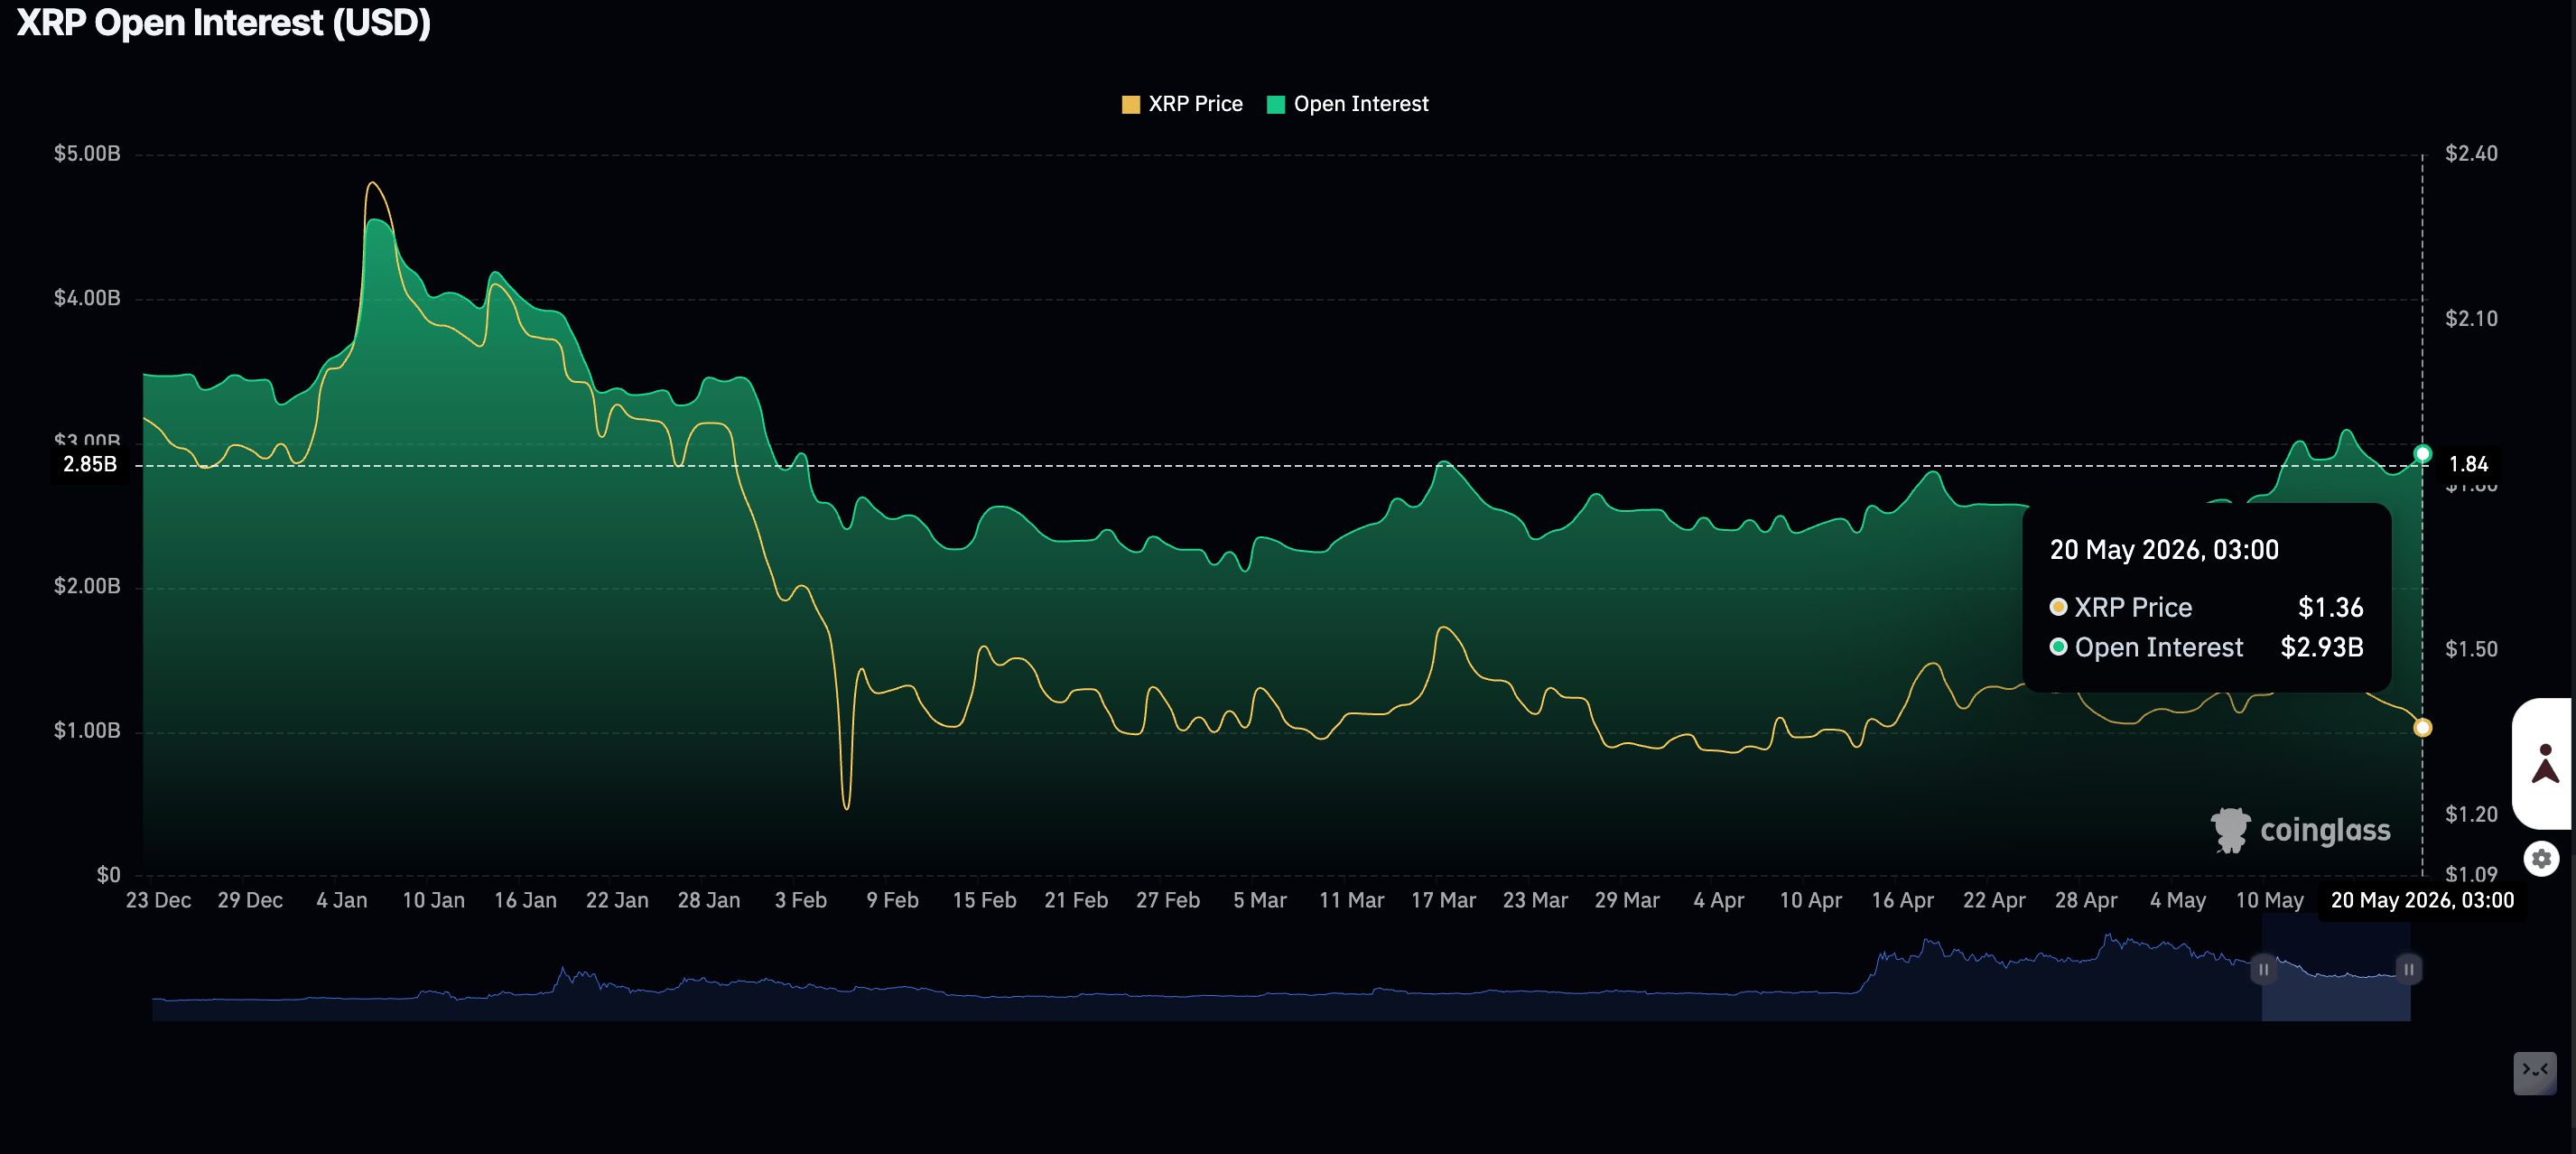
The XRP retail market maintains a positive outlook, with perpetual futures Open Interest (OI) rising to $2.93 billion on Wednesday, up from $2.83 billion the previous day. A sustained increase in the OI could help steady the price of XRP toward the pivotal $1.40 level.
Price Analysis: XRP holds key support as bulls eye recovery
XRP trades at $1.37, keeping a bearish near-term tone as it holds below the 50-day, 100-day and 200-day Exponential Moving Averages (EMAs) at $1.41, $1.48 and $1.69, respectively. The rising trendline support, now turned resistance around $1.40, reinforces a downside bias.
Meanwhile, the Relative Strength Index (RSI) near the low-40s on the daily chart and a negative, slipping Moving Average Convergence Divergence (MACD) histogram hint that bearish momentum is still in play despite some cooling in Money Flow Index (MFI) readings from previously overbought territory.
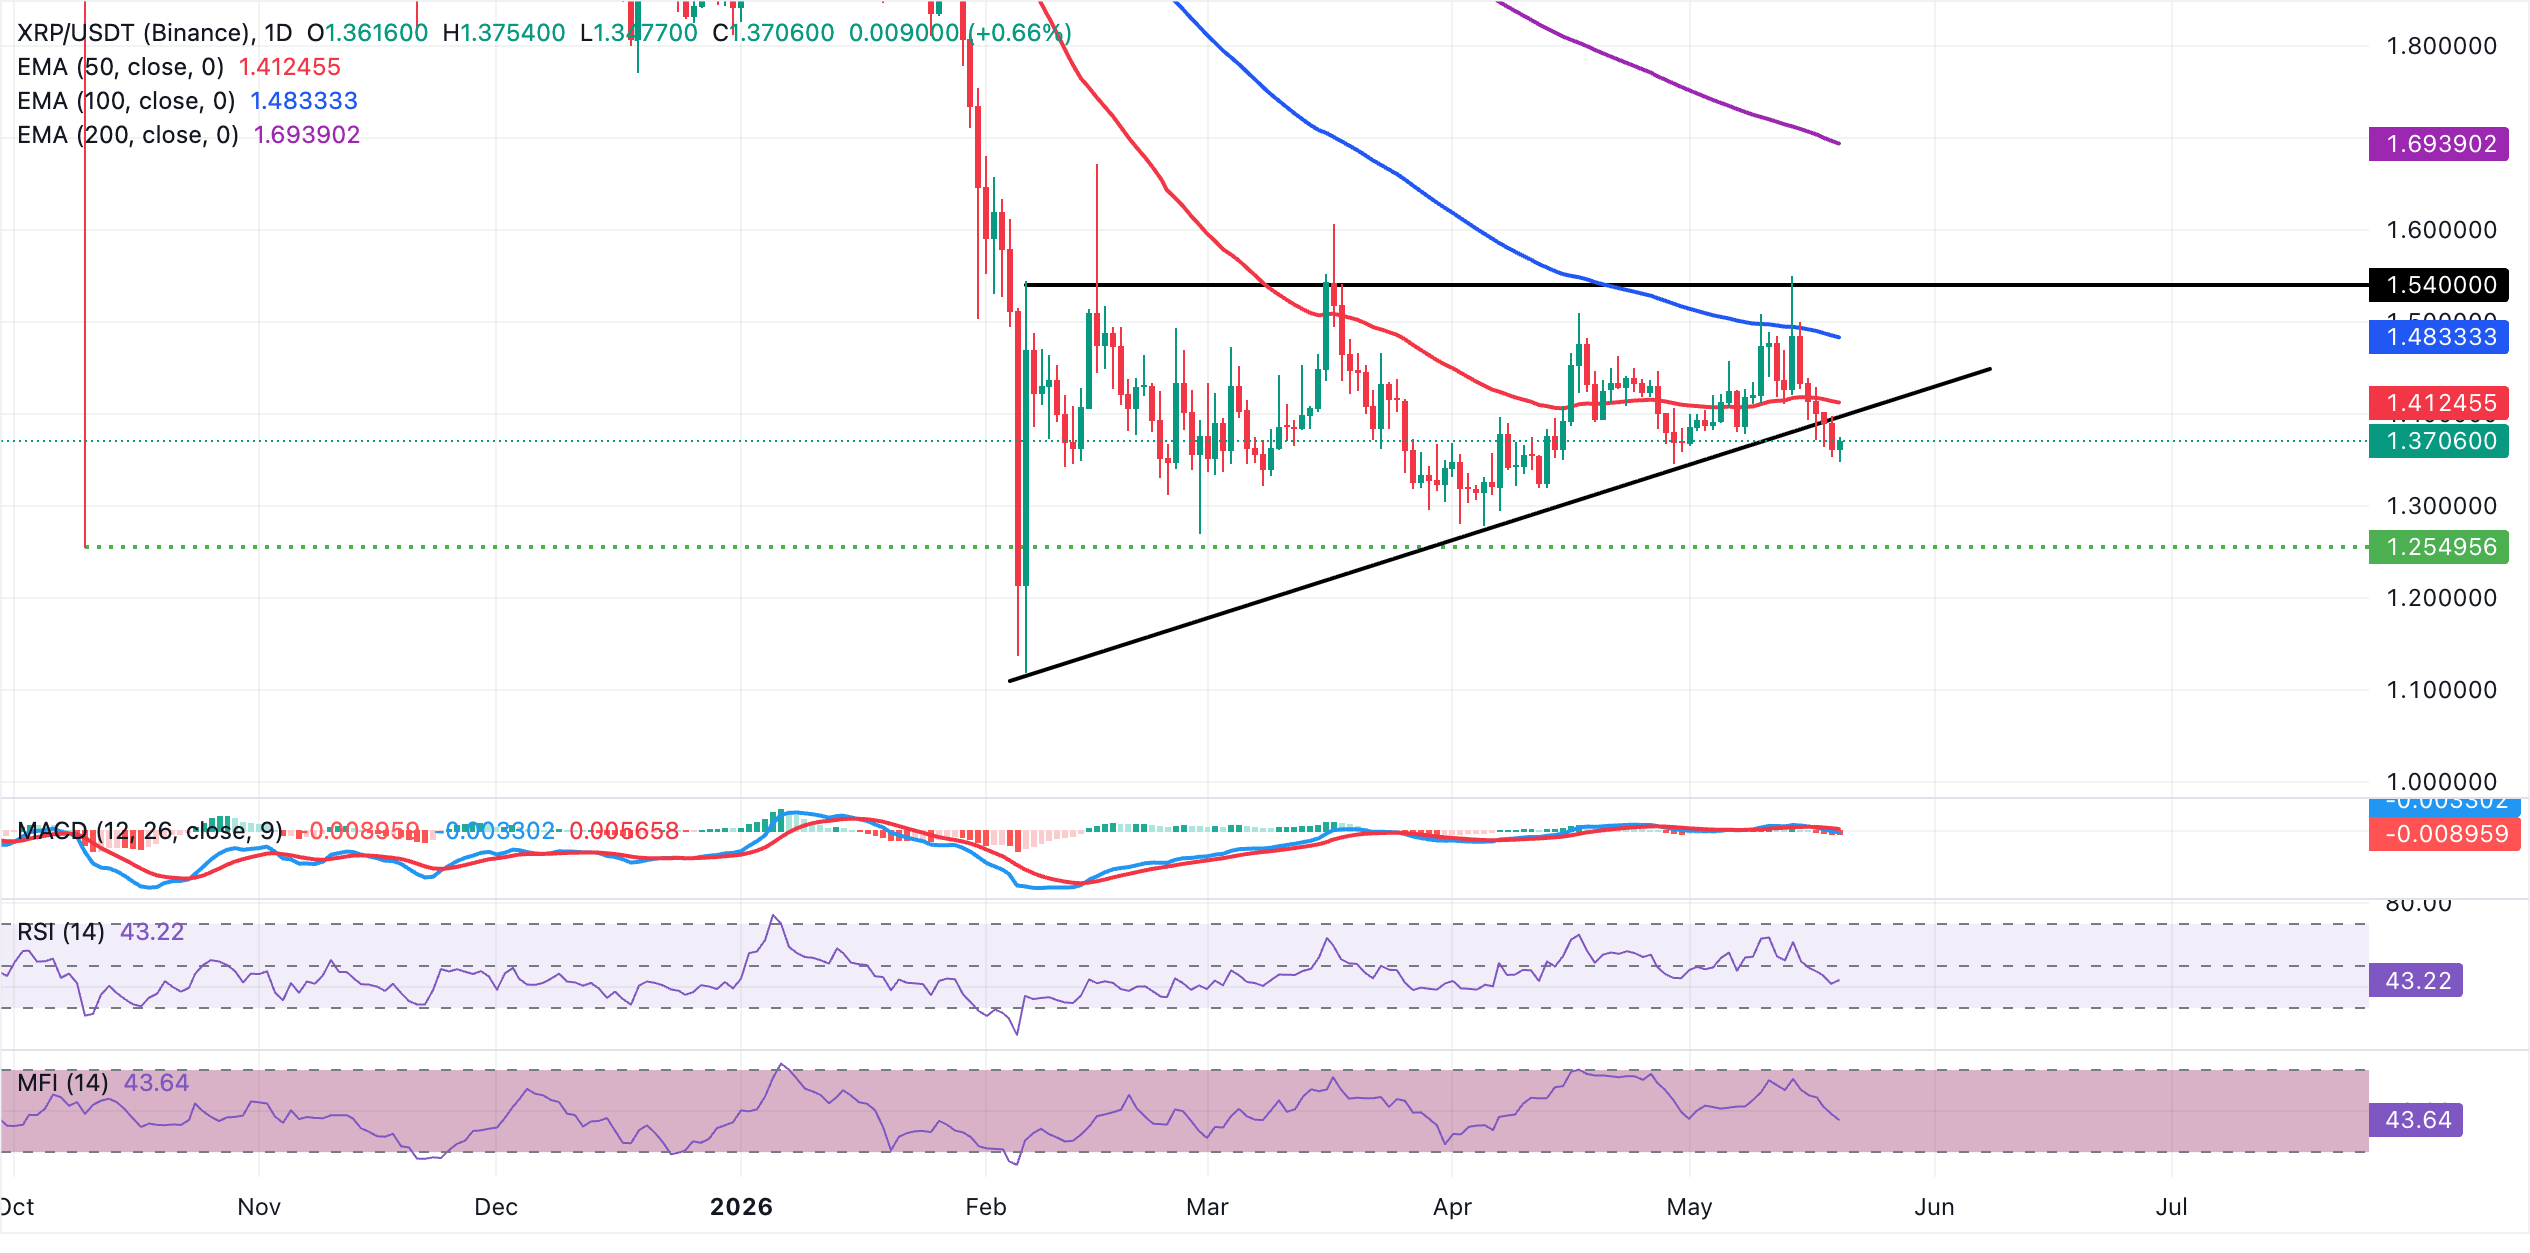
On the topside, initial resistance emerges at the ascending trendline near $1.40, followed by the 50-day EMA around $1.41, where sellers could attempt to reassert control. A sustained recovery above these barriers would be needed to open the way toward the 100-day EMA at $1.48 and the more distant 200-day EMA near $1.69. On the downside, the area at $1.35 provides initial support with extended losses likely to retest the $1.30 demand level.
(The technical analysis of this story was written with the help of an AI tool.)
Open Interest, funding rate FAQs
Higher Open Interest is associated with higher liquidity and new capital inflow to the market. This is considered the equivalent of increase in efficiency and the ongoing trend continues. When Open Interest decreases, it is considered a sign of liquidation in the market, investors are leaving and the overall demand for an asset is on a decline, fueling a bearish sentiment among investors.
Funding fees bridge the difference between spot prices and prices of futures contracts of an asset by increasing liquidation risks faced by traders. A consistently high and positive funding rate implies there is a bullish sentiment among market participants and there is an expectation of a price hike. A consistently negative funding rate for an asset implies a bearish sentiment, indicating that traders expect the cryptocurrency’s price to fall and a bearish trend reversal is likely to occur.

100만 명이 넘는 사용자가 FXStreet를 통해 실시간 시장 데이터, 차트 도구, 전문가 인사이트, 포렉스 뉴스를 이용합니다. 포괄적인 경제 캘린더와 교육 웨비나는 트레이더가 정보를 유지하고 신중한 결정을 내리도록 돕습니다. FXStreet는 바르셀로나 본사와 전 세계 지역에 걸쳐 약 60명의 팀으로 구성되어 있습니다.
더 읽기


