
Shiba Inu Price Analysis: Bearish trend persists as sentiment remains mixed
작성자 Manish Chhetri
게시일: 4 Feb 2026 | 수정일: 4 Feb 2026


인기 기사

Shiba Inu (SHIB) price stabilizes at $0.0000067 at the time of writing on Wednesday, facing rejection around a key resistance zone. On-chain and derivatives data indicate mixed sentiment among traders, further limiting the chances of a price recovery.
- Shiba Inu price steadies on Wednesday, facing resistance at the previously broken weekly level at $0.0000068.
- On-chain data shows mixed sentiment, with increased large orders offset by overheating conditions and growing sell-side dominance.
- Traders should be cautious, as any short-term relief rally appears fragile, as the primary trend remains bearish.
Shiba Inu (SHIB) price stabilizes at $0.0000067 at the time of writing on Wednesday, facing rejection around a key resistance zone. On-chain and derivatives data indicate mixed sentiment among traders, further limiting the chances of a price recovery.
Mixed sentiment among traders caps SHIB’s recovery
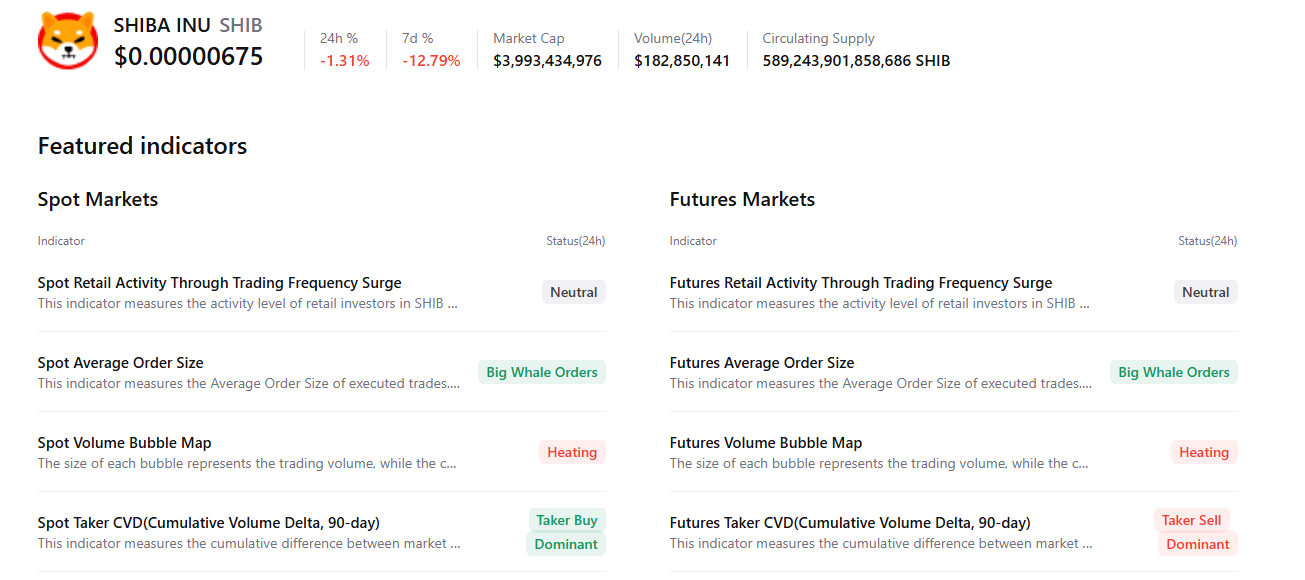
CryptoQuant’s summary data suggests that the dog-themed meme coin sentiment among traders is mixed. While there are large whale orders in both the spot and futures markets, suggesting bullish interest, overheating conditions and rising sell-side dominance indicate that selling pressure remains elevated. This combination suggests indecision among meme coin investors and limits the chances of a sustained recovery.
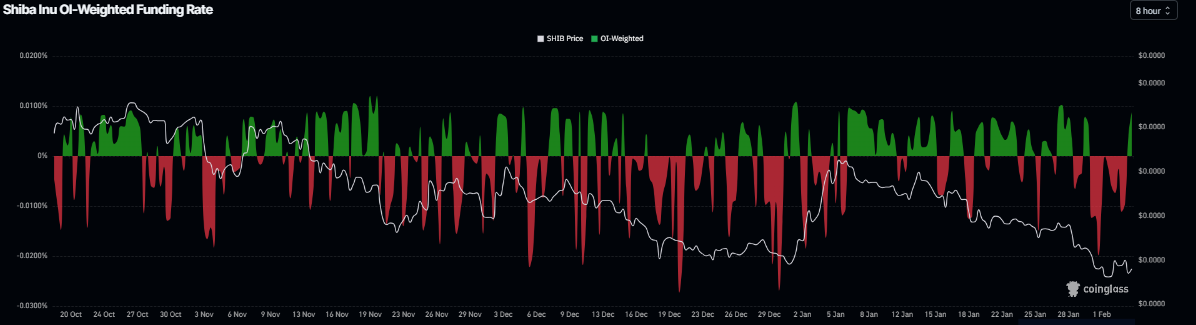
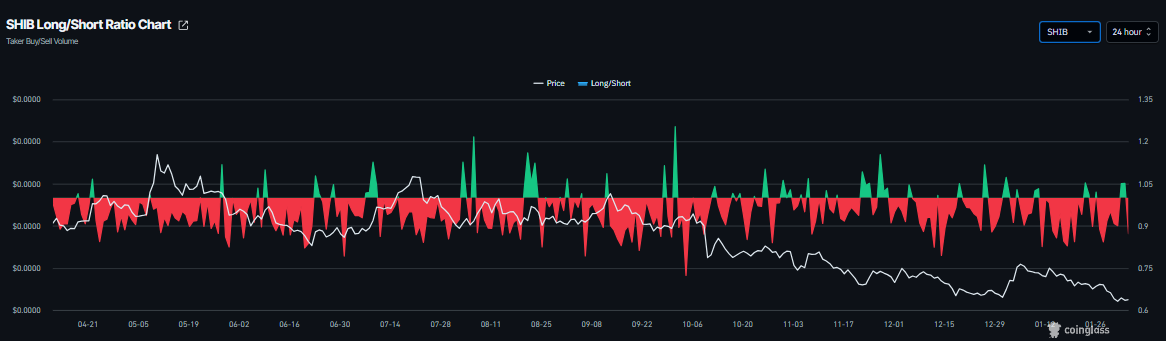
Similarly, the derivatives market is cautious. CoinGlass data shows SHIB’s funding rate flipped positive on Wednesday, currently at 0.0088%, indicating that long positions are paying shorts and hinting at bullish sentiment. However, the long-to-short ratio has slipped to 0.87 on the same period, signaling a rise in short bets. This divergence highlights growing uncertainty in the derivatives market and weakens bullish conviction.
Shiba Inu Price Forecast: SHIB extends losses below October 10 flash-crash low
Shiba Inu price corrected over 11% last week, slipping below the October 10 flash-crash low of $0.0000067 and reaching a level not seen since mid-June 2023. SHIB also closed below the weekly resistance at $0.0000068 and has faced resistance around this level. As of writing on Wednesday, the meme coin is trading at $0.0000067.
If SHIB continues its downward trend, it could extend the correction toward Saturday’s low of $0.0000061. A close below this level could extend the further losses toward the June 10, 2023, low of $0.0000054.
The Relative Strength Index (RSI) is at 35 on the daily chart, recovering slightly above oversold levels, hinting at a potential short-term bounce, though downside risks remain. The Moving Average Convergence Divergence (MACD) indicator showed a bearish crossover on January 17, which remains intact and thus further supports the negative outlook.
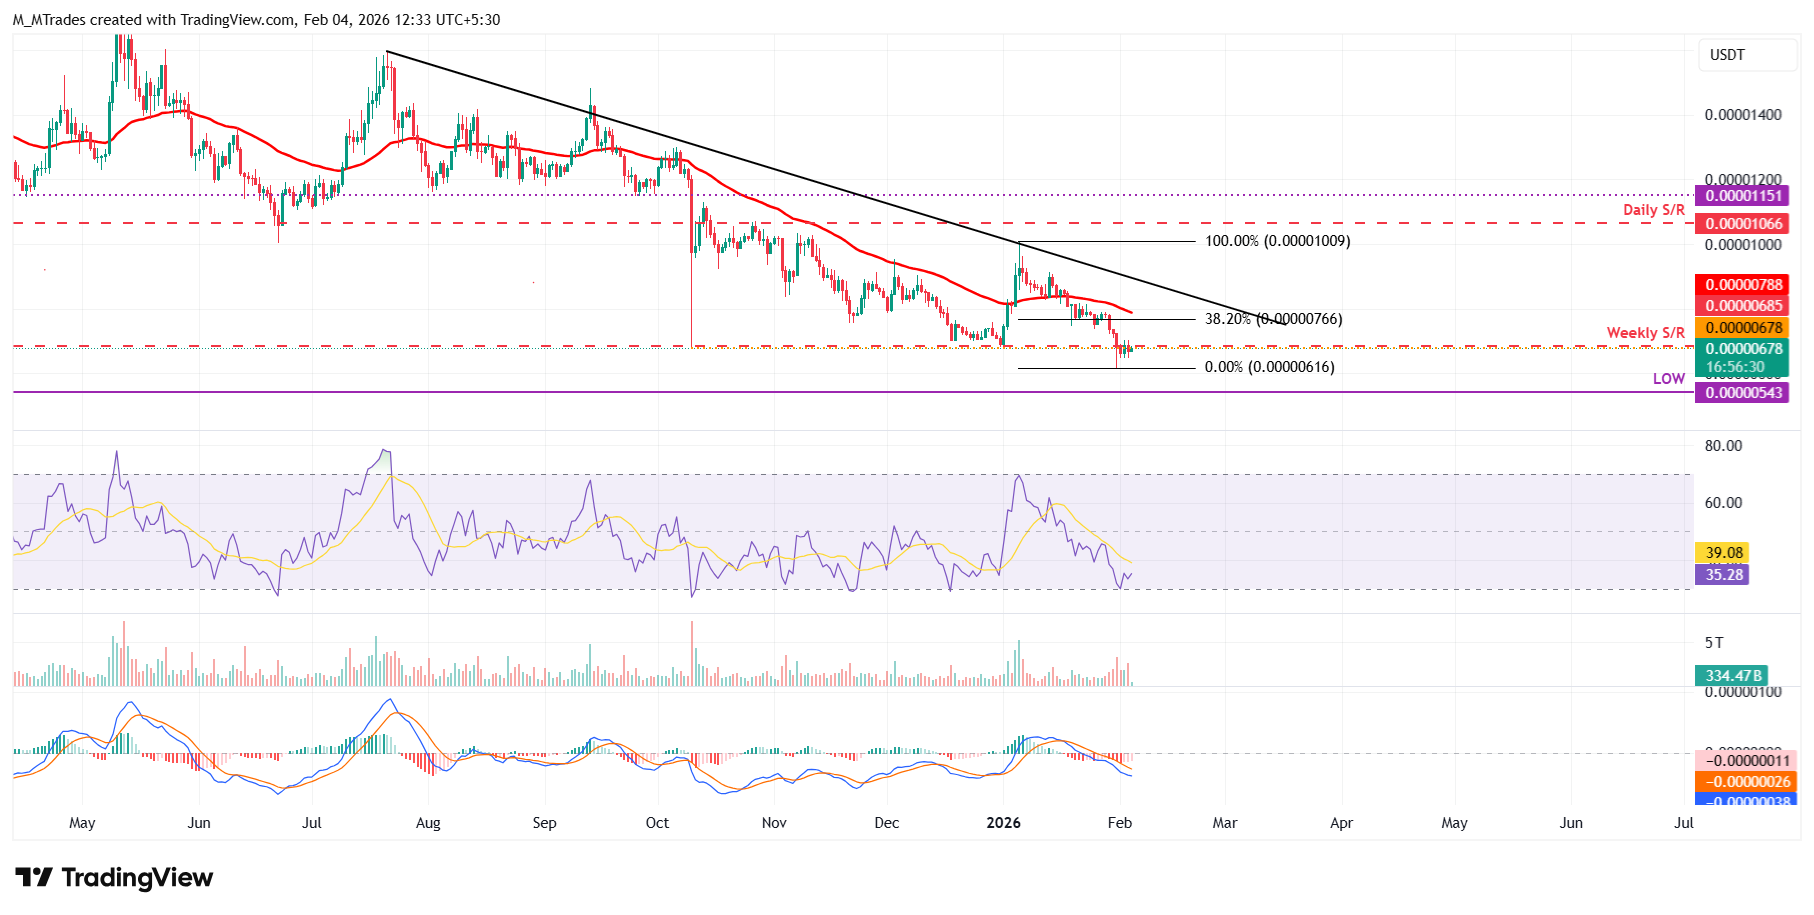
Traders should remain cautious as the primary trend for SHIB remains bearish, so any short-term recovery has a high probability of a dead-cat bounce — a brief price increase within a broader downtrend.
If SHIB recovers, it could extend the advance toward the 50-day Exponential Moving Average (EMA) at $0.0000078.

100만 명이 넘는 사용자가 FXStreet를 통해 실시간 시장 데이터, 차트 도구, 전문가 인사이트, 포렉스 뉴스를 이용합니다. 포괄적인 경제 캘린더와 교육 웨비나는 트레이더가 정보를 유지하고 신중한 결정을 내리도록 돕습니다. FXStreet는 바르셀로나 본사와 전 세계 지역에 걸쳐 약 60명의 팀으로 구성되어 있습니다.
더 읽기


