
Shiba Inu Price Forecast: SHIB bounces higher, eyes key resistance amid burn activity
작성자 Vishal Dixit
게시일: 20 Mar 2026 | 수정일: 20 Mar 2026


인기 기사

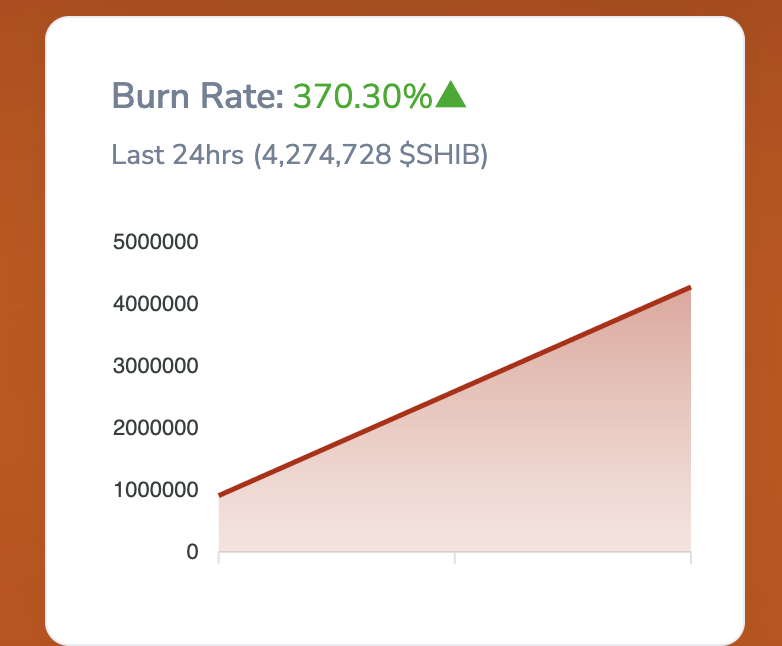
Shiba Inu (SHIB) extends gains nearly 6% at press time on Friday, after a Doji candle formation the previous day. Burning 4.27 million SHIB tokens over the last 24 hours eases overhead pressure on the meme coin, supporting the relief rally.
- Shiba Inu is up 6% on Friday, bouncing off toward a crucial resistance zone.
- The Shibburn tracker shows 4.27 million SHIB tokens burned over the last 24 hours, likely easing downside pressure in the near term.
- Derivatives data reflects risk-on sentiment among traders, anticipating further gains.
Shiba Inu (SHIB) extends gains nearly 6% at press time on Friday, after a Doji candle formation the previous day. Burning 4.27 million SHIB tokens over the last 24 hours eases overhead pressure on the meme coin, supporting the relief rally. The retail sentiment sees a quick bullish shift, boosting SHIB futures Open Interest.
SHIB burn boosts retail, whale demand
Shiba Inu has burned 4.27 million SHIB over the last 24 hours amid efforts to limit inflation and avoid reaching its maximum supply of 999 trillion. This reduction in the circulating supply eases downside pressure on the meme coin, amounting to 410 trillion SHIB tokens.
The derivatives market sentiment shows near-term risk appetite for SHIB aligning with the token burn-driven recovery. CoinGlass data shows that SHIB Open Interest (OI) is up 6.44% over the last 24 hours, reaching $55.69 million, indicating increased positional build-up. The long-to-short ratio was above 1 at 1.0251 on Friday, indicating more long positions are active in SHIB derivatives.
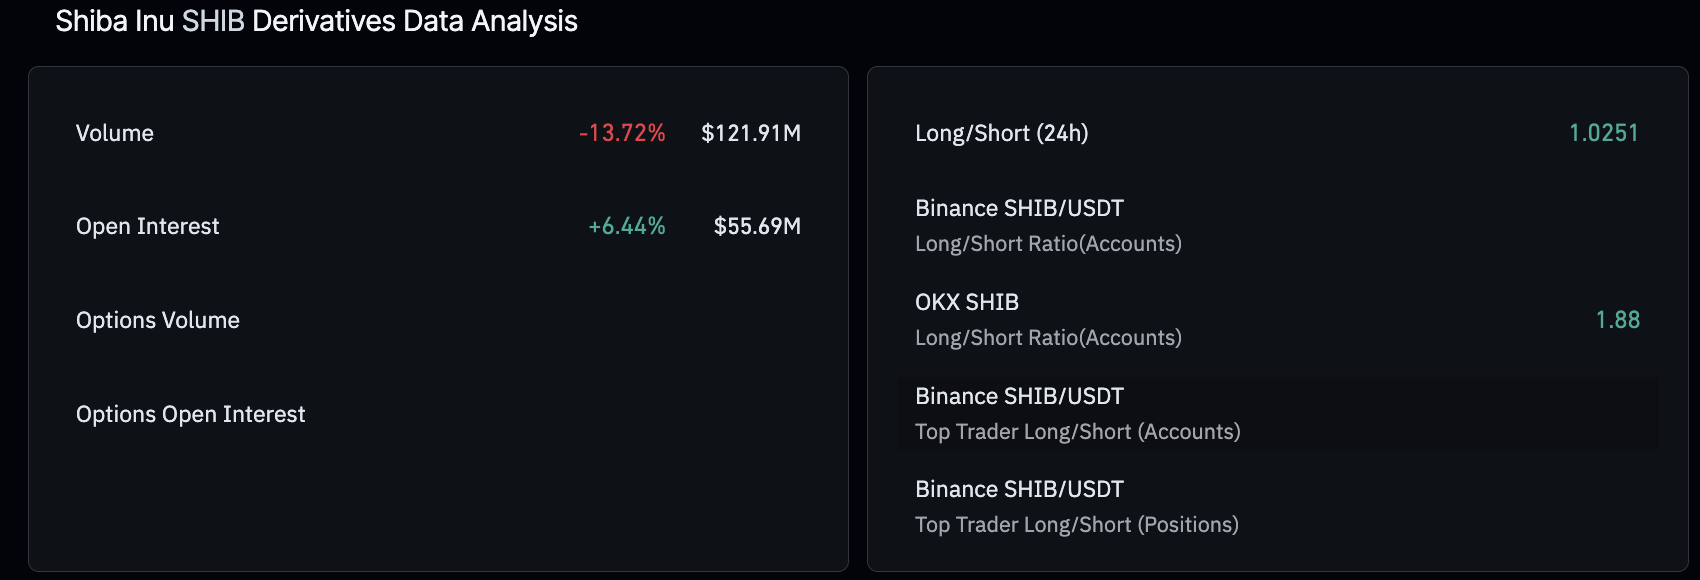
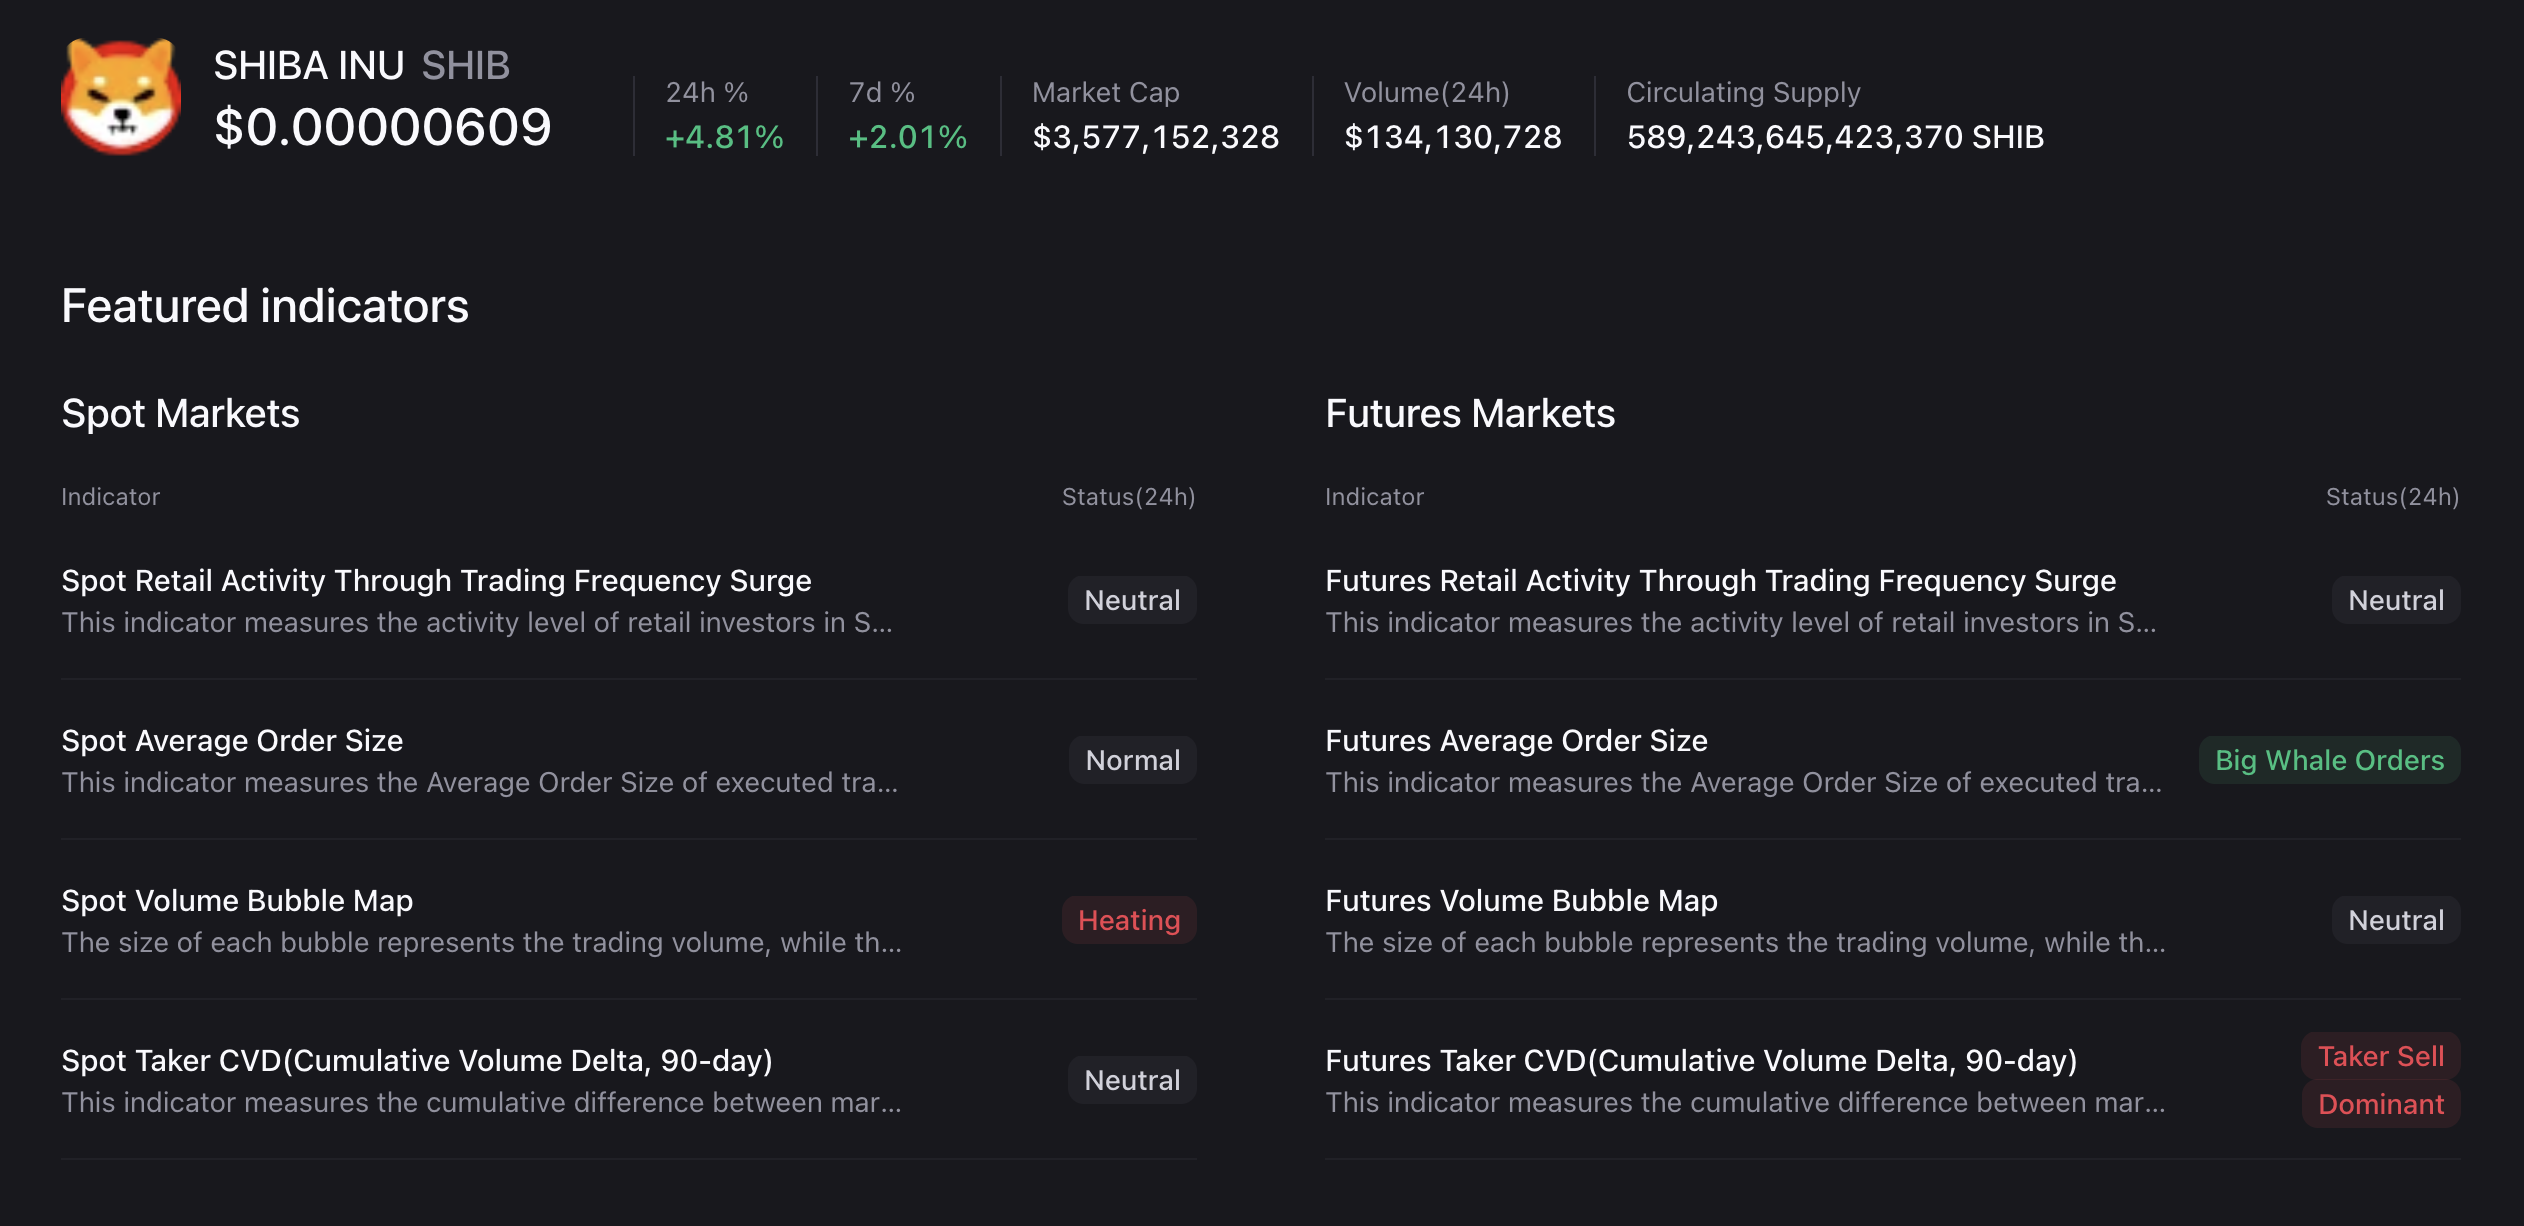
On the other hand, CryptoQuant data shows an increase in the average order size in the futures market, suggesting whale interest in the meme coin.
Technical outlook: Will Shiba Inu's recovery evolve into a breakout rally?
Shiba Inu is up 6% at the time of writing on Friday, extending trading above the $0.00000600 mark. The short-term recovery faces the overhead descending 50-day exponential moving average EMA at $0.00000624, close to a descending resistance line connecting the highs of February 14 and March 16.
The meme coin should secure a daily close above this resistance zone to further extend gains, potentially targeting the R1 pivot point near $0.00000700.
Momentum shows a shift in bullish bias as the selling pressure fades.
The Relative Strength Index (RSI) at 54 rises above the midline with further room on the upside before reaching the overbought zone. Meanwhile, the Moving Average Convergence Divergence (MACD) steadily approaches the zero line while maintaining an upward trend above its signal line. At the same time, the expansion of positive histograms reaffirms the rising bullish momentum.
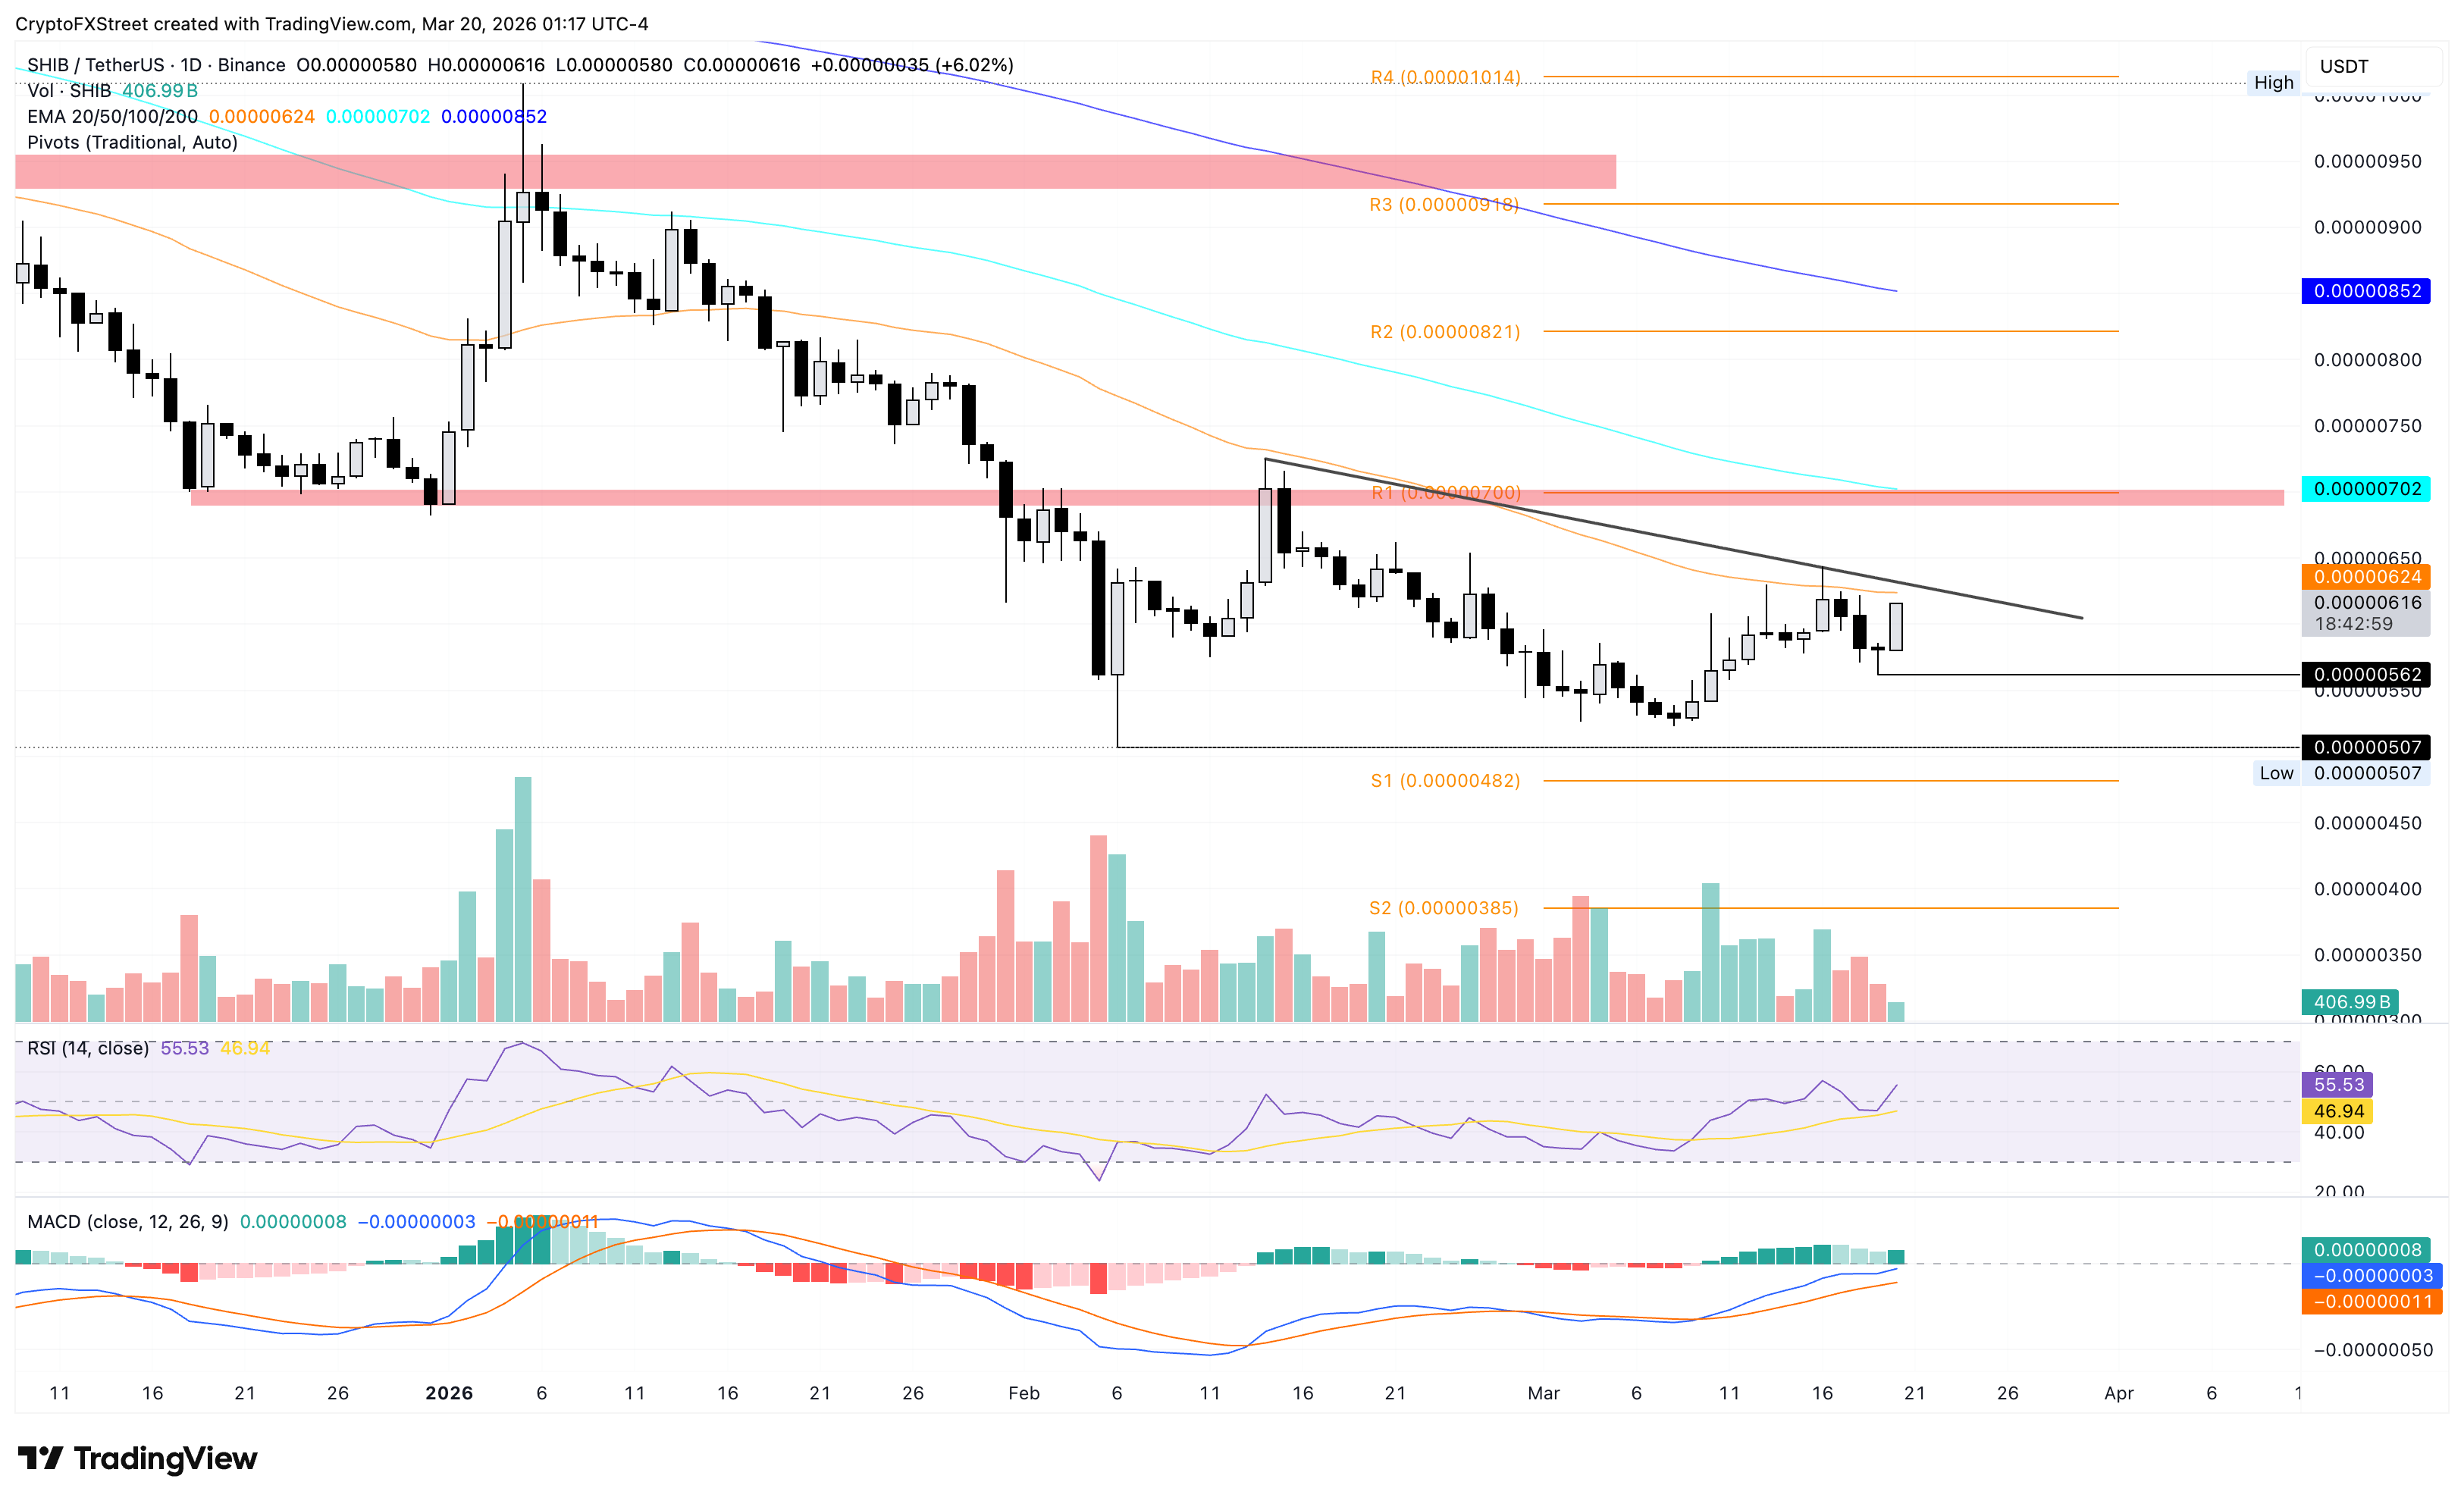
Looking down, a bearish close to the day would likely extend the prevailing three-day decline and put Friday's low of $0.00000562 at risk. A decisive close below this low could test the February 6 low at $0.00000507.

100만 명이 넘는 사용자가 FXStreet를 통해 실시간 시장 데이터, 차트 도구, 전문가 인사이트, 포렉스 뉴스를 이용합니다. 포괄적인 경제 캘린더와 교육 웨비나는 트레이더가 정보를 유지하고 신중한 결정을 내리도록 돕습니다. FXStreet는 바르셀로나 본사와 전 세계 지역에 걸쳐 약 60명의 팀으로 구성되어 있습니다.
더 읽기


