
Shiba Inu Price Forecast: SHIB price eases after breakout as derivatives curb upside
작성자 Manish Chhetri
수정됨: 12 May 2026


인기 기사

Shiba Inu (SHIB) edges slightly down, trading at $0.0000065 on Tuesday after breaking out of its consolidation range last week. Derivatives metrics are capping SHIB’s upside move, while the meme coin’s broader technical structure remains supportive of further upside.
- Shiba Inu price trades slightly lower on Tuesday after breaking out of its consolidation range the previous week.
- Derivatives data caps SHIB upside move as funding rates turn negative and short bets are rising among traders.
- Despite cautious sentiment in derivatives market, the broader technical structure continues to support further gains.
Shiba Inu (SHIB) edges slightly down, trading at $0.0000065 on Tuesday after breaking out of its consolidation range last week. Derivatives metrics are capping SHIB’s upside move, while the meme coin’s broader technical structure remains supportive of further upside. Market participants are now awaiting whether SHIB can sustain its breakout momentum or extend its correction.
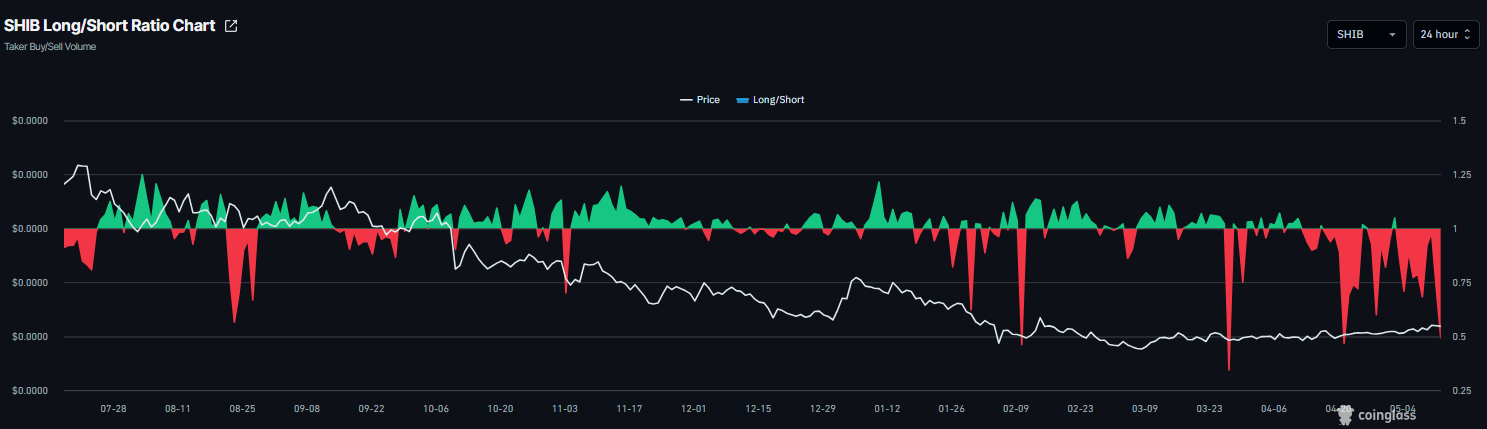
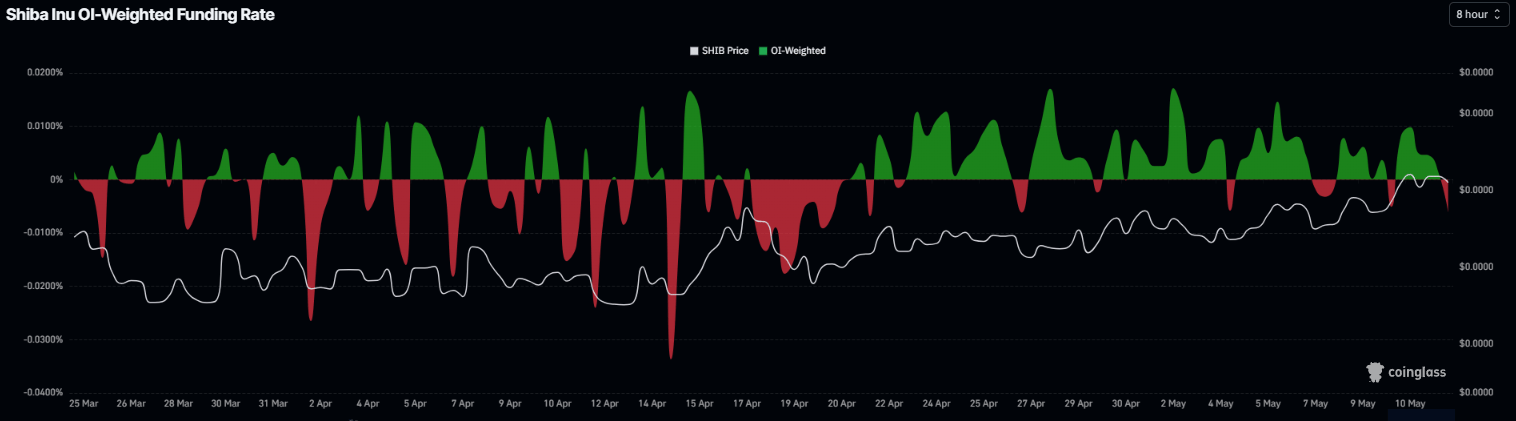
Derivatives metrics cap SHIB upside move
The meme coin’s derivatives metrics show a bearish outlook. CoinGlass’ long-to-short ratio for SHIB read 0.49 on Tuesday, nearing the lowest level over a month. This ratio, being below one, reflects bearish sentiment in the market, as more traders are betting on the asset price to fall.
In addition, the funding rates for Shiba Inu have also turned negative. CoinGlass’ OI-Weighted Funding Rate data for SHIB reads -0.0061% on Tuesday, further fueling the bearish outlook and capping SHIB’s upside move.
Shiba Inu Price Forecast: SHIB breaks above the consolidation range
Shiba Inu price found support around the 100-day Exponential Moving Average (EMA) at $0.0000064 on Monday, but trades in red on Tuesday at around $0.0000065. However, the technical outlook remains constructive as SHIB broke above the upper consolidation boundary at $0.0000063 after 58 days of accumulation and rose slightly the previous week.
If SHIB holds above the 100-day EMA at $0.0000064, it could extend the rally toward the weekly resistance at $0.0000068.
The Relative Strength Index (RSI) on the daily chart reads 61, above the neutral level of 50 and below the overbought threshold, indicating bullish momentum. Moreover, the Moving Average Convergence Divergence (MACD) indicator on the same chart shows green histogram bars, supporting the positive outlook.
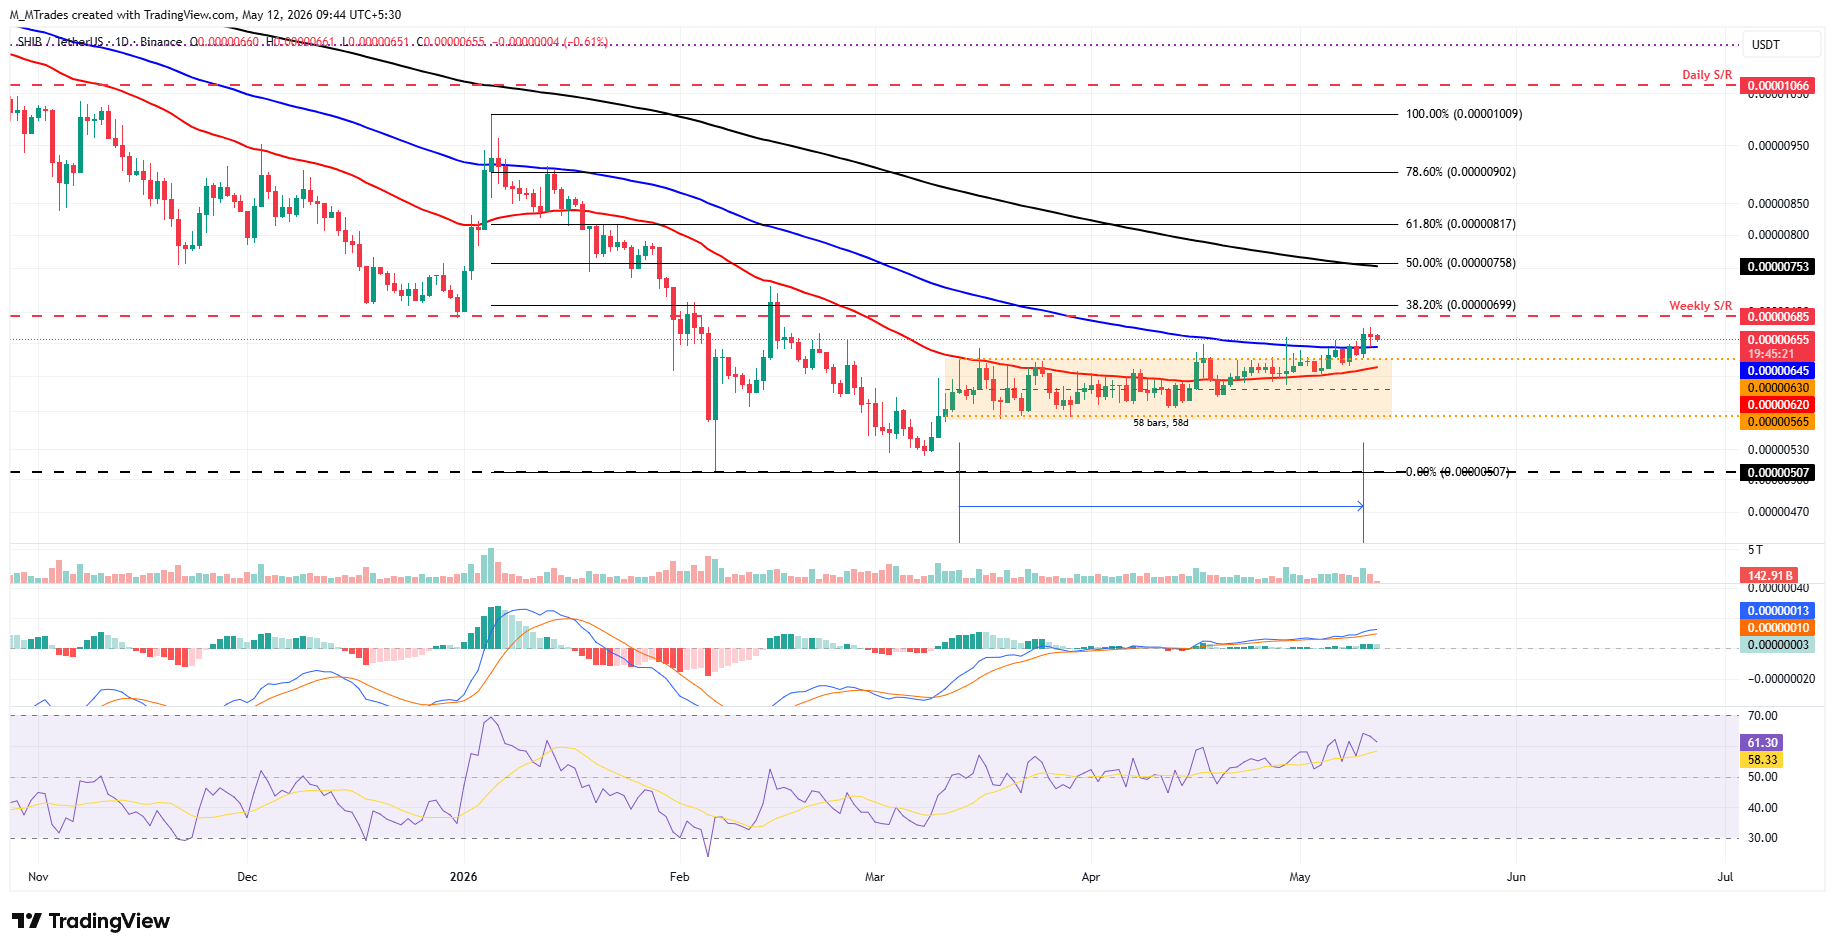
On the other hand, if SHIB faces a correction, it could find support at the upper consolidation boundary at $0.0000063.

100만 명이 넘는 사용자가 FXStreet를 통해 실시간 시장 데이터, 차트 도구, 전문가 인사이트, 포렉스 뉴스를 이용합니다. 포괄적인 경제 캘린더와 교육 웨비나는 트레이더가 정보를 유지하고 신중한 결정을 내리도록 돕습니다. FXStreet는 바르셀로나 본사와 전 세계 지역에 걸쳐 약 60명의 팀으로 구성되어 있습니다.
더 읽기


