
Silver Price Analysis: A bearish crossover looms, sellers eye $70
작성자 Christian Borjon Valencia
수정됨: 7 Apr 2026


인기 기사

Silver price extended its losses on Tuesday as the white metal failed to clear the $75.00 milestone, while the 20-day SMA crossed below the 100-day SMA, an indication that sellers are gaining traction. The XAG/USD trades at $72.24, down 0.69%.
- Silver drops below key SMAs as bearish crossover signals downside risk.
- RSI below 50 confirms strengthening bearish momentum in near term.
- Break under $70 exposes $69.58 and $64.10 support levels.
Silver price extended its losses on Tuesday as the white metal failed to clear the $75.00 milestone, while the 20-day SMA crossed below the 100-day SMA, an indication that sellers are gaining traction. The XAG/USD trades at $72.24, down 0.69%.
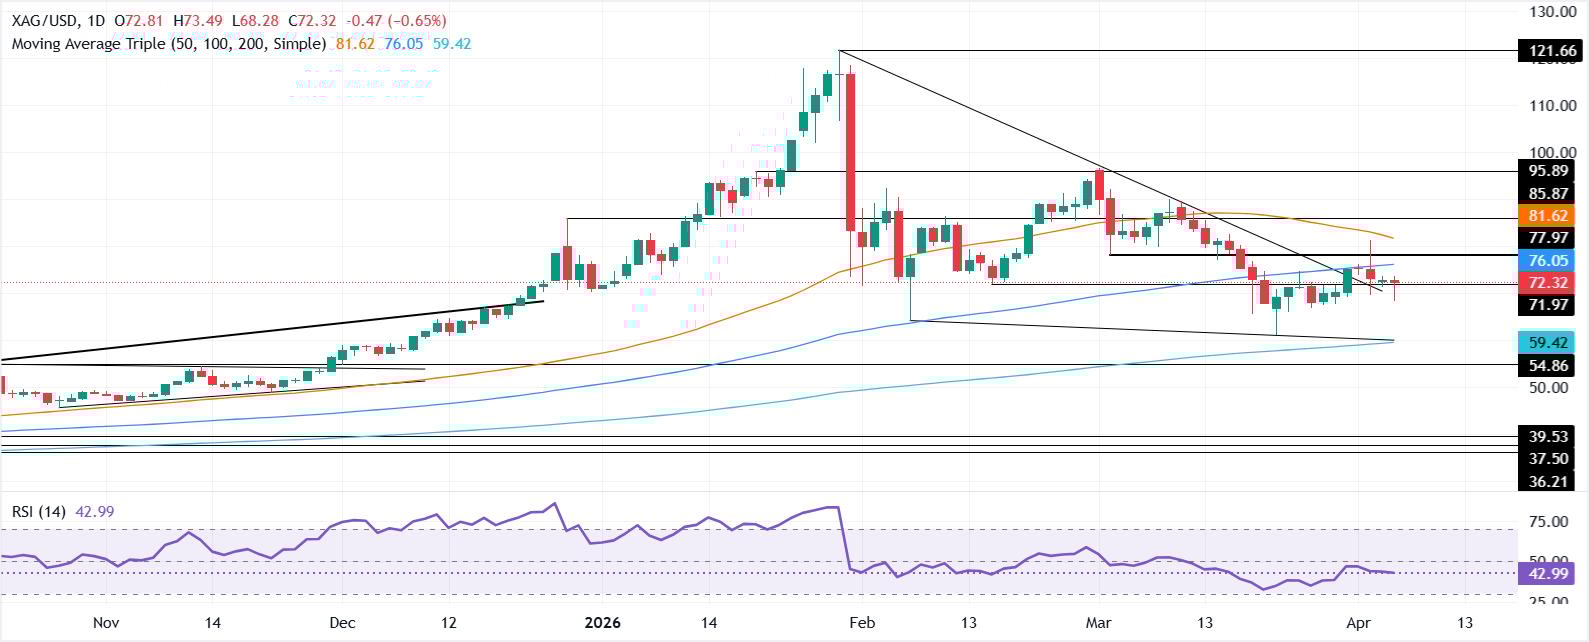
XAG/USD Price Analysis: Technical Outlook
Silver’s fall below the 100-day SMA on April 2, exacerbated a move lower, initially towards $69.58, before recovering some ground, pairing some of its losses, closing the day above $70.00. After this, XAG/USD remains capped on the upside by the $74.00, registering back-to-back days of lower highs, an indication that sellers are in charge.
The Relative Strength Index (RSI) further confirms that bears are strengthening, as the index sits below its 50-neutral level.
For a bearish continuation, bears must clear the $70.00 psychological support. A breach of the latter will expose the April 2 $69.58 level, followed by the February 6 swing low at $64.10.
On the upside, key resistance emerges at the confluence of the 20- and 100-day SMAs around $75.11/14. On further strength, and a move towards the March 3 daily low turned resistance at $77.98 is on the cards.
XAG/USD Price Chart — Daily
Silver FAQs
Silver is a precious metal highly traded among investors. It has been historically used as a store of value and a medium of exchange. Although less popular than Gold, traders may turn to Silver to diversify their investment portfolio, for its intrinsic value or as a potential hedge during high-inflation periods. Investors can buy physical Silver, in coins or in bars, or trade it through vehicles such as Exchange Traded Funds, which track its price on international markets.
Silver prices can move due to a wide range of factors. Geopolitical instability or fears of a deep recession can make Silver price escalate due to its safe-haven status, although to a lesser extent than Gold's. As a yieldless asset, Silver tends to rise with lower interest rates. Its moves also depend on how the US Dollar (USD) behaves as the asset is priced in dollars (XAG/USD). A strong Dollar tends to keep the price of Silver at bay, whereas a weaker Dollar is likely to propel prices up. Other factors such as investment demand, mining supply – Silver is much more abundant than Gold – and recycling rates can also affect prices.
Silver is widely used in industry, particularly in sectors such as electronics or solar energy, as it has one of the highest electric conductivity of all metals – more than Copper and Gold. A surge in demand can increase prices, while a decline tends to lower them. Dynamics in the US, Chinese and Indian economies can also contribute to price swings: for the US and particularly China, their big industrial sectors use Silver in various processes; in India, consumers’ demand for the precious metal for jewellery also plays a key role in setting prices.
Silver prices tend to follow Gold's moves. When Gold prices rise, Silver typically follows suit, as their status as safe-haven assets is similar. The Gold/Silver ratio, which shows the number of ounces of Silver needed to equal the value of one ounce of Gold, may help to determine the relative valuation between both metals. Some investors may consider a high ratio as an indicator that Silver is undervalued, or Gold is overvalued. On the contrary, a low ratio might suggest that Gold is undervalued relative to Silver.

100만 명이 넘는 사용자가 FXStreet를 통해 실시간 시장 데이터, 차트 도구, 전문가 인사이트, 포렉스 뉴스를 이용합니다. 포괄적인 경제 캘린더와 교육 웨비나는 트레이더가 정보를 유지하고 신중한 결정을 내리도록 돕습니다. FXStreet는 바르셀로나 본사와 전 세계 지역에 걸쳐 약 60명의 팀으로 구성되어 있습니다.
더 읽기


