
Silver Price Analysis: Advances but stalls at technical confluence near $75
작성자 Christian Borjon Valencia
수정됨: 24 Apr 2026


인기 기사

Silver price edges up over 0.50% during Friday’s session, after bouncing off a daily low of $73.10. Speculation about a resumption of negotiations between Washington and Tehran is cheered by investors, which pushed US equities higher in tandem with the precious metals segment.
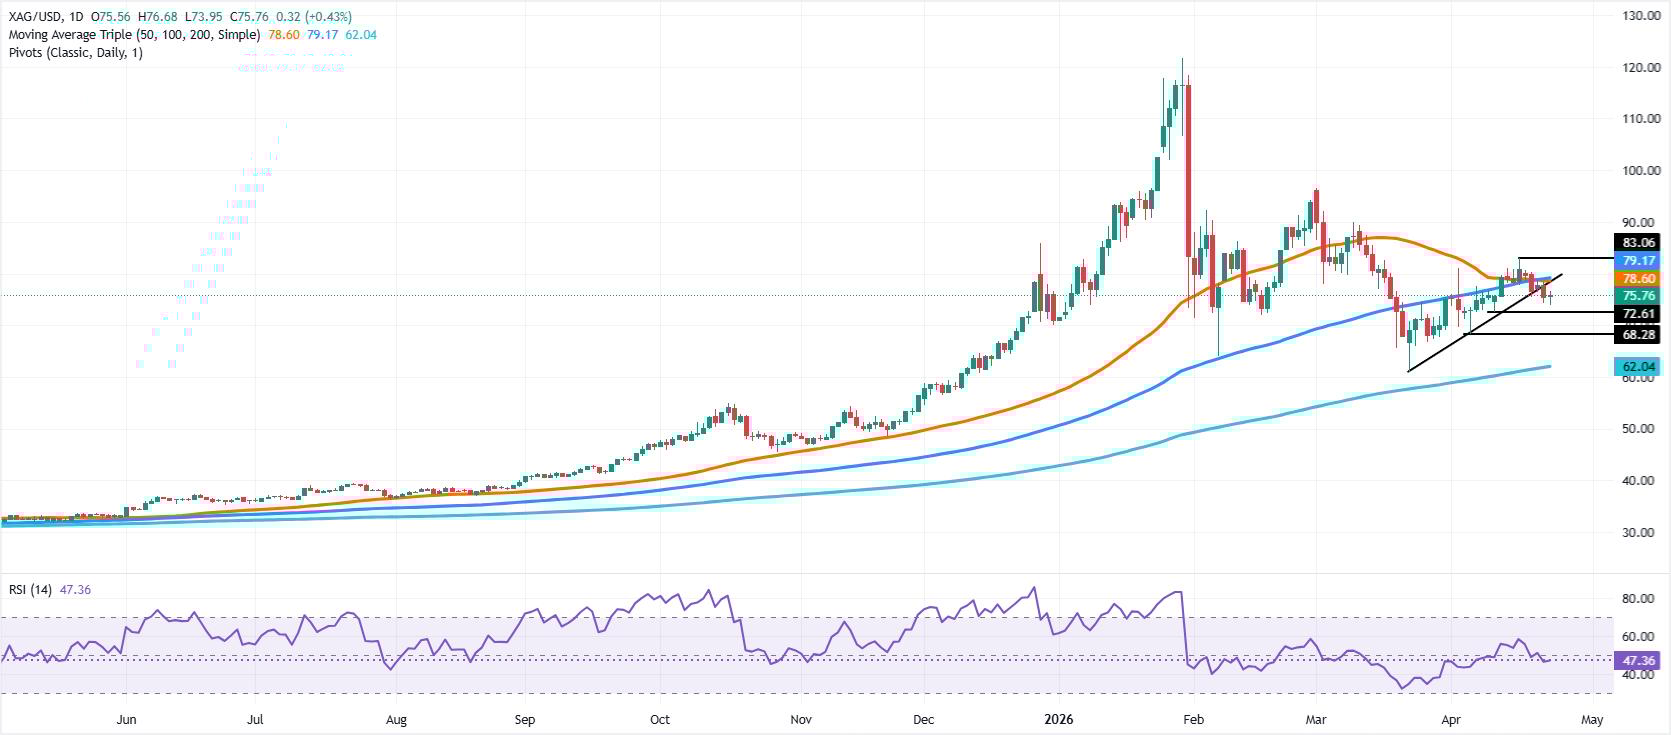
- Silver trades near 20- and 100-day SMA confluence around $75.60.
- RSI remains bearish, suggesting downside risks despite recent rebound.
- Break below $75 exposes $72.61 and $69.82 support levels.
Silver price edges up over 0.50% during Friday’s session, after bouncing off a daily low of $73.10. Speculation about a resumption of negotiations between Washington and Tehran is cheered by investors, which pushed US equities higher in tandem with the precious metals segment. At the time of writing, the XAG/USD trades at $75.83,
XAG/USD Price Analysis: Technical outlook
Technically, Silver is poised to consolidate within the 20- and 100-day Simple Moving Averages (SMAs), both at $75.64. Worth noting that since bottoming at around $61.02 on March 23, the white metal continued to record higher lows, an indication that the uptrend might continue.
However, the latest uptrend impulse peaked at around $83.05, with sellers outweighing buyers, pushing prices towards $75.00.
From a momentum standpoint, further losses are expected as the Relative Strength Index (RSI) is bearish.
For a bearish continuation, sellers must clear the $75.00 mark, followed by the April 13 daily low of $72.61. On further weakness, the next stop would be the April 7 daily log of $69.82.
On the flip side, buyers must reclaim the 100-day SMA, immediately followed by the 50-day SMA at $78.57. Above this confluence, the next resistance is the $80.00 psychological figure.
XAG/USD Price Analysis: Technical outlook
Silver FAQs
Silver is a precious metal highly traded among investors. It has been historically used as a store of value and a medium of exchange. Although less popular than Gold, traders may turn to Silver to diversify their investment portfolio, for its intrinsic value or as a potential hedge during high-inflation periods. Investors can buy physical Silver, in coins or in bars, or trade it through vehicles such as Exchange Traded Funds, which track its price on international markets.
Silver prices can move due to a wide range of factors. Geopolitical instability or fears of a deep recession can make Silver price escalate due to its safe-haven status, although to a lesser extent than Gold's. As a yieldless asset, Silver tends to rise with lower interest rates. Its moves also depend on how the US Dollar (USD) behaves as the asset is priced in dollars (XAG/USD). A strong Dollar tends to keep the price of Silver at bay, whereas a weaker Dollar is likely to propel prices up. Other factors such as investment demand, mining supply – Silver is much more abundant than Gold – and recycling rates can also affect prices.
Silver is widely used in industry, particularly in sectors such as electronics or solar energy, as it has one of the highest electric conductivity of all metals – more than Copper and Gold. A surge in demand can increase prices, while a decline tends to lower them. Dynamics in the US, Chinese and Indian economies can also contribute to price swings: for the US and particularly China, their big industrial sectors use Silver in various processes; in India, consumers’ demand for the precious metal for jewellery also plays a key role in setting prices.
Silver prices tend to follow Gold's moves. When Gold prices rise, Silver typically follows suit, as their status as safe-haven assets is similar. The Gold/Silver ratio, which shows the number of ounces of Silver needed to equal the value of one ounce of Gold, may help to determine the relative valuation between both metals. Some investors may consider a high ratio as an indicator that Silver is undervalued, or Gold is overvalued. On the contrary, a low ratio might suggest that Gold is undervalued relative to Silver.

100만 명이 넘는 사용자가 FXStreet를 통해 실시간 시장 데이터, 차트 도구, 전문가 인사이트, 포렉스 뉴스를 이용합니다. 포괄적인 경제 캘린더와 교육 웨비나는 트레이더가 정보를 유지하고 신중한 결정을 내리도록 돕습니다. FXStreet는 바르셀로나 본사와 전 세계 지역에 걸쳐 약 60명의 팀으로 구성되어 있습니다.
더 읽기


