
Silver Price Forecast: XAG/USD drops 8% as hawkish Fed expectations pressure metals
작성자 Vishal Chaturvedi
수정됨: 15 May 2026


인기 기사
Silver (XAG/USD) plunges on Friday, erasing all gains recorded earlier this week as hawkish Federal Reserve (Fed) expectations push US Treasury yields and the US Dollar (USD) higher.
- Silver tumbles nearly 8% as hawkish Fed expectations boost US Treasury yields and the US Dollar.
- Strong US inflation and resilient consumer spending increase bets on a possible Fed rate hike later this year.
- Technically, XAG/USD remains under pressure below key moving averages, with fading momentum indicators suggesting bears retain near-term control.
Silver (XAG/USD) plunges on Friday, erasing all gains recorded earlier this week as hawkish Federal Reserve (Fed) expectations push US Treasury yields and the US Dollar (USD) higher. At the time of writing, XAG/USD is trading around $76.65, down nearly 8% on the day and hovering near its lowest level in over a week.
The sharp decline comes as the latest US economic data, including stronger-than-expected inflation and resilient consumer spending, strengthened expectations that the Fed could raise interest rates later this year as higher Oil prices linked to ongoing Middle East disruptions continue to fuel inflationary pressures.
According to the CME FedWatch Tool, traders now expect the US central bank to keep interest rates unchanged in the coming months, while pricing in a roughly 42% probability of a rate hike at the December meeting.
Against this backdrop, Silver is expected to maintain a bearish near-term bias as a higher interest rate environment reduces the appeal of non-yielding assets like Silver, while technical indicators suggest bears remain in control.
Technical Analysis:
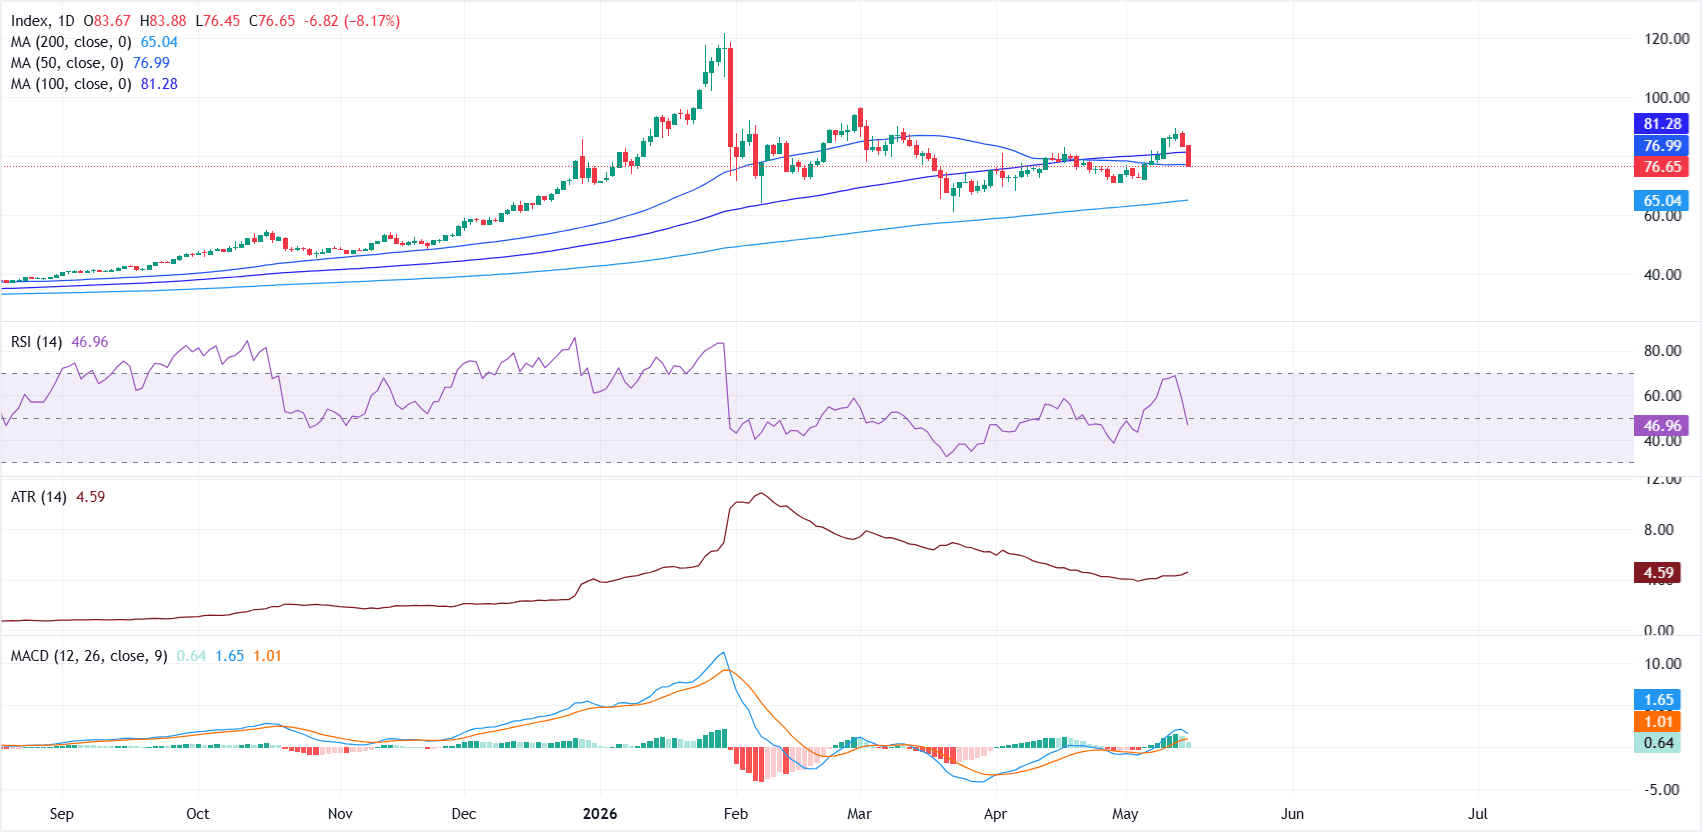
In the daily chart, XAG/USD retains a capped tone as price holds beneath both the 50-day Simple Moving Average (SMA) at $76.99 and the 100-day SMA at $81.28. The 200-day SMA at $65.04 remains well below the market, suggesting the broader trend is still constructive, but the current pullback is pressuring the short- and medium-term structure.
The Relative Strength Index (14) at 47.37 hovers just below the neutral line, while the Moving Average Convergence Divergence (MACD) indicator stays in positive territory around 0.66 but has eased from recent highs, hinting that bullish momentum is waning rather than strengthening.
On the topside, immediate resistance is located at the 50-day SMA at $76.99, where a sustained break would be needed to alleviate near-term downside pressure, with the next bullish hurdle emerging at the 100-day SMA at $81.28.
On the downside, the main structural support is much lower at the 200-day SMA near $65.04, leaving the metal vulnerable to further corrective slippage if sellers maintain control below the overhanging cluster of shorter-term moving averages.
(The technical analysis of this story was written with the help of an AI tool.)
Silver FAQs
Silver is a precious metal highly traded among investors. It has been historically used as a store of value and a medium of exchange. Although less popular than Gold, traders may turn to Silver to diversify their investment portfolio, for its intrinsic value or as a potential hedge during high-inflation periods. Investors can buy physical Silver, in coins or in bars, or trade it through vehicles such as Exchange Traded Funds, which track its price on international markets.
Silver prices can move due to a wide range of factors. Geopolitical instability or fears of a deep recession can make Silver price escalate due to its safe-haven status, although to a lesser extent than Gold's. As a yieldless asset, Silver tends to rise with lower interest rates. Its moves also depend on how the US Dollar (USD) behaves as the asset is priced in dollars (XAG/USD). A strong Dollar tends to keep the price of Silver at bay, whereas a weaker Dollar is likely to propel prices up. Other factors such as investment demand, mining supply – Silver is much more abundant than Gold – and recycling rates can also affect prices.
Silver is widely used in industry, particularly in sectors such as electronics or solar energy, as it has one of the highest electric conductivity of all metals – more than Copper and Gold. A surge in demand can increase prices, while a decline tends to lower them. Dynamics in the US, Chinese and Indian economies can also contribute to price swings: for the US and particularly China, their big industrial sectors use Silver in various processes; in India, consumers’ demand for the precious metal for jewellery also plays a key role in setting prices.
Silver prices tend to follow Gold's moves. When Gold prices rise, Silver typically follows suit, as their status as safe-haven assets is similar. The Gold/Silver ratio, which shows the number of ounces of Silver needed to equal the value of one ounce of Gold, may help to determine the relative valuation between both metals. Some investors may consider a high ratio as an indicator that Silver is undervalued, or Gold is overvalued. On the contrary, a low ratio might suggest that Gold is undervalued relative to Silver.

100만 명이 넘는 사용자가 FXStreet를 통해 실시간 시장 데이터, 차트 도구, 전문가 인사이트, 포렉스 뉴스를 이용합니다. 포괄적인 경제 캘린더와 교육 웨비나는 트레이더가 정보를 유지하고 신중한 결정을 내리도록 돕습니다. FXStreet는 바르셀로나 본사와 전 세계 지역에 걸쳐 약 60명의 팀으로 구성되어 있습니다.
더 읽기


