
Silver Price Forecast: XAG/USD pulls back from $89 as tariff rally fades into profit-taking
작성자 Joshua Gibson
게시일: 25 Feb 2026 | 수정일: 25 Feb 2026


인기 기사

Spot Silver is pulling back on Tuesday after Monday's explosive rally, trading near $87.87. The weekend tariff escalation, which came just hours after the US Supreme Court struck down broader emergency tariffs, fuelled a flight into precious metals.
- Spot Silver retreated on Tuesday after weekend tariff surge drove prices 6% higher
- President Trump's 15% global tariff announcement triggered a sharp safe-haven bid on Monday, with Silver surging over 6% in a single session before profit-taking set in.
- The Silver Institute forecasts a sixth consecutive year of supply deficits in 2026, with industrial demand from artificial intelligence data centres, electric vehicles, and semiconductors offsetting reduced solar panel usage.
Spot Silver is pulling back on Tuesday after Monday's explosive rally, trading near $87.87. The weekend tariff escalation, which came just hours after the US Supreme Court struck down broader emergency tariffs, fuelled a flight into precious metals. Silver's industrial demand profile is adding a structural tailwind, with market deficits of 67 to 120 million ounces expected in 2026 according to the Silver Institute and Metals Focus. The Federal Reserve (Fed) is widely expected to hold rates steady in March, with around 60 basis points of easing priced in for the remainder of the year. US Treasury Secretary Scott Bessent has attributed recent extreme volatility in metals to speculative activity from Chinese traders. Delayed US jobs and Consumer Price Index (CPI) data, along with multiple Fed speakers this week, will be key for the near-term precious metals outlook.
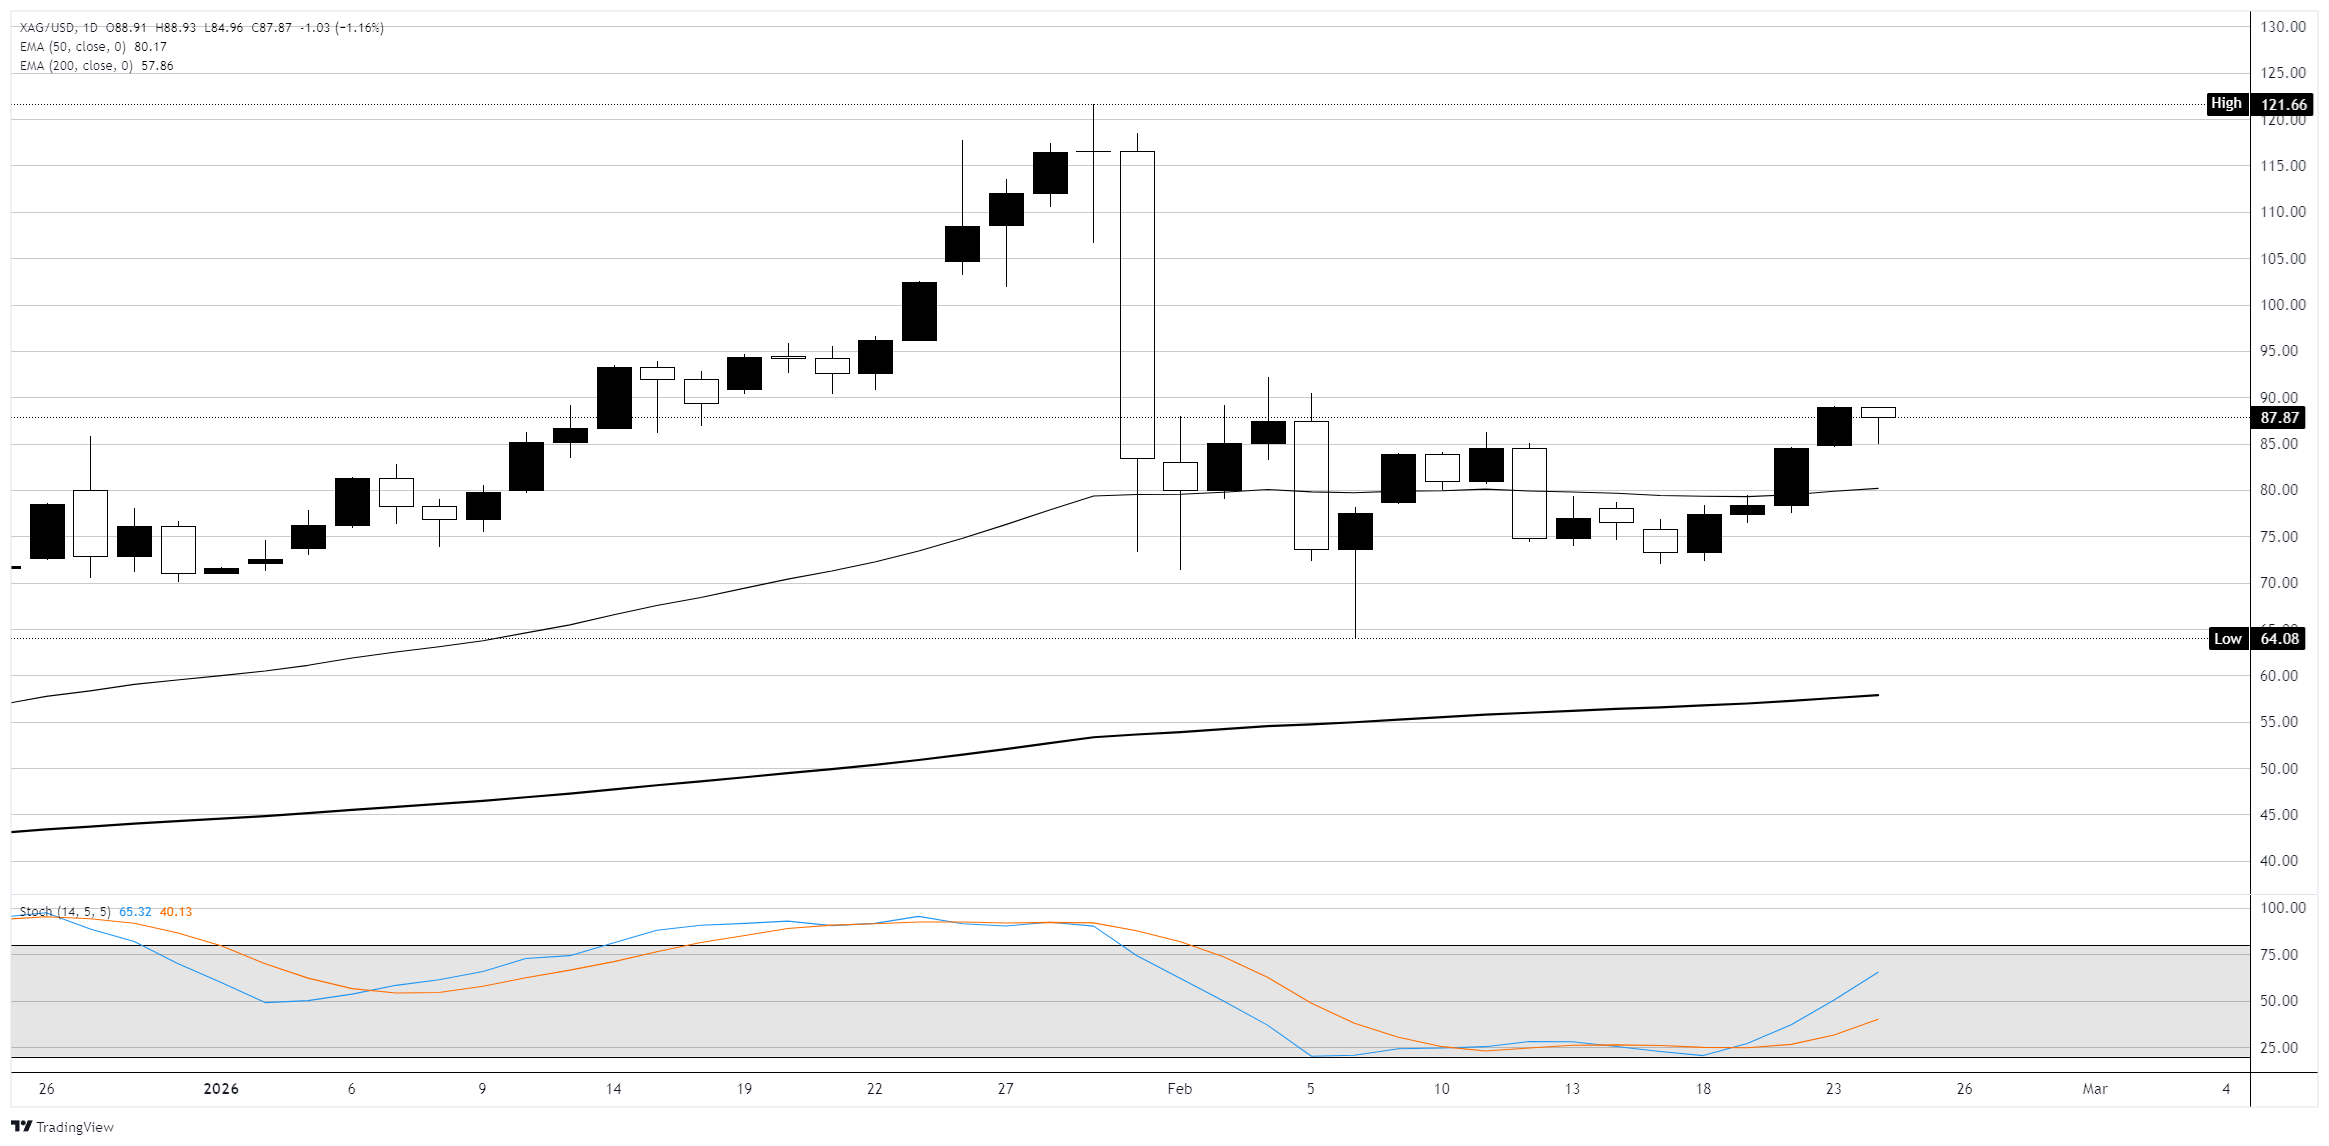
Sharp reversal candle at $87.87 as Stochastic crosses bullish from midrange
On the daily chart, XAG/USD fell around 1% on Tuesday, pumping the brakes following Monday's surge that saw prices spike from the mid-$80s. Despite holding relatively steady, Spot Silver explored the bearish side through early trading, testing $85.00, suggesting buyers stepped in on the dip. Price is holding well above the rising 50-day Exponential Moving Average (EMA) near $80.20 and the 200-day EMA near $57.85, confirming the broader bullish trend that has been in place since the $60.80 swing low. The Stochastic Oscillator has crossed bullish from the midrange area, pointing to recovering momentum after the sharp February correction from the all-time high of $121.66.
The pair has been consolidating roughly between $75 and $90 since early February following that historic selloff. Immediate resistance sits at $90, with the $92 to $93 zone above; a break higher would open the path toward $100. Support rests at the $85 area, followed by $80 near the 50-day EMA; a failure there would risk a deeper retracement toward $75.
XAG/USD daily chart
Silver FAQs
Silver is a precious metal highly traded among investors. It has been historically used as a store of value and a medium of exchange. Although less popular than Gold, traders may turn to Silver to diversify their investment portfolio, for its intrinsic value or as a potential hedge during high-inflation periods. Investors can buy physical Silver, in coins or in bars, or trade it through vehicles such as Exchange Traded Funds, which track its price on international markets.
Silver prices can move due to a wide range of factors. Geopolitical instability or fears of a deep recession can make Silver price escalate due to its safe-haven status, although to a lesser extent than Gold's. As a yieldless asset, Silver tends to rise with lower interest rates. Its moves also depend on how the US Dollar (USD) behaves as the asset is priced in dollars (XAG/USD). A strong Dollar tends to keep the price of Silver at bay, whereas a weaker Dollar is likely to propel prices up. Other factors such as investment demand, mining supply – Silver is much more abundant than Gold – and recycling rates can also affect prices.
Silver is widely used in industry, particularly in sectors such as electronics or solar energy, as it has one of the highest electric conductivity of all metals – more than Copper and Gold. A surge in demand can increase prices, while a decline tends to lower them. Dynamics in the US, Chinese and Indian economies can also contribute to price swings: for the US and particularly China, their big industrial sectors use Silver in various processes; in India, consumers’ demand for the precious metal for jewellery also plays a key role in setting prices.
Silver prices tend to follow Gold's moves. When Gold prices rise, Silver typically follows suit, as their status as safe-haven assets is similar. The Gold/Silver ratio, which shows the number of ounces of Silver needed to equal the value of one ounce of Gold, may help to determine the relative valuation between both metals. Some investors may consider a high ratio as an indicator that Silver is undervalued, or Gold is overvalued. On the contrary, a low ratio might suggest that Gold is undervalued relative to Silver.

100만 명이 넘는 사용자가 FXStreet를 통해 실시간 시장 데이터, 차트 도구, 전문가 인사이트, 포렉스 뉴스를 이용합니다. 포괄적인 경제 캘린더와 교육 웨비나는 트레이더가 정보를 유지하고 신중한 결정을 내리도록 돕습니다. FXStreet는 바르셀로나 본사와 전 세계 지역에 걸쳐 약 60명의 팀으로 구성되어 있습니다.
더 읽기


