
Silver Price Forecast: XAG/USD struggles below medium-term SMAs, bearish tone intact
작성자 Vishal Chaturvedi
수정됨: 24 Apr 2026


인기 기사

Silver (XAG/USD) trades flat on Friday, lacking clear direction as upside remains capped by Oil-driven inflation linked to ongoing US-Iran tensions, which have raised expectations of a prolonged higher interest rate environment.
- Silver trades flat near $75.50 on Friday, set for first weekly loss in five weeks
- Oil-driven inflation fears reinforce higher interest rate expectations, weighing on the non-yielding metal.
- Technically, XAG/USD remains below the 50- and 100-day SMAs, keeping upside capped.
Silver (XAG/USD) trades flat on Friday, lacking clear direction as upside remains capped by Oil-driven inflation linked to ongoing US-Iran tensions, which have raised expectations of a prolonged higher interest rate environment.
At the time of writing, XAG/USD is trading around $75.52 after hitting an intraday low of $73.95, down over 5% so far this week, pressured by a stronger US Dollar (USD) and firm Treasury yields, as stalled US-Iran peace talks and rising tensions in the Strait of Hormuz push Oil prices higher.
Price action remains driven by US-Iran headlines and interest rate expectations, with the current geopolitical backdrop keeping Silver tilted to the downside in the near term, with technical indicators also pointing to continued weakness.
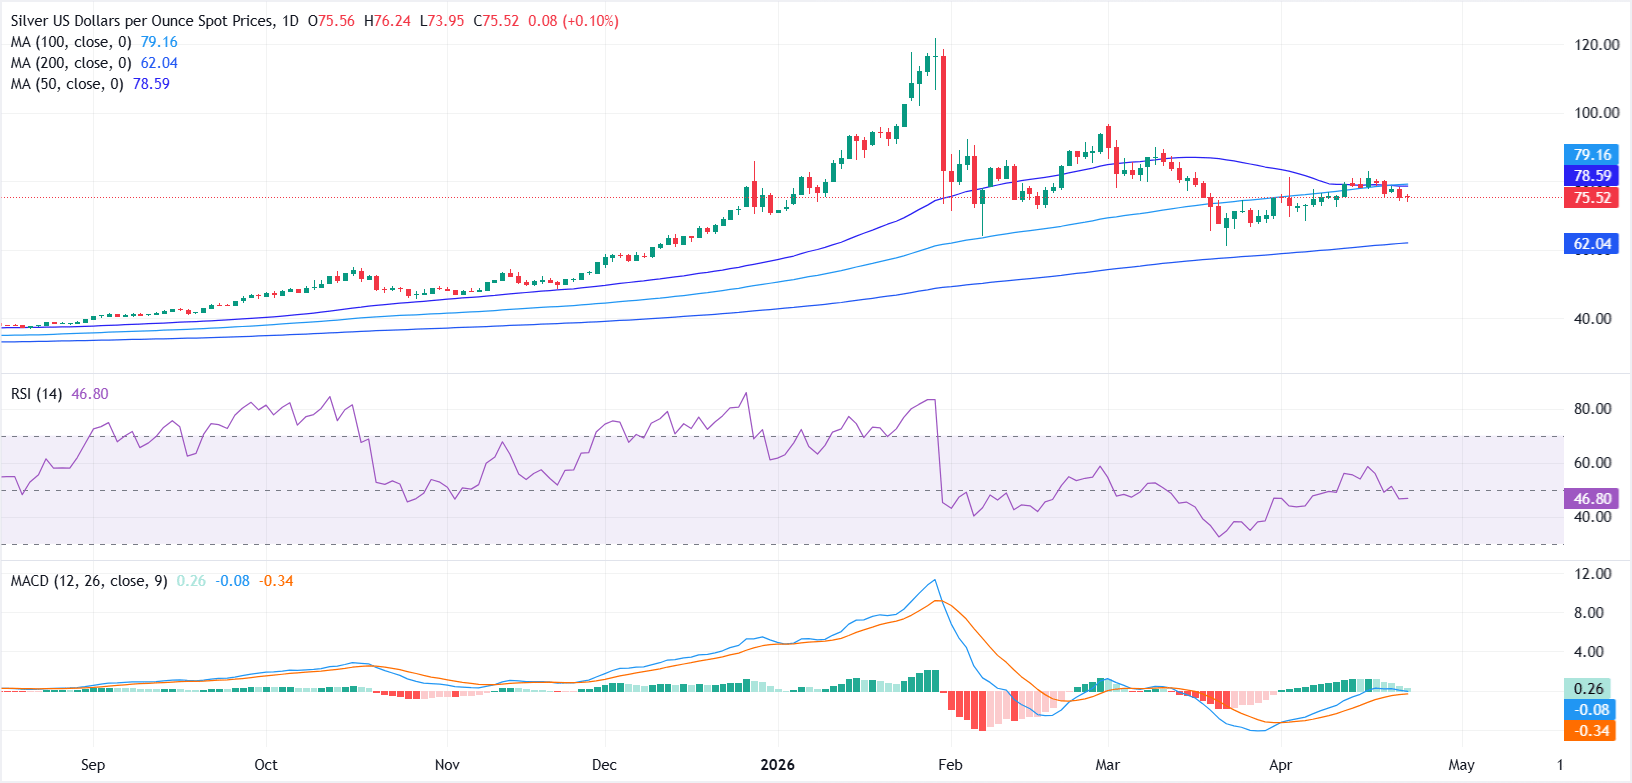
In the daily chart, XAG/USD remains in a bearish near-term stance as it holds below the 50-day simple moving average (SMA) at $78.59 and the 100-day SMA at $79.16, keeping the recent rebound capped beneath these medium-term trend gauges.
The 200-day SMA at $62.04 stays well below price and acts as a broader bullish floor, while the Relative Strength Index (RSI) at 47.04 sits just under the neutral 50 line, hinting at only modest downside pressure. Moving Average Convergence Divergence (MACD) is marginally positive at 0.27, suggesting improving but still vulnerable upside momentum as long as price trades below the clustered short- and medium-term averages.
On the topside, initial resistance is located at the 50-day SMA around $78.59, followed by a stronger barrier at the 100-day SMA near $79.16, where a daily close above would be needed to ease the current downside bias and open the way to a more constructive recovery.
On the downside, the immediate focus is on how spot behaves around the $75-$74 area as a short-term pivot; a sustained break lower would expose progressively lower levels toward the 200-day SMA at $62.04, which remains the key longer-term support zone guarding against a deeper correction.
(The technical analysis of this story was written with the help of an AI tool.)
Silver FAQs
Silver is a precious metal highly traded among investors. It has been historically used as a store of value and a medium of exchange. Although less popular than Gold, traders may turn to Silver to diversify their investment portfolio, for its intrinsic value or as a potential hedge during high-inflation periods. Investors can buy physical Silver, in coins or in bars, or trade it through vehicles such as Exchange Traded Funds, which track its price on international markets.
Silver prices can move due to a wide range of factors. Geopolitical instability or fears of a deep recession can make Silver price escalate due to its safe-haven status, although to a lesser extent than Gold's. As a yieldless asset, Silver tends to rise with lower interest rates. Its moves also depend on how the US Dollar (USD) behaves as the asset is priced in dollars (XAG/USD). A strong Dollar tends to keep the price of Silver at bay, whereas a weaker Dollar is likely to propel prices up. Other factors such as investment demand, mining supply – Silver is much more abundant than Gold – and recycling rates can also affect prices.
Silver is widely used in industry, particularly in sectors such as electronics or solar energy, as it has one of the highest electric conductivity of all metals – more than Copper and Gold. A surge in demand can increase prices, while a decline tends to lower them. Dynamics in the US, Chinese and Indian economies can also contribute to price swings: for the US and particularly China, their big industrial sectors use Silver in various processes; in India, consumers’ demand for the precious metal for jewellery also plays a key role in setting prices.
Silver prices tend to follow Gold's moves. When Gold prices rise, Silver typically follows suit, as their status as safe-haven assets is similar. The Gold/Silver ratio, which shows the number of ounces of Silver needed to equal the value of one ounce of Gold, may help to determine the relative valuation between both metals. Some investors may consider a high ratio as an indicator that Silver is undervalued, or Gold is overvalued. On the contrary, a low ratio might suggest that Gold is undervalued relative to Silver.

100만 명이 넘는 사용자가 FXStreet를 통해 실시간 시장 데이터, 차트 도구, 전문가 인사이트, 포렉스 뉴스를 이용합니다. 포괄적인 경제 캘린더와 교육 웨비나는 트레이더가 정보를 유지하고 신중한 결정을 내리도록 돕습니다. FXStreet는 바르셀로나 본사와 전 세계 지역에 걸쳐 약 60명의 팀으로 구성되어 있습니다.
더 읽기


