
Silver Price Forecast: XAG/USD trades with caution around $68 as US CPI takes centre stage
작성자 Sagar Dua
수정됨: 9 Jun 2026


인기 기사

Silver price (XAG/USD) trades marginally lower at around $67.90 during the European trading session on Tuesday. The white metal faces slight selling pressure as investors turn cautious ahead of the United States (US) Consumer Price Index (CPI) data for May, which will be published on Wednesday.
- Silver price edges down to near $67.90 in the countdown to the US inflation data for May.
- The US headline inflation is expected to have risen further to 4.2% YoY.
- Surprisingly strong US NFP has prompted hawkish Fed bets.
Silver price (XAG/USD) trades marginally lower at around $67.90 during the European trading session on Tuesday. The white metal faces slight selling pressure as investors turn cautious ahead of the United States (US) Consumer Price Index (CPI) data for May, which will be published on Wednesday.
The US CPI report is expected to show that the headline inflation accelerated to 4.2% Year-on-Year (YoY) from 3.8% in April. In the same period, the core CPI – which excludes volatile food and energy items – is expected to have grown at an annualized pace of 2.9%, faster than the previous reading of 2.8%.
Month-on-month (MoM) headline and core CPI are estimated to have risen at a moderate pace of 0.5% and 0.3%, respectively.
Investors will pay close attention to the US inflation data to get fresh cues regarding the Federal Reserve’s (Fed) monetary policy outlook.
Though precious metals outperform in a high inflation environment, an increment in hawkish Fed bets bodes poorly for non-yielding assets, such as Silver.
Hawkish Fed prospects have intensified in the last two trading days, following the release of the surprisingly stronger Nonfarm Payrolls (NFP) data for May.
According to the CME FedWatch tool, there is an almost 71% chance that the Fed will deliver at least one interest rate hike this year.
Silver technical analysis
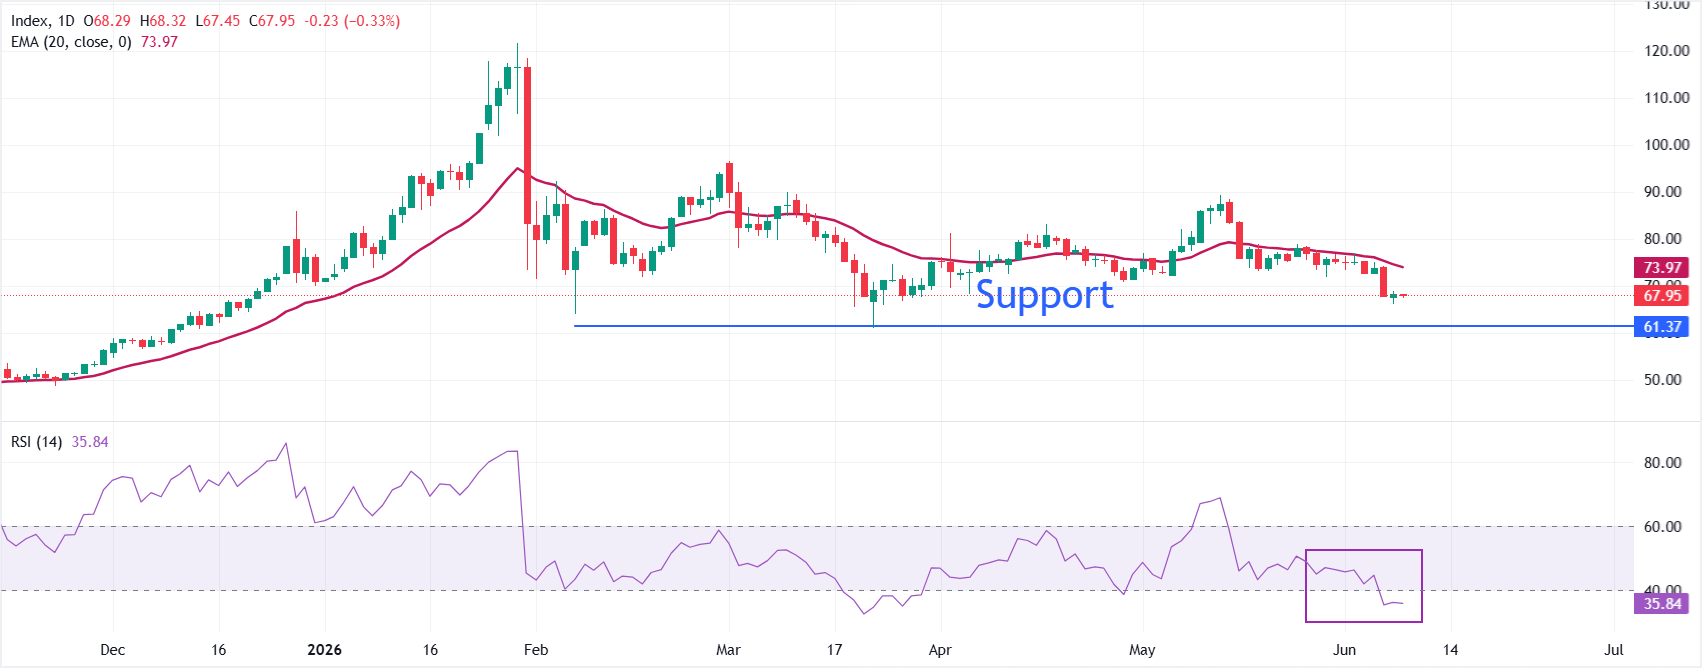
XAG/USD trades marginally lower to near $67.90, extending its corrective decline and holding well below the 20-day Exponential Moving Average (EMA) at $73.97, which reinforces a bearish near-term bias. The Moving Average Exponential (20, close) now acts as the primary dynamic cap, while the Relative Strength Index (RSI) at 35.83 hovers near oversold territory, hinting that downside momentum remains in place but could slow as selling pressure matures.
On the topside, immediate resistance is seen at the 20-day EMA around $73.97, and a daily close back above this barrier would be needed to ease the current bearish tone and signal room for a deeper recovery towards $80. On the downside, the spot could slide towards the March 23 low at $61.61.
(The technical analysis of this story was written with the help of an AI tool.)
Silver FAQs
Silver is a precious metal highly traded among investors. It has been historically used as a store of value and a medium of exchange. Although less popular than Gold, traders may turn to Silver to diversify their investment portfolio, for its intrinsic value or as a potential hedge during high-inflation periods. Investors can buy physical Silver, in coins or in bars, or trade it through vehicles such as Exchange Traded Funds, which track its price on international markets.
Silver prices can move due to a wide range of factors. Geopolitical instability or fears of a deep recession can make Silver price escalate due to its safe-haven status, although to a lesser extent than Gold's. As a yieldless asset, Silver tends to rise with lower interest rates. Its moves also depend on how the US Dollar (USD) behaves as the asset is priced in dollars (XAG/USD). A strong Dollar tends to keep the price of Silver at bay, whereas a weaker Dollar is likely to propel prices up. Other factors such as investment demand, mining supply – Silver is much more abundant than Gold – and recycling rates can also affect prices.
Silver is widely used in industry, particularly in sectors such as electronics or solar energy, as it has one of the highest electric conductivity of all metals – more than Copper and Gold. A surge in demand can increase prices, while a decline tends to lower them. Dynamics in the US, Chinese and Indian economies can also contribute to price swings: for the US and particularly China, their big industrial sectors use Silver in various processes; in India, consumers’ demand for the precious metal for jewellery also plays a key role in setting prices.
Silver prices tend to follow Gold's moves. When Gold prices rise, Silver typically follows suit, as their status as safe-haven assets is similar. The Gold/Silver ratio, which shows the number of ounces of Silver needed to equal the value of one ounce of Gold, may help to determine the relative valuation between both metals. Some investors may consider a high ratio as an indicator that Silver is undervalued, or Gold is overvalued. On the contrary, a low ratio might suggest that Gold is undervalued relative to Silver.

100만 명이 넘는 사용자가 FXStreet를 통해 실시간 시장 데이터, 차트 도구, 전문가 인사이트, 포렉스 뉴스를 이용합니다. 포괄적인 경제 캘린더와 교육 웨비나는 트레이더가 정보를 유지하고 신중한 결정을 내리도록 돕습니다. FXStreet는 바르셀로나 본사와 전 세계 지역에 걸쳐 약 60명의 팀으로 구성되어 있습니다.
더 읽기


