
Silver Price Forecast: XAG/USD wobbles around $72.50 in countdown to Trump’s ultimatum
작성자 Sagar Dua
수정됨: 6 Apr 2026


인기 기사

Silver price (XAG/USD) trades 0.7% lower to near $72.50 in the late Asian trade on Monday, but is broadly consolidating in a limited range. The white metal turns sideways as investors await Iran’s response to United States (US) President Donald Trump’s ultimatum.
- Silver price trades broadly sideways around $72.50 as investors await Iran’s response to Trump’s Tuesday deadline.
- The US and Iran discuss a 45-day ceasefire, according to Axios.
- Investors await the FOMC minutes of the March policy meeting, releasing on Wednesday.
Silver price (XAG/USD) trades 0.7% lower to near $72.50 in the late Asian trade on Monday, but is broadly consolidating in a limited range. The white metal turns sideways as investors await Iran’s response to United States (US) President Donald Trump’s ultimatum.
Over the weekend, US President Trump threatened to attack Iranian power plants and bridges if the nation doesn’t free the Strait of Hormuz by Tuesday, 9:00 PM Eastern time (ET).
Latest comments from the Iranian foreign ministry signal that the Middle East nation won’t reopen the Hormuz and has warned of reciprocal attacks. “Iran will reciprocate attacks on its infrastructure and target similar infrastructure owned by the US or related,” a spokesperson from Iran’s foreign ministry said.
Meanwhile, there are some reports from Axios, reported by Bloomberg, claiming that the US and Iran are discussing a 45-day ceasefire, a scenario that could result in a landmark de-escalation in the Middle East war if it gets approved, and would be favorable for the Silver price.
Theoretically, signs of easing geopolitical tensions diminish demand for precious metals, being the safe-haven assets. However, escalating global inflation projections due to the ongoing war, leading to hawkish monetary policy guidance from central banks, have battered their appeal, being non-yielding assets.
This week, investors will focus on the US Federal Open Market Committee (FOMC) minutes of the March policy meeting, which will be released on Wednesday.
Silver technical analysis
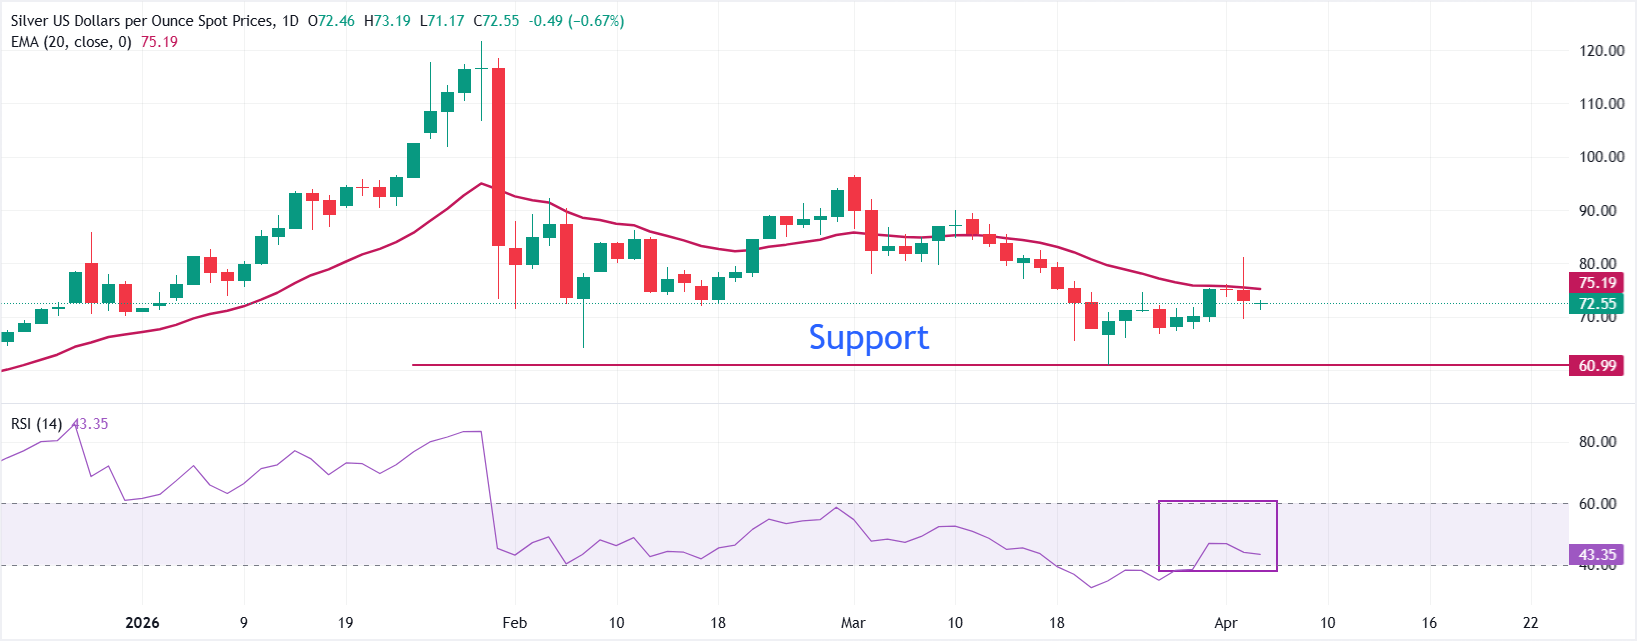
XAG/USD trades almost flat at around $72.50 as of writing. The near-term bias is mildly bearish as spot holds below the 20-day Exponential Moving Average (EMA), capping recovery attempts. The recent sequence of lower closes from the mid-$90s underscores a downside structure, while the RSI at 43 shows momentum remaining on the weak side without reaching oversold territory, suggesting persistent selling pressure but no capitulation.
Immediate resistance aligns with the 20-day EMA near $75.20, and a daily close above this area would be needed to ease the current bearish tone and open the way toward the $80.00 region. On the downside, initial support emerges around $70.00, guarding the path toward the late swing low near $66.70, where failure would expose the next bearish extension toward the March 23 low around $61.00.
(The technical analysis of this story was written with the help of an AI tool.)
Silver FAQs
Silver is a precious metal highly traded among investors. It has been historically used as a store of value and a medium of exchange. Although less popular than Gold, traders may turn to Silver to diversify their investment portfolio, for its intrinsic value or as a potential hedge during high-inflation periods. Investors can buy physical Silver, in coins or in bars, or trade it through vehicles such as Exchange Traded Funds, which track its price on international markets.
Silver prices can move due to a wide range of factors. Geopolitical instability or fears of a deep recession can make Silver price escalate due to its safe-haven status, although to a lesser extent than Gold's. As a yieldless asset, Silver tends to rise with lower interest rates. Its moves also depend on how the US Dollar (USD) behaves as the asset is priced in dollars (XAG/USD). A strong Dollar tends to keep the price of Silver at bay, whereas a weaker Dollar is likely to propel prices up. Other factors such as investment demand, mining supply – Silver is much more abundant than Gold – and recycling rates can also affect prices.
Silver is widely used in industry, particularly in sectors such as electronics or solar energy, as it has one of the highest electric conductivity of all metals – more than Copper and Gold. A surge in demand can increase prices, while a decline tends to lower them. Dynamics in the US, Chinese and Indian economies can also contribute to price swings: for the US and particularly China, their big industrial sectors use Silver in various processes; in India, consumers’ demand for the precious metal for jewellery also plays a key role in setting prices.
Silver prices tend to follow Gold's moves. When Gold prices rise, Silver typically follows suit, as their status as safe-haven assets is similar. The Gold/Silver ratio, which shows the number of ounces of Silver needed to equal the value of one ounce of Gold, may help to determine the relative valuation between both metals. Some investors may consider a high ratio as an indicator that Silver is undervalued, or Gold is overvalued. On the contrary, a low ratio might suggest that Gold is undervalued relative to Silver.

100만 명이 넘는 사용자가 FXStreet를 통해 실시간 시장 데이터, 차트 도구, 전문가 인사이트, 포렉스 뉴스를 이용합니다. 포괄적인 경제 캘린더와 교육 웨비나는 트레이더가 정보를 유지하고 신중한 결정을 내리도록 돕습니다. FXStreet는 바르셀로나 본사와 전 세계 지역에 걸쳐 약 60명의 팀으로 구성되어 있습니다.
더 읽기


