
Silver Price Forecasts: XAG/USD hits fresh lows sub-$74.00 in risk-off markets
작성자 Guillermo Alcala
수정됨: 24 Apr 2026


인기 기사

Silver (XAG/USD) trades lower for the second consecutive day on Friday, weighed by the US Dollar’s strength, as investors lose their hopes of a swift end to the Middle East conflict.
- Silver hits fresh 10-day lows below $74, on track for a nearly 7% weekly loss.
- Waning hopes of an immediate peace deal in the Middle East have boosted the US Dollar this week.
- XAG/USD clings to support around $74.60 with bears in control.
Silver (XAG/USD) trades lower for the second consecutive day on Friday, weighed by the US Dollar’s strength, as investors lose their hopes of a swift end to the Middle East conflict. The precious metal is trading at $74.65 at the time of writing, after hitting 10-day lows at $73.95 earlier on Friday, set for a nearly 7% decline this week.
Precious metals have remained on the defensive this week, amid the deadlock in the US-Iran peace process, which has pushed investors towards the safety of the US Dollar.
A fragile ceasefire remains on hold, but seizures of cargo vessels by the US and Iran have strained the relations between the two countries. These actions keep pushing back hopes of any early reopening of the Strait of Hormuz and maintain Crude prices at levels threatening to tip the global economy into recession.
XAG/USD clings to support at a Fibonacci retracement level near $74.70
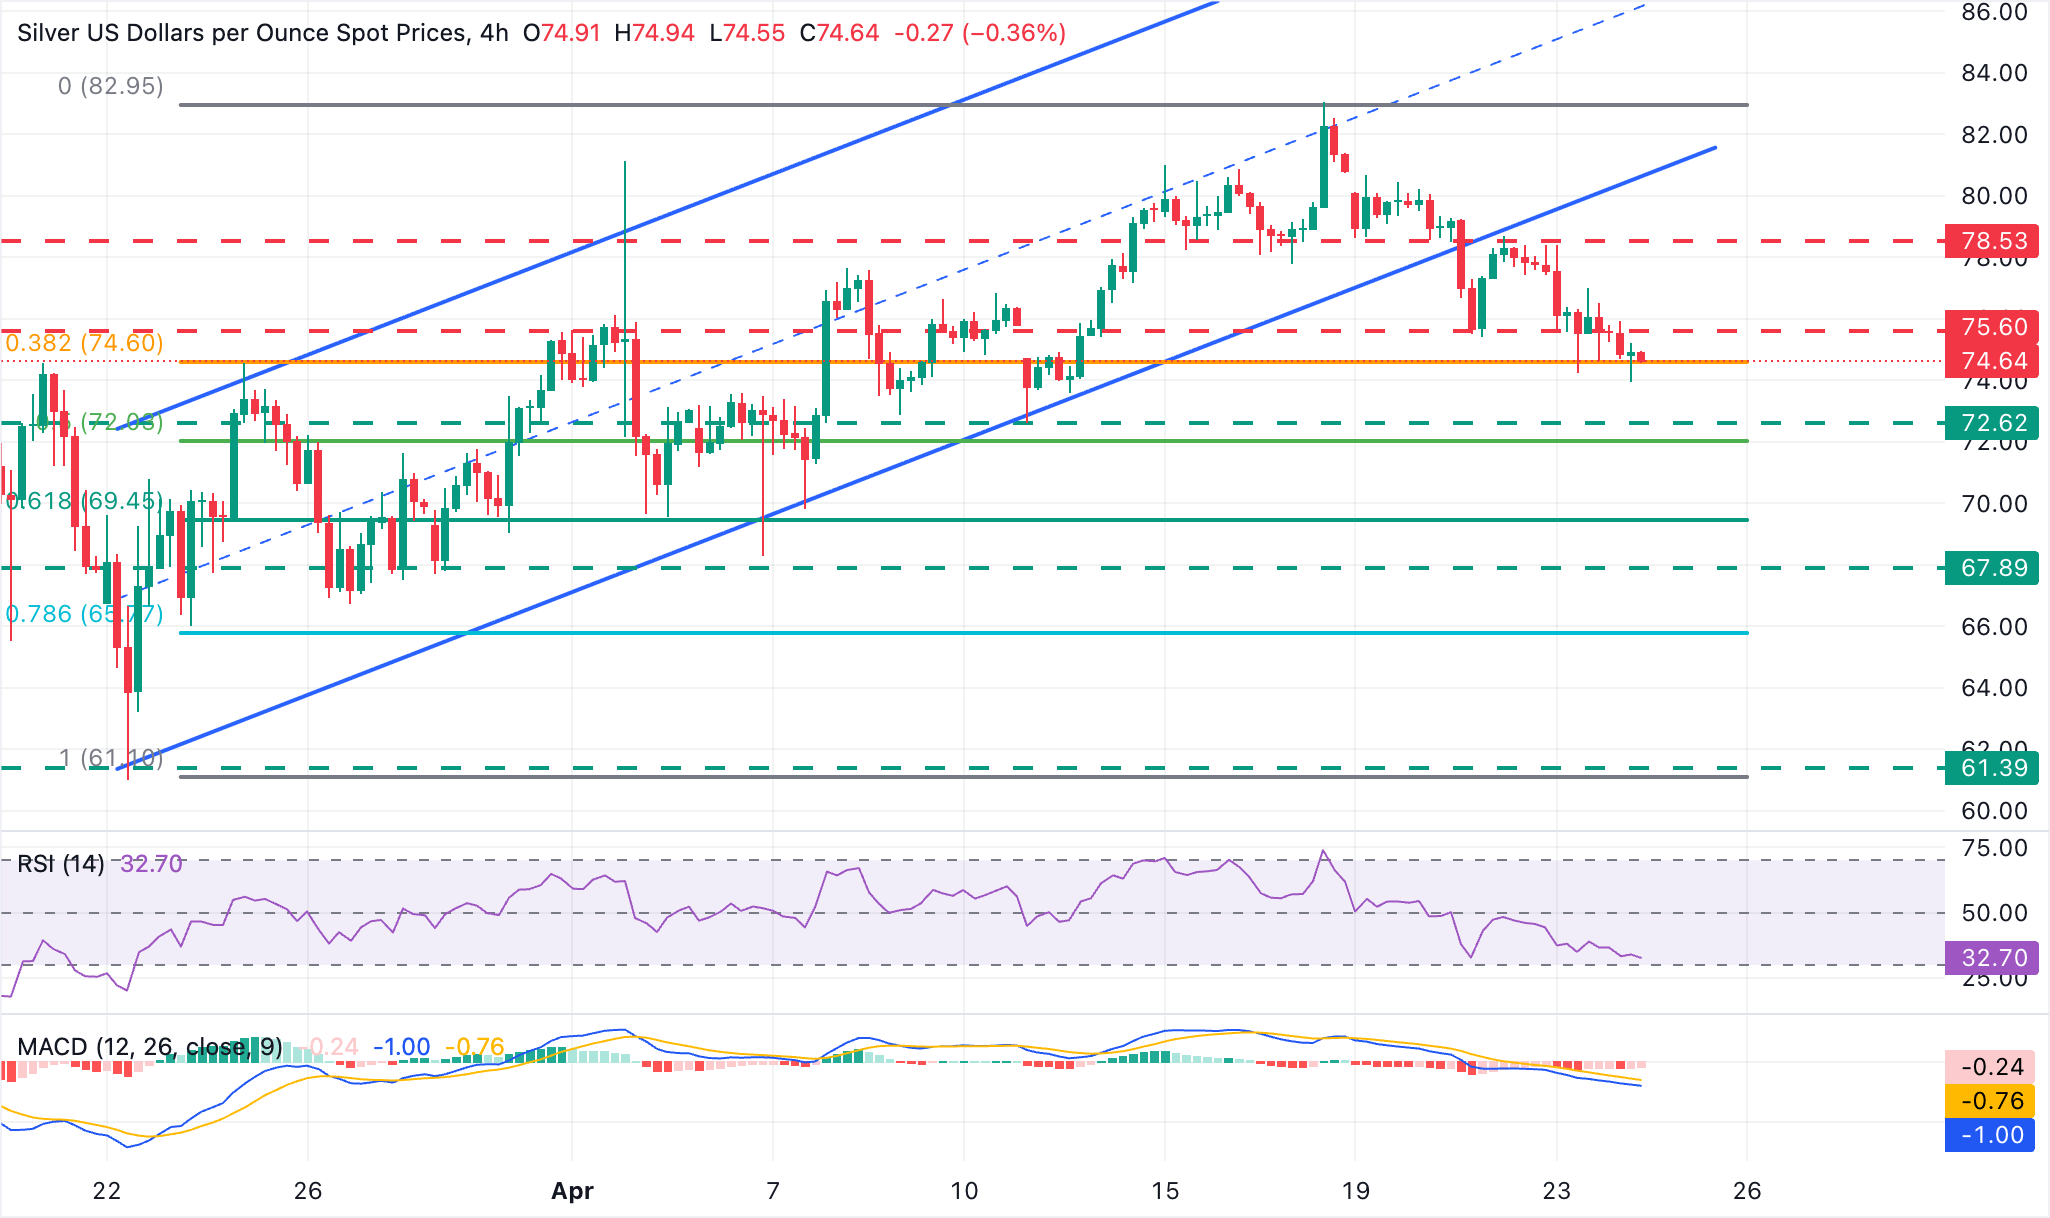
XAG/USD broke the bottom of the upward-trending channel from late March lows earlier this week, and the impulsive bearish candle from a previous support area around the $78.50 level on Thursday's daily chart confirms that sellers have taken control.
Technical indicators show significant bearish pressure, which is keeping upside attempts subdued for now. The Relative Strength Index (RSI) is nearing oversold conditions but not yet there, while the Moving Average Convergence Divergence (MACD) readings remain negative, reinforcing downside pressure.
Sellers have found some support at the 38.2% Fibonacci retracement of April's rally, at $74.60. Further down, the area between April 12 lows, at $72.61, and the 50% Fibonacci retracement, right above $72.00, emerges as the next target. On the topside, a previous support area at $75.60 is likely to act now as resistance ahead of Wednesday's high, at the mentioned $78.60 area.
(The technical analysis of this story was written with the help of an AI tool.)
Silver FAQs
Silver is a precious metal highly traded among investors. It has been historically used as a store of value and a medium of exchange. Although less popular than Gold, traders may turn to Silver to diversify their investment portfolio, for its intrinsic value or as a potential hedge during high-inflation periods. Investors can buy physical Silver, in coins or in bars, or trade it through vehicles such as Exchange Traded Funds, which track its price on international markets.
Silver prices can move due to a wide range of factors. Geopolitical instability or fears of a deep recession can make Silver price escalate due to its safe-haven status, although to a lesser extent than Gold's. As a yieldless asset, Silver tends to rise with lower interest rates. Its moves also depend on how the US Dollar (USD) behaves as the asset is priced in dollars (XAG/USD). A strong Dollar tends to keep the price of Silver at bay, whereas a weaker Dollar is likely to propel prices up. Other factors such as investment demand, mining supply – Silver is much more abundant than Gold – and recycling rates can also affect prices.
Silver is widely used in industry, particularly in sectors such as electronics or solar energy, as it has one of the highest electric conductivity of all metals – more than Copper and Gold. A surge in demand can increase prices, while a decline tends to lower them. Dynamics in the US, Chinese and Indian economies can also contribute to price swings: for the US and particularly China, their big industrial sectors use Silver in various processes; in India, consumers’ demand for the precious metal for jewellery also plays a key role in setting prices.
Silver prices tend to follow Gold's moves. When Gold prices rise, Silver typically follows suit, as their status as safe-haven assets is similar. The Gold/Silver ratio, which shows the number of ounces of Silver needed to equal the value of one ounce of Gold, may help to determine the relative valuation between both metals. Some investors may consider a high ratio as an indicator that Silver is undervalued, or Gold is overvalued. On the contrary, a low ratio might suggest that Gold is undervalued relative to Silver.

100만 명이 넘는 사용자가 FXStreet를 통해 실시간 시장 데이터, 차트 도구, 전문가 인사이트, 포렉스 뉴스를 이용합니다. 포괄적인 경제 캘린더와 교육 웨비나는 트레이더가 정보를 유지하고 신중한 결정을 내리도록 돕습니다. FXStreet는 바르셀로나 본사와 전 세계 지역에 걸쳐 약 60명의 팀으로 구성되어 있습니다.
더 읽기


