
Silver Price Forecasts: XAG/USD hovers at $74.00 with bullish momentum fading
작성자 Guillermo Alcala
수정됨: 13 Apr 2026


인기 기사

Silver (XAG/USD) is trading practically flat, right above the $74.00 level at the time of writing, after having hit session lows at $72.61.
- Silver hovers right above $74.00 after hitting daily lows near $72.61.
- Precious metals struggle on Monday as US-Iran peace talks fail and Trump threatens to block Hormuz.
- XAU/USD: A potential Bearish Flag formation is in progress
Silver (XAG/USD) is trading practically flat, right above the $74.00 level at the time of writing, after having hit session lows at $72.61. The failure of the peace talks between the US and Iran this weekend and US President Donald Trump’s will to impose a blockade on the Strait of Hormuz have provided a fresh boost to the safe-haven US Dollar.
Precious metals dropped following the breakdown of the peace talks. US negotiators affirmed that Iran’s refusal to continue enriching uranium, allegedly aimed at obtaining a nuclear weapon, has been a red line. The two-week ceasefire, however, remains in place, which keeps hopes of further negotiations alive.
The macroeconomic calendar is practically empty on Monday. On Tuesday, all eyes are on the US Producer Prices Index (PPI) figures from March. These are expected to follow the track of Friday’s Consumer Price Index (CPI) report, highlighting the inflationary pressures stemming from the Iran war and giving further reasons for Federal Reserve (Fed) hawks.
Technical Analysis: Potential Bearish Flag formation
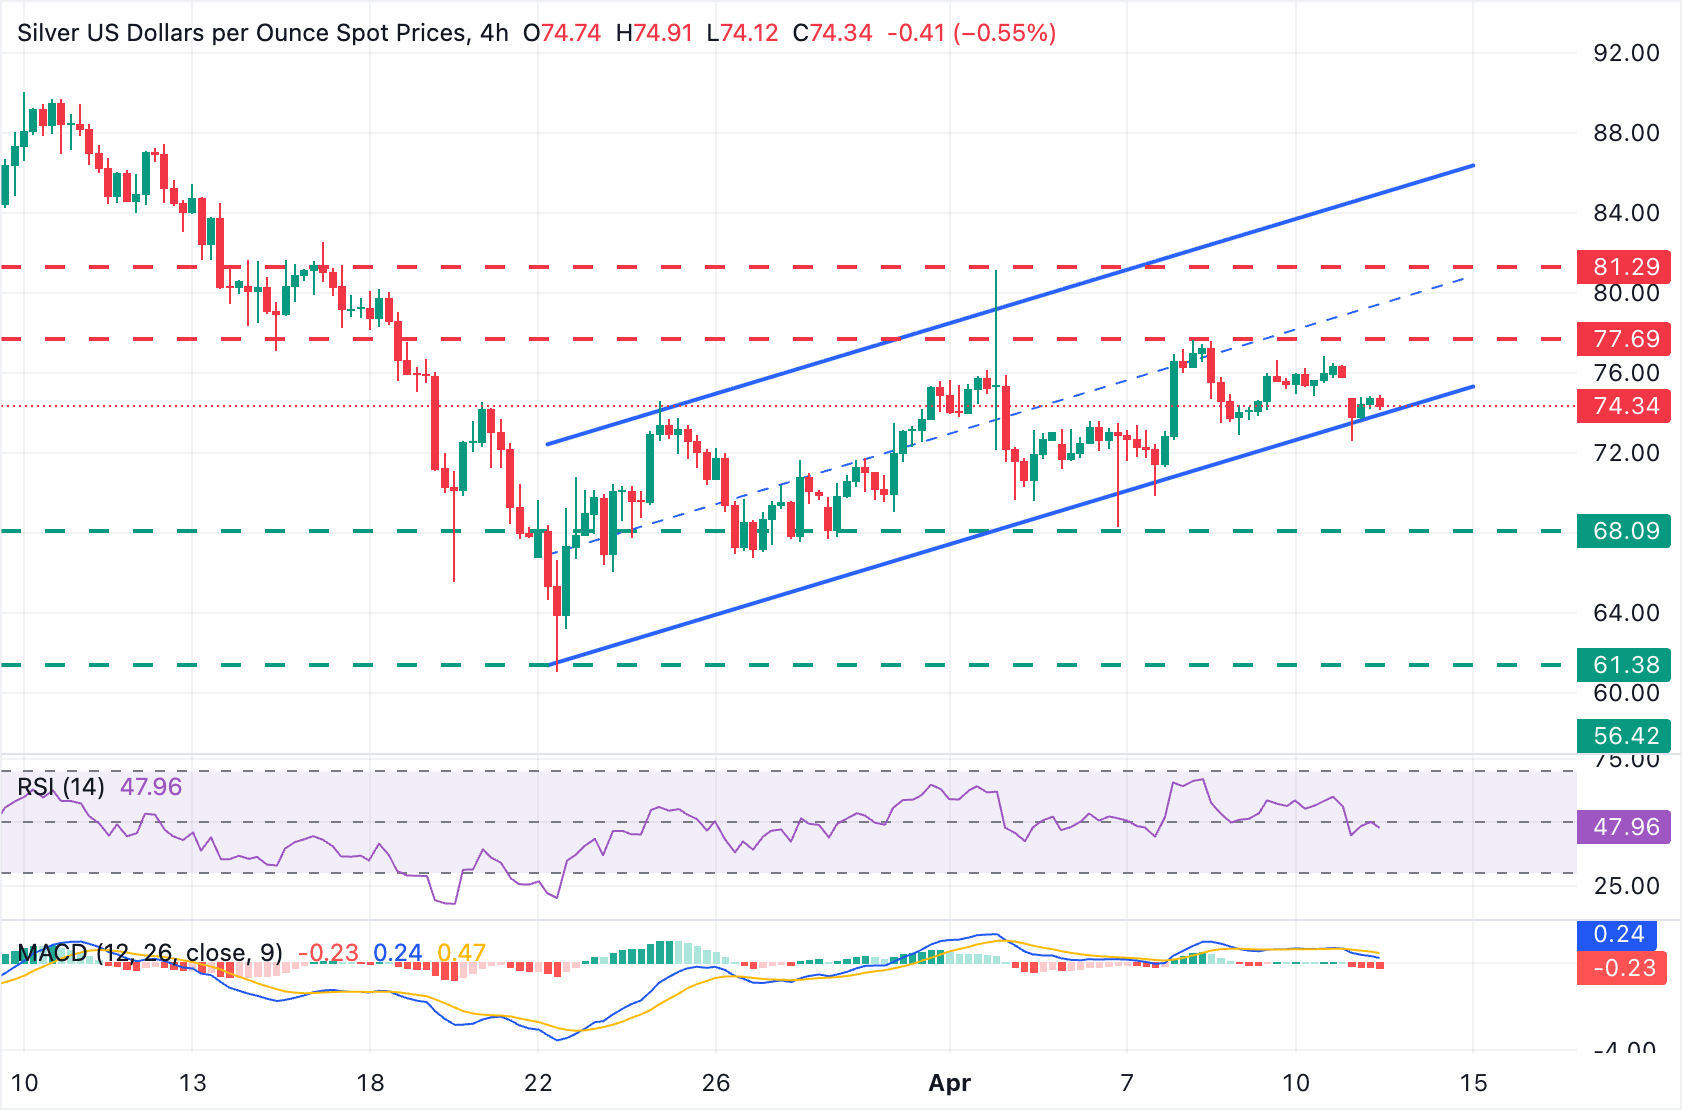
XAG/USD is holding right above the bottom of a rising channel from late March lows, with indicators showing a weakening momentum. The 4-Hour Relative Strength (RSI) Index has retreated below the midline, and downside momentum is reinforced by a negative Moving Average Convergence Divergence (MACD).
A successful break of the mentioned channel bottom, now around $73.50, would confirm a Bearish Flag formation whose initial target would be the March 23 low, at the $61.00 area. Before that, bears are likely to meet some support at the early April lows, between $68.20 and $69.80.
On the topside, a recovery above the channel bottom would be the first sign of stabilization, opening scope for a test of horizontal resistance at $77.65 (April 8 high) ahead of the April 1 high, at $81.13, and the channel top, now around $85.00.
(The technical analysis of this story was written with the help of an AI tool.)
Silver FAQs
Silver is a precious metal highly traded among investors. It has been historically used as a store of value and a medium of exchange. Although less popular than Gold, traders may turn to Silver to diversify their investment portfolio, for its intrinsic value or as a potential hedge during high-inflation periods. Investors can buy physical Silver, in coins or in bars, or trade it through vehicles such as Exchange Traded Funds, which track its price on international markets.
Silver prices can move due to a wide range of factors. Geopolitical instability or fears of a deep recession can make Silver price escalate due to its safe-haven status, although to a lesser extent than Gold's. As a yieldless asset, Silver tends to rise with lower interest rates. Its moves also depend on how the US Dollar (USD) behaves as the asset is priced in dollars (XAG/USD). A strong Dollar tends to keep the price of Silver at bay, whereas a weaker Dollar is likely to propel prices up. Other factors such as investment demand, mining supply – Silver is much more abundant than Gold – and recycling rates can also affect prices.
Silver is widely used in industry, particularly in sectors such as electronics or solar energy, as it has one of the highest electric conductivity of all metals – more than Copper and Gold. A surge in demand can increase prices, while a decline tends to lower them. Dynamics in the US, Chinese and Indian economies can also contribute to price swings: for the US and particularly China, their big industrial sectors use Silver in various processes; in India, consumers’ demand for the precious metal for jewellery also plays a key role in setting prices.
Silver prices tend to follow Gold's moves. When Gold prices rise, Silver typically follows suit, as their status as safe-haven assets is similar. The Gold/Silver ratio, which shows the number of ounces of Silver needed to equal the value of one ounce of Gold, may help to determine the relative valuation between both metals. Some investors may consider a high ratio as an indicator that Silver is undervalued, or Gold is overvalued. On the contrary, a low ratio might suggest that Gold is undervalued relative to Silver.

100만 명이 넘는 사용자가 FXStreet를 통해 실시간 시장 데이터, 차트 도구, 전문가 인사이트, 포렉스 뉴스를 이용합니다. 포괄적인 경제 캘린더와 교육 웨비나는 트레이더가 정보를 유지하고 신중한 결정을 내리도록 돕습니다. FXStreet는 바르셀로나 본사와 전 세계 지역에 걸쳐 약 60명의 팀으로 구성되어 있습니다.
더 읽기


