
Solana holds above $120 as institutional support stays firm, whale demand builds
작성자 Vishal Dixit
게시일: 22 Dec 2025 | 수정일: 22 Dec 2025


인기 기사

Solana (SOL) trades above $125 at press time on Monday, extending Friday's 5% rise after a muted weekend.
- Solana stays above $120 and the 200-week EMA after breaking below its 34-month support trendline in November.
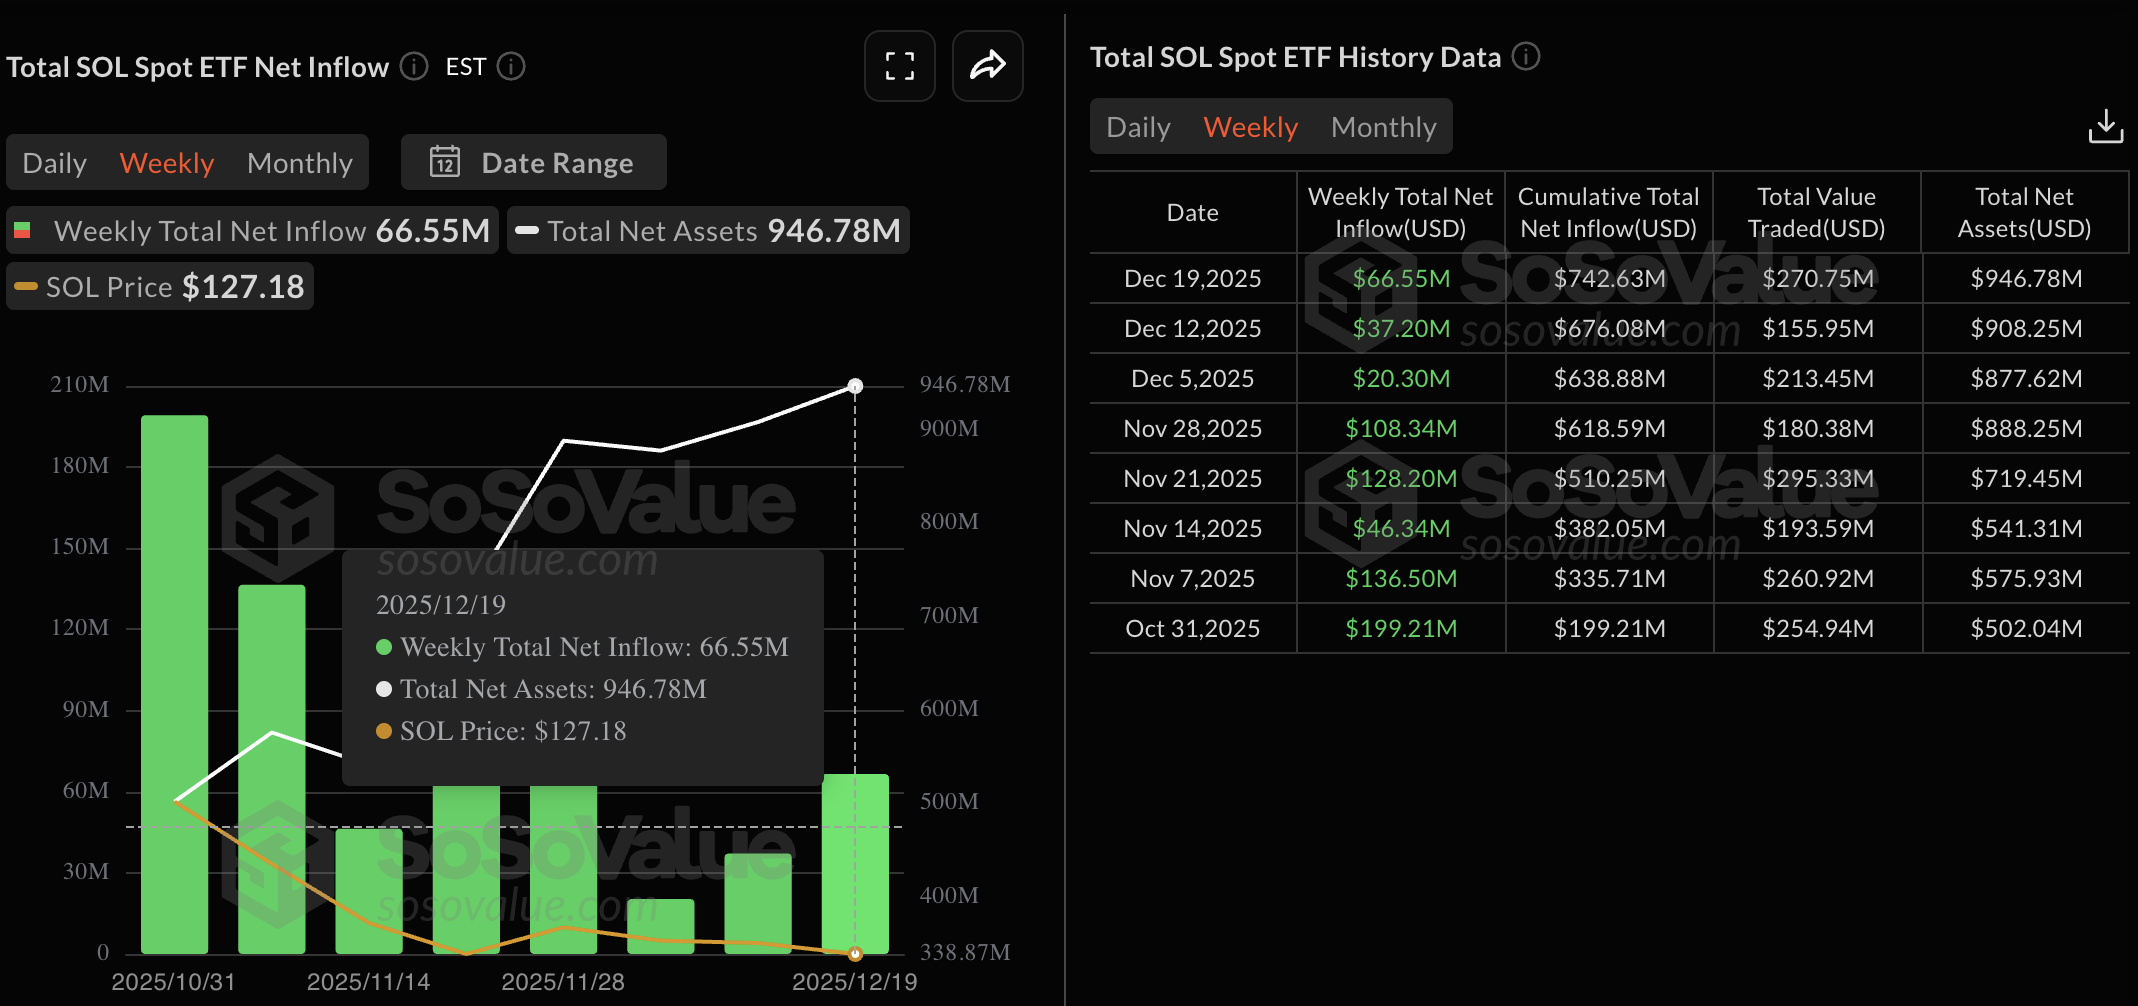
- Institutional support for Solana remains steady, with eight consecutive weeks of ETF inflows.
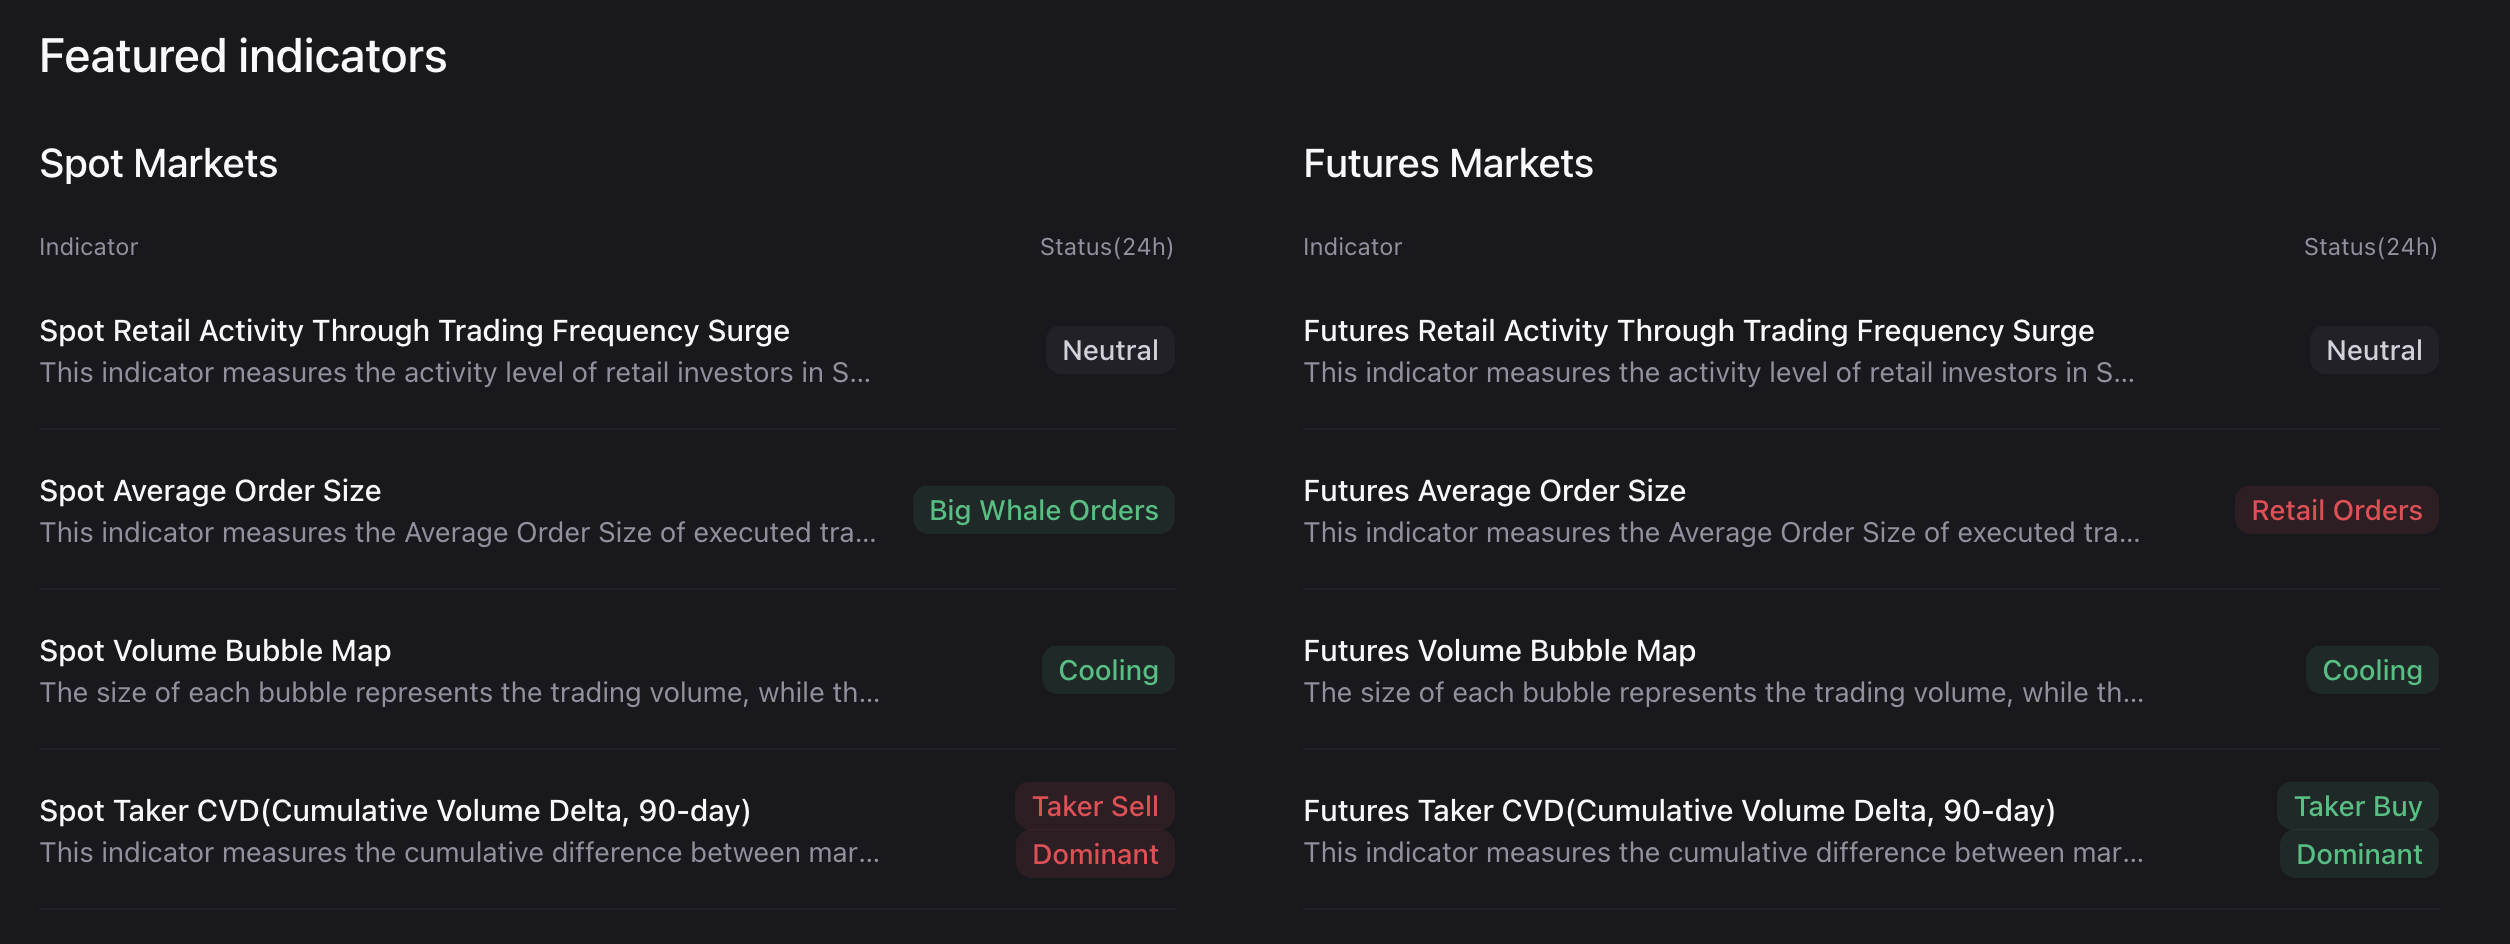
- The spot market sees a surge in whale demand as leverage cools in the derivatives market.
Solana (SOL) trades above $125 at press time on Monday, extending Friday's 5% rise after a muted weekend. The high-speed blockchain is seeing steady inflows from Exchange Traded Funds (ETFs) for the eighth consecutive week, while large wallet investors, commonly referred to as whales, are placing large orders in the spot market. Meanwhile, derivatives market data indicate that leverage-driven demand is cooling.
The technical outlook for Solana remains optimistic as the 200-week Exponential Moving Average (EMA) remains intact.
Large investors demand spikes for Solana
The institutional demand for Solana remains steady amid the recent surge in volatility in the cryptocurrency market. Sosovalue data shows that the weekly total net inflow into Solana-focused US spot ETFs reached $66.55 million last week, the highest in December so far.
On the other hand, CryptoQuant data shows steady demand from whales in the spot market, as reflected in the average order size. However, the decline in average order size in the derivatives market suggests a retail-driven market as large investors reduce leverage exposure.
A reduction in leverage-fueled demand, alongside rising institutional and whale demand in the spot market, increases the likelihood of a rebound.
Technical outlook: Will Solana bounce back from the 200-week EMA?
Solana dropped over 2% last week, marking its third consecutive week in the red, but it remained above its 200-week EMA at $121. SOL consolidates above the 200-week EMA after breaking below a 38-month-old rising support trendline connecting the December 2022 and April 2025 lows on the daily logarithmic chart, in early November. This indicates supply absorption near a crucial moving average.
Furthermore, persistent Doji-shaped weekly candles near the supporting moving average improve the odds of a bullish rebound.
A potential recovery in Solana could target the 50-week EMA at $166 as primary resistance, followed by the $200 psychological mark.
The technical indicators on the weekly chart indicate a decline in trend momentum, which remains bearish overall. The Relative Strength Index (RSI) flattens out near 37, before reaching the oversold zone, suggesting a reduction in selling pressure. Meanwhile, the Moving Average Convergence Divergence (MACD) and the signal line are pointing downwards, while the red histogram bars decline in succession. This suggests that bearish momentum is losing strength.
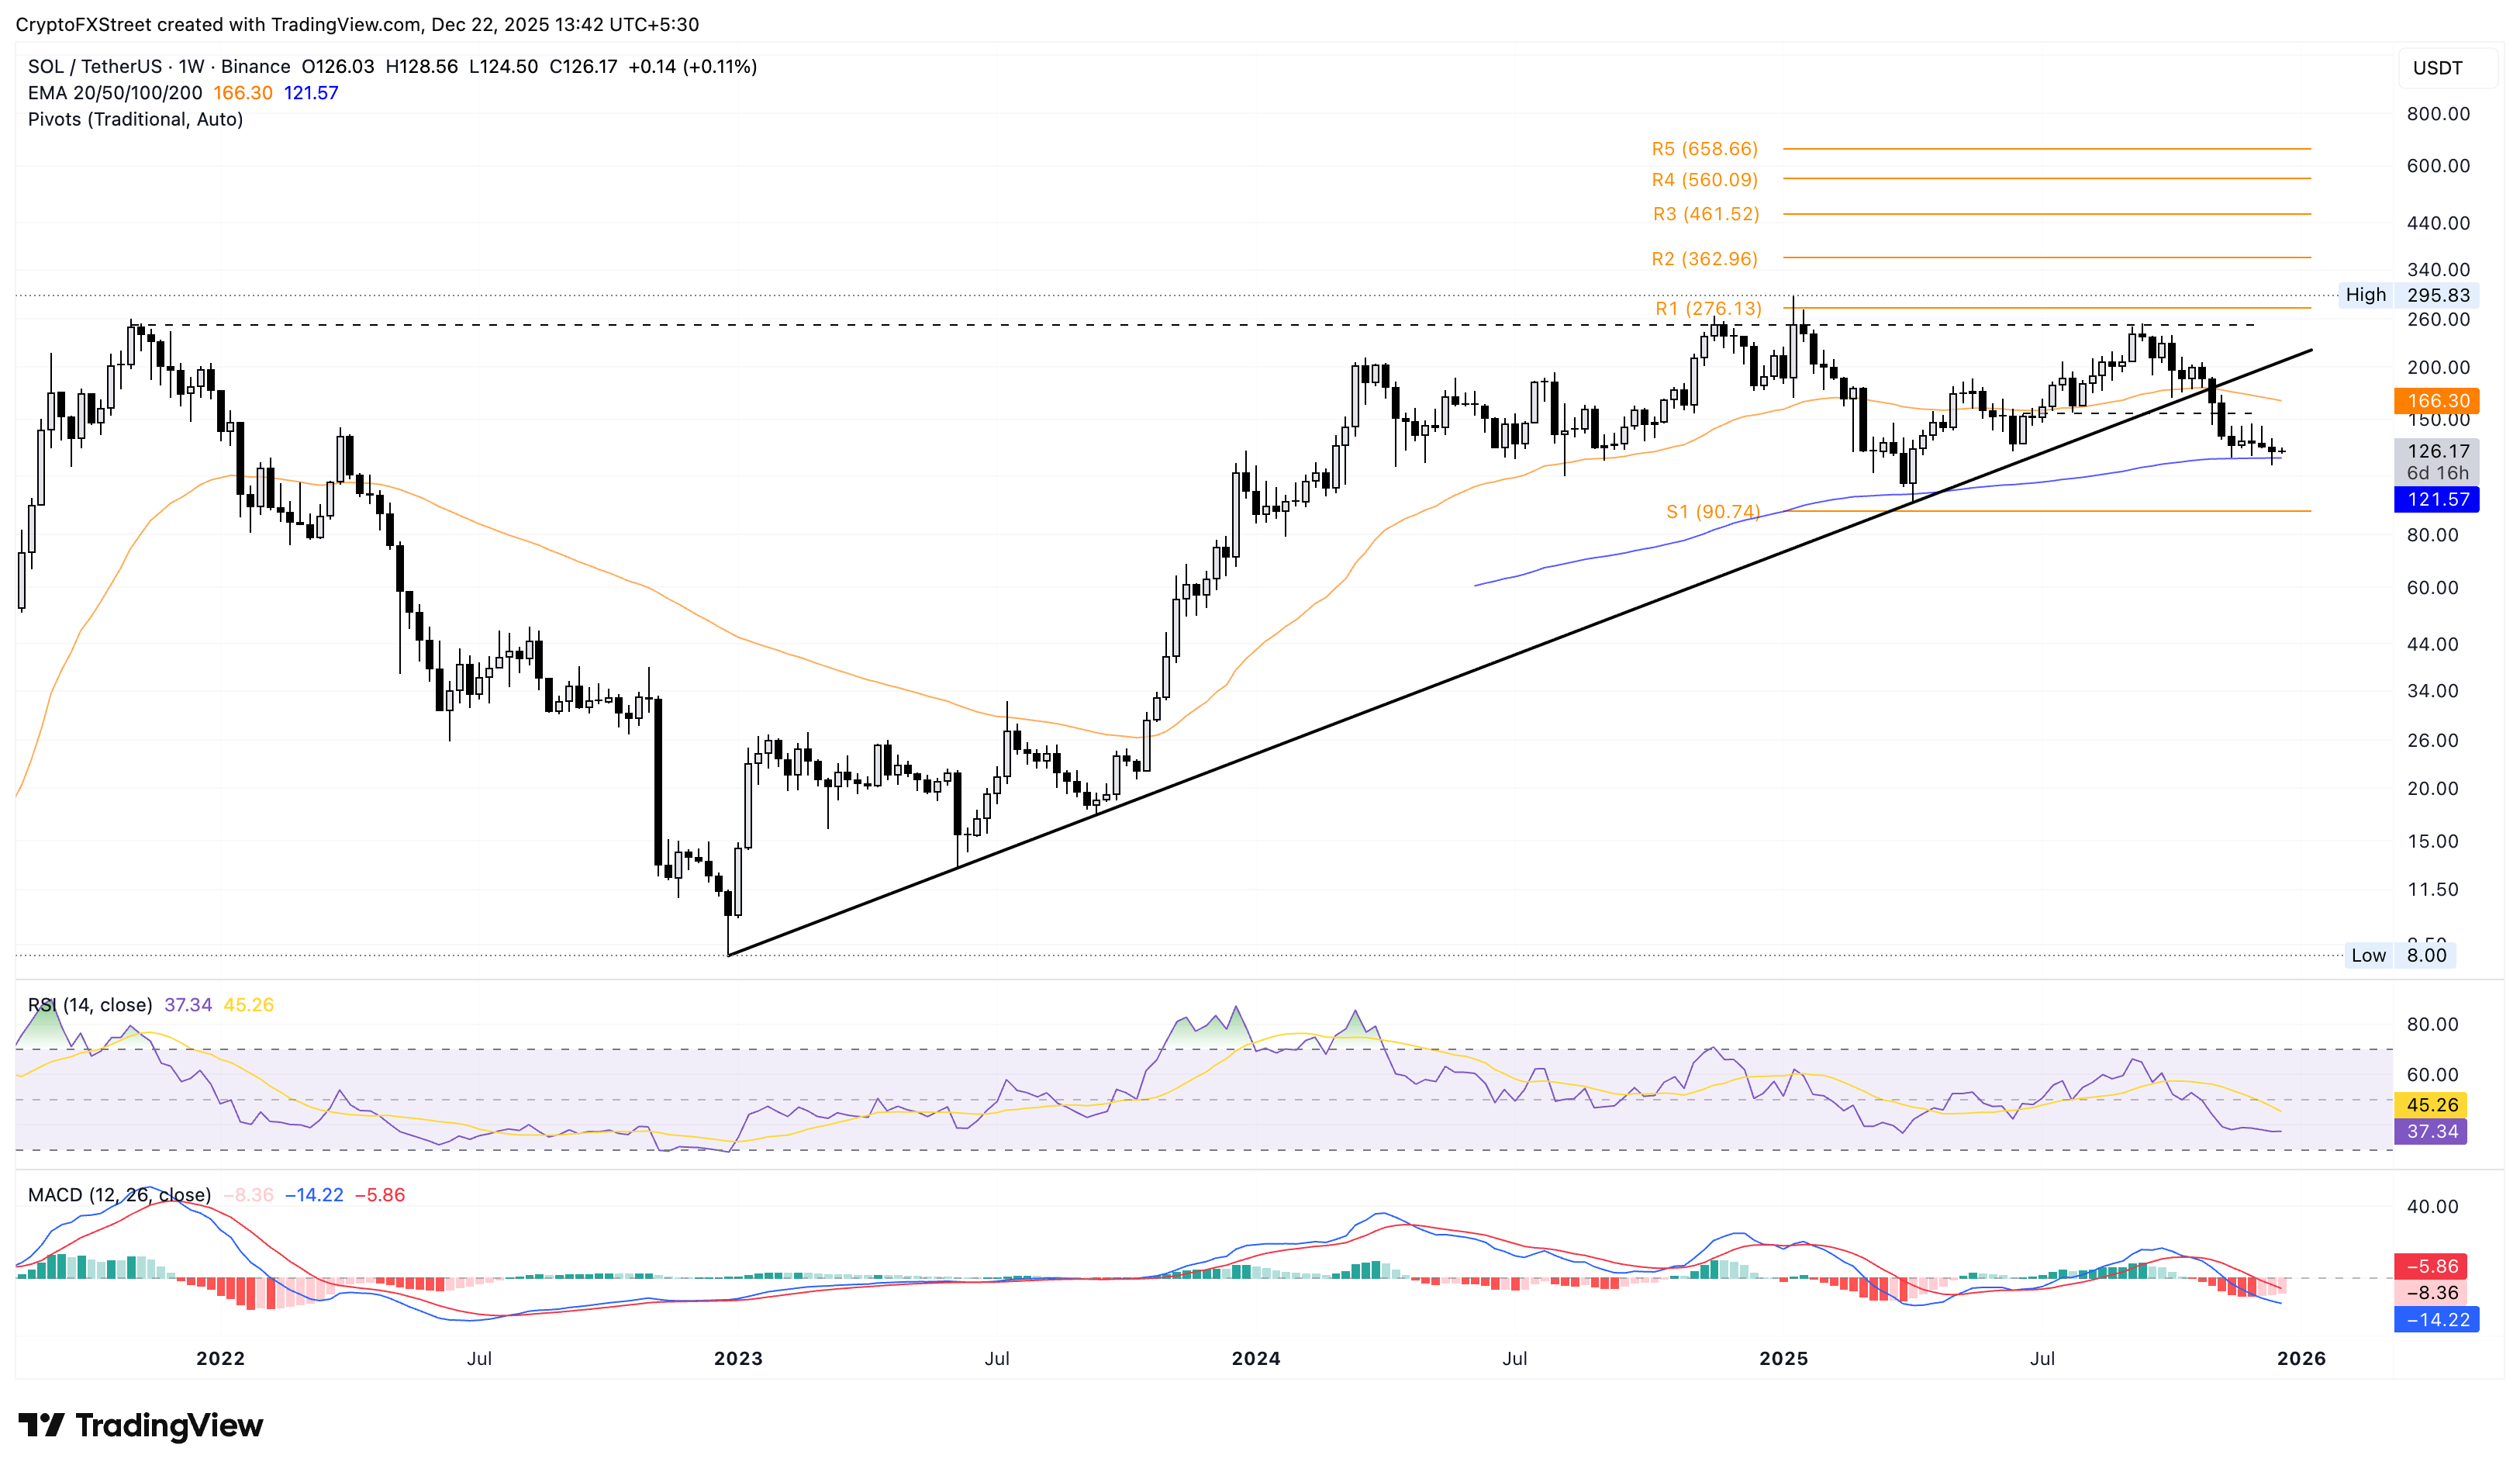
Looking down, a weekly close below the 200-week EMA at $121 would nullify Solana's rebound chances, potentially targeting the $100 psychological level or the S1 Pivot Point at $90.

100만 명이 넘는 사용자가 FXStreet를 통해 실시간 시장 데이터, 차트 도구, 전문가 인사이트, 포렉스 뉴스를 이용합니다. 포괄적인 경제 캘린더와 교육 웨비나는 트레이더가 정보를 유지하고 신중한 결정을 내리도록 돕습니다. FXStreet는 바르셀로나 본사와 전 세계 지역에 걸쳐 약 60명의 팀으로 구성되어 있습니다.
더 읽기


