

Solana Price Forecast: SOL consolidates amid growing RWA ecosystem, mild ETF inflows
- Solana consolidates near $85 on Monday, under pressure from the 50-day EMA.
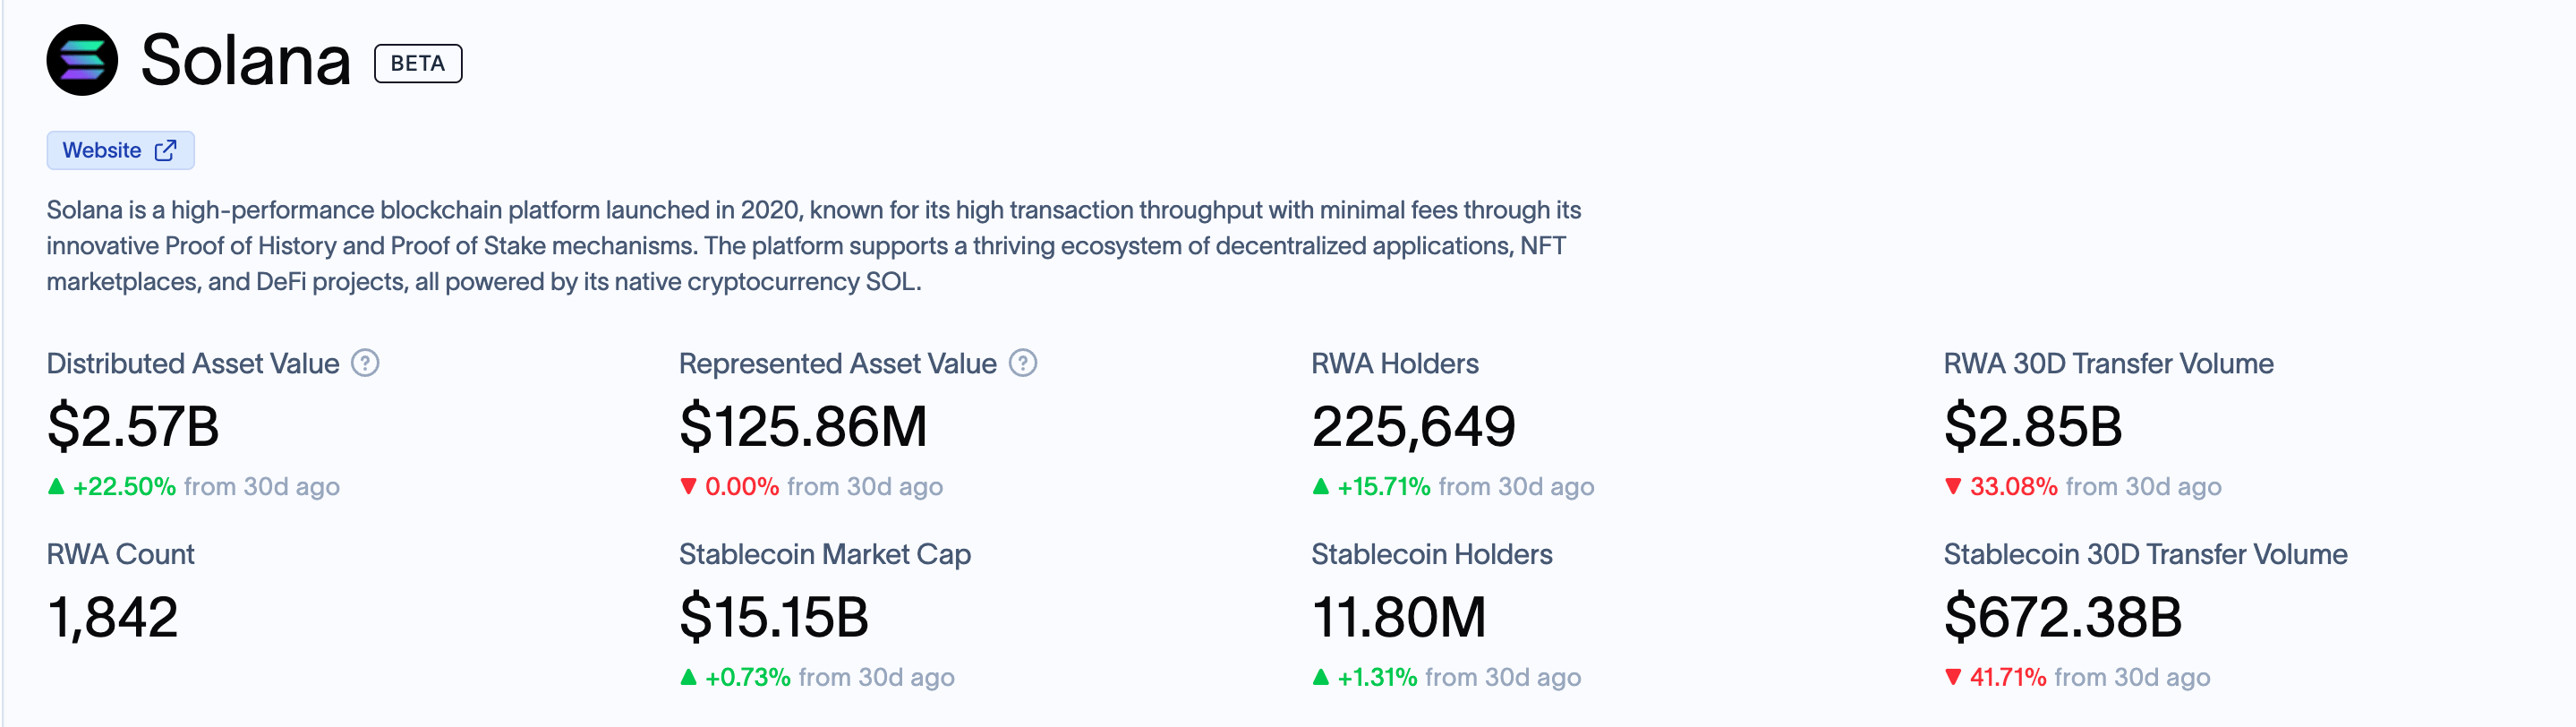
- Data shows real-world assets on Solana are up over 20% in the last 30 days, surpassing $2.50 billion.
- Institutional demand for SOL holds steady while retail interest wavers.
Solana (SOL) is trading below its 50-day Exponential Moving Average (EMA) at $87.35 on Monday after moving nearly flat last week. The real-world assets (RWAs) ecosystem on Solana surpassed $2.50 billion in value, reflecting growing adoption in the traditional finance market. Over $15 million in inflows last week suggests steady institutional demand for SOL, while retail confidence wavers in the short term.

Solana’s RWA ecosystem crosses $2.50 billion
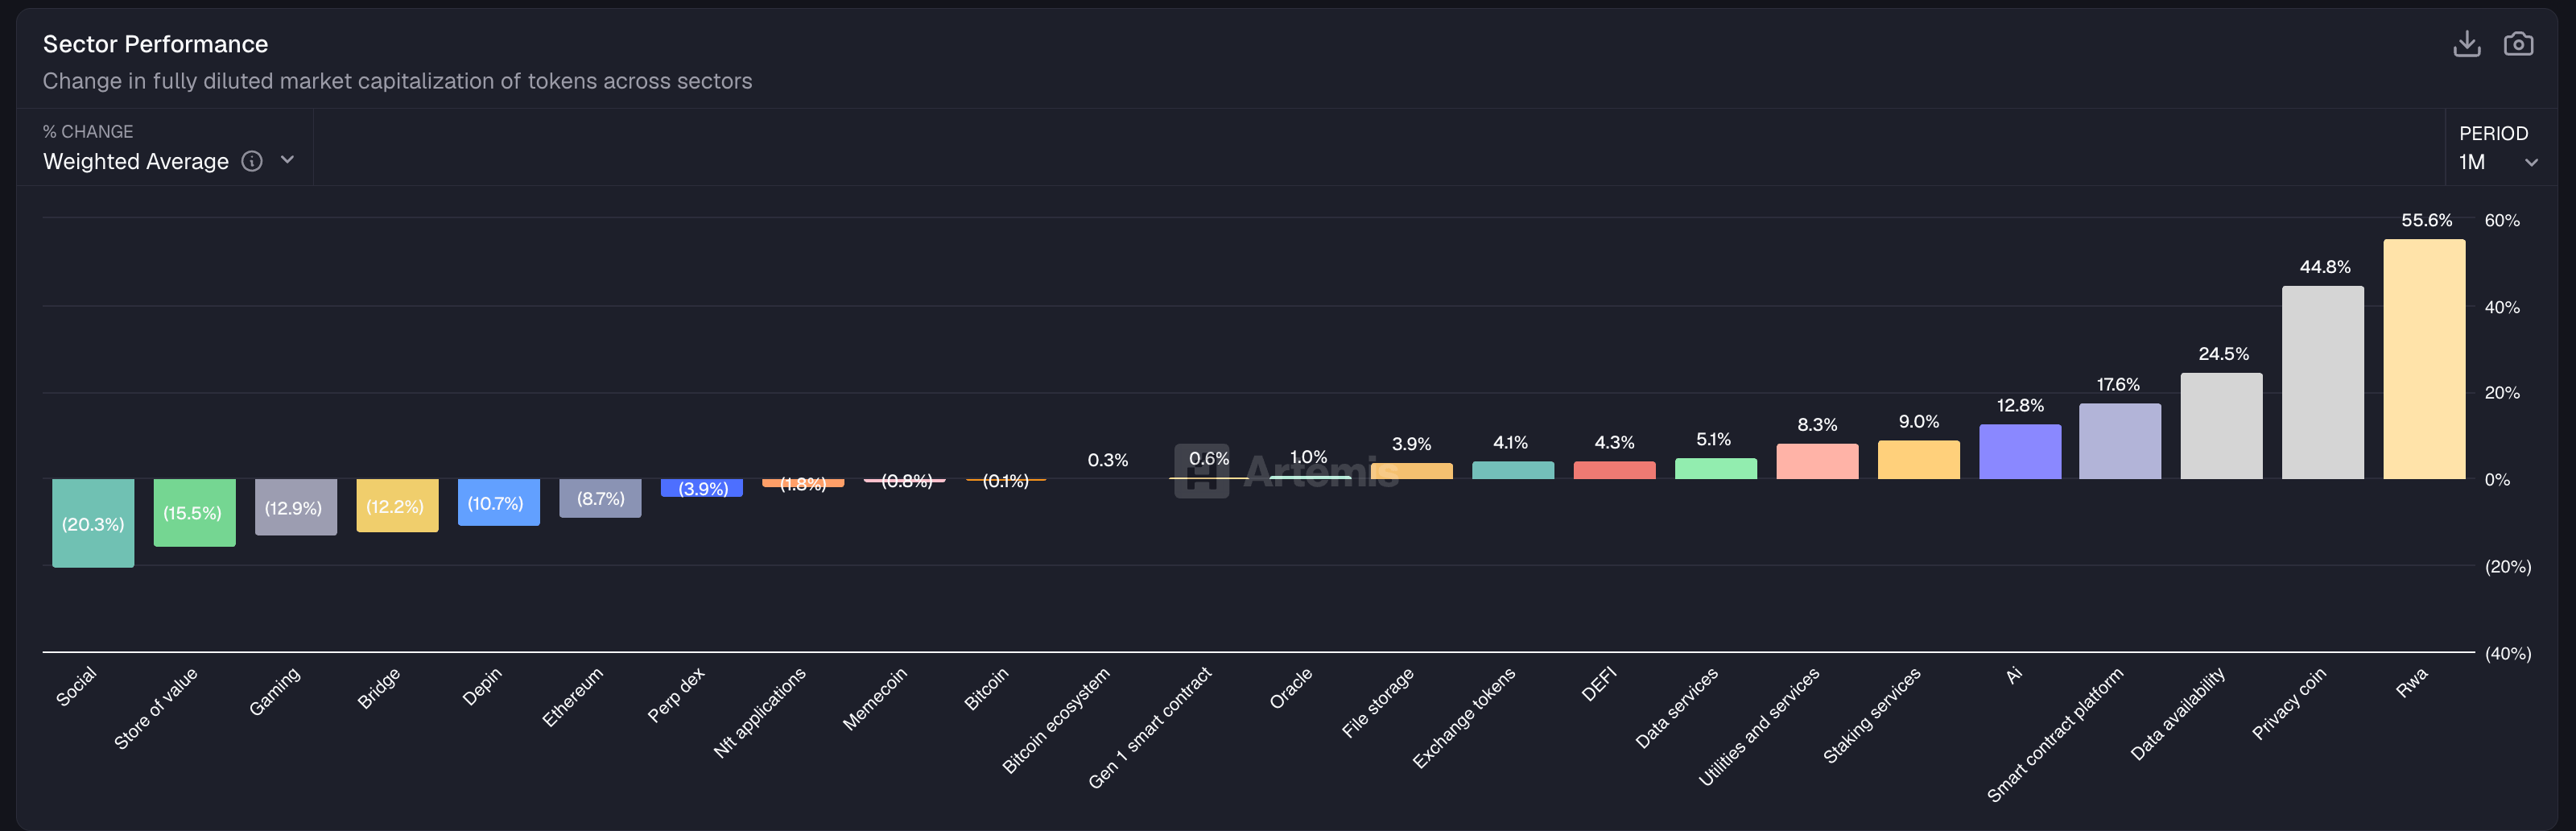
RWA tokenization is an on-chain representation of real-world assets such as gold, stocks, or credit, and is one of the leading growth narratives in the crypto market. Artemis data shows crypto-focused on RWAs surged over 55% last week, outperforming AI and privacy coins. The rise in tokenized RWAs on Solana could mirror a similar rally in Non-Fungible Tokens (NFTs), with real-world value, utility, and demand as the key differences.
RWA.xyz data positions Solana as the third-largest RWA ecosystem in the blockchain industry, with a DAV of $2.57 billion, excluding the stablecoins. The ecosystem DAV is up over 22% in the last 30 days, with the holders count of 225,649. However, RWA activity has slowed by more than 30% during the same period, with transfer volume down to $2.85 billion.
Institutions remain optimistic amid wobbling retail confidence
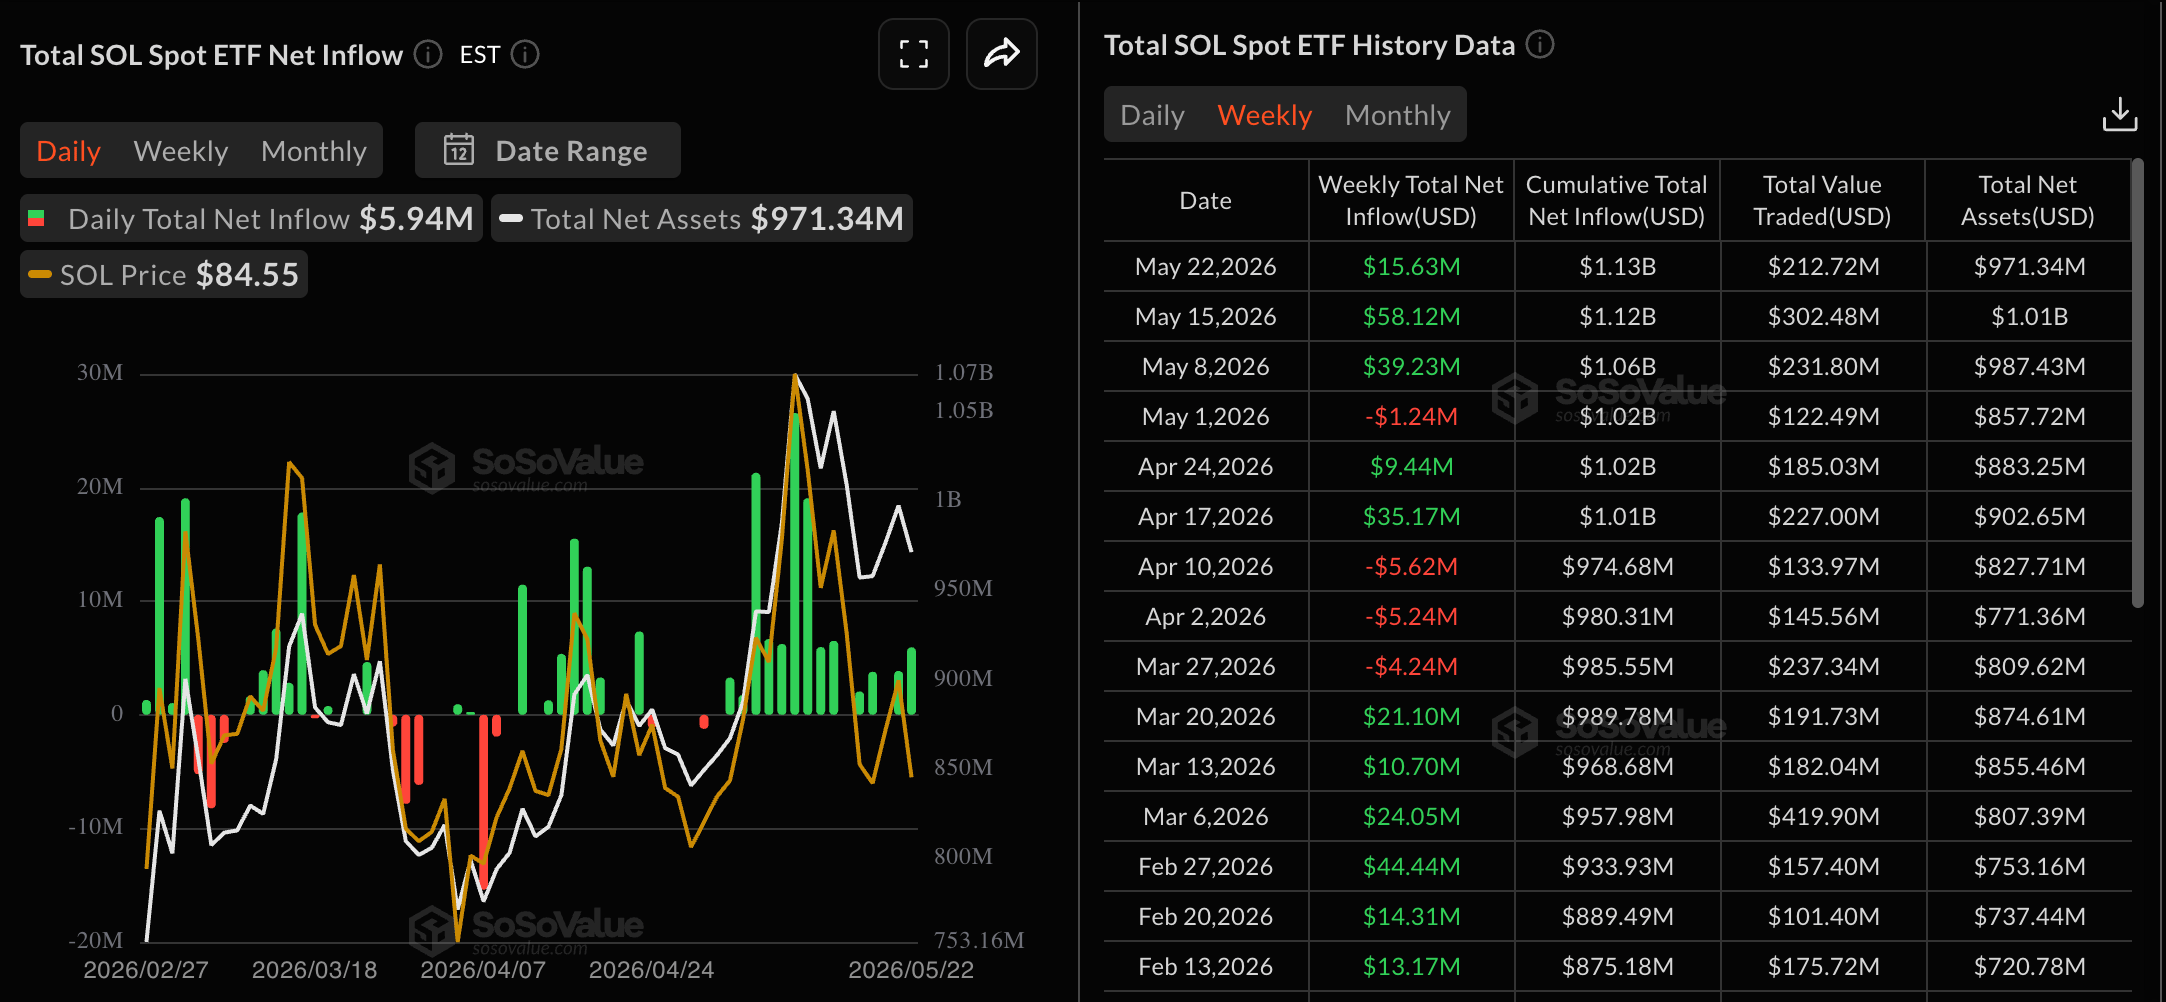
Institutional demand for Solana held steady last week, unlike the outflows in Bitcoin and Ethereum. Data shows the SOL-focused Exchange Traded Funds (ETFs) recorded $15.63 million in weekly inflows, marking their third consecutive positive week.
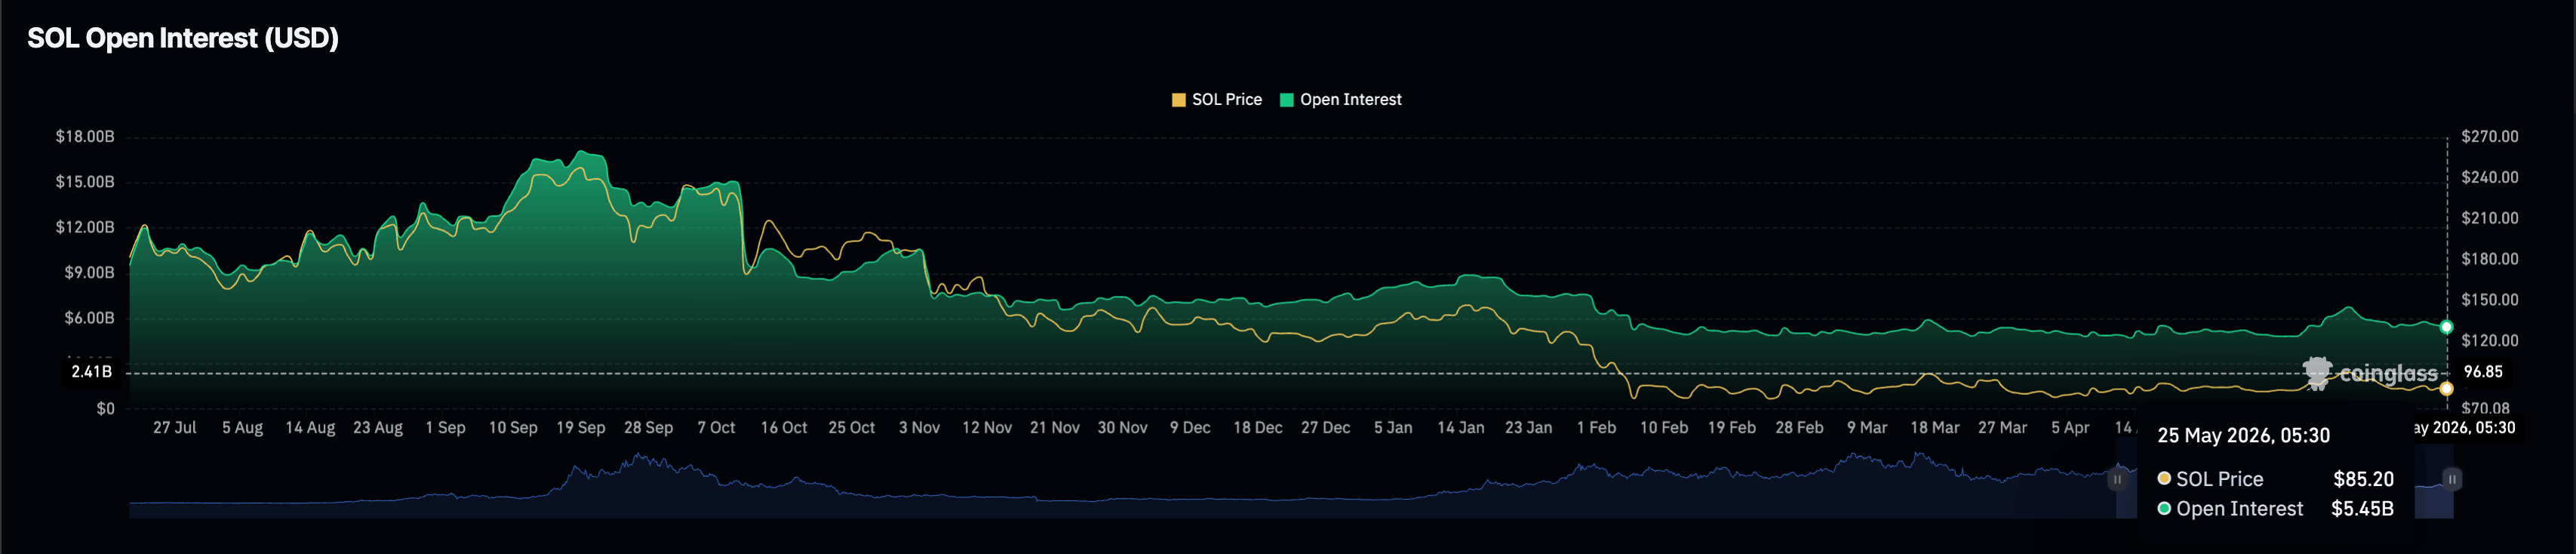
However, retail demand is losing confidence in the short term. A steady decline in the notional value of outstanding SOL futures contracts suggests reduced leverage-linked trading activity amid risk-off sentiment.
CoinGlass data shows the SOL futures Open Interest (OI) is at $5.45 billion, down from $5.54 billion on Sunday. The OI trend reflects continued downside after the May 12 high of $6.77 billion, which is significantly lower than the September 19 high of $17.10 billion.
Technical outlook: Will Solana break above its 50-day EMA?
Solana remains below the 50-day EMA at $87.35, maintaining a mild bearish bias in the near‑term, while the 100‑day EMA at $92.23 and 200-day EMA at $107.03 act as dynamic resistance overhead.
Momentum remains soft, with the Relative Strength Index (RSI) at 46 hovering just below the midline on the daily chart. Meanwhile, the Moving Average Convergence Divergence (MACD) is in negative territory but is preparing for a bullish crossover, suggesting that downside pressure is waning.
A decisive close above the 50‑day EMA around $87.35 would likely face a more meaningful barrier at the 100‑day EMA near $92.23, where any recovery rally would likely struggle. Above that, the $98.02 resistance level, which capped a four-day recovery earlier this month, defines the upper bound of the broader range.
Looking down, the short-term support for SOL lies at the May 17 low of $83.50, guarding the downside toward the February 5 low at $77.60.
(The technical analysis of this story was written with the help of an AI tool.)














