
Solana Price Forecast: SOL consolidates as spot ETF inflows near $1 billion signal institutional dip-buying
작성자 Manish Chhetri
게시일: 15 Dec 2025 | 수정일: 15 Dec 2025


인기 기사

Solana (SOL) price hovers above $131 at the time of writing on Monday, nearing the upper boundary of a falling wedge pattern, awaiting a decisive breakout.
- Solana price is nearing the upper trendline of a falling wedge pattern on Monday, breakout suggests a rally ahead.
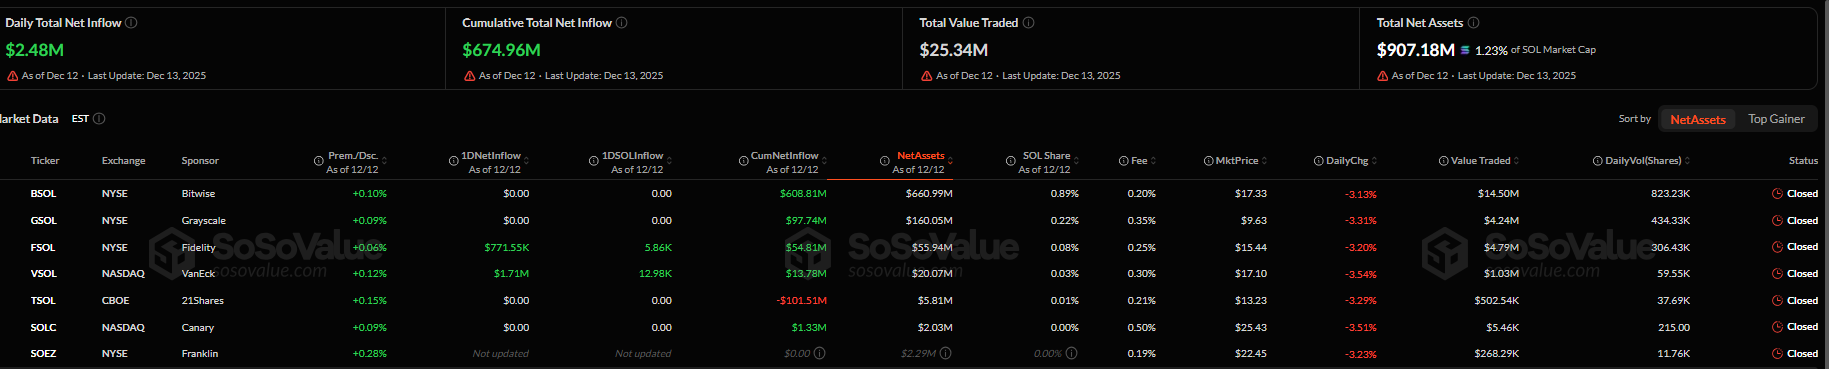
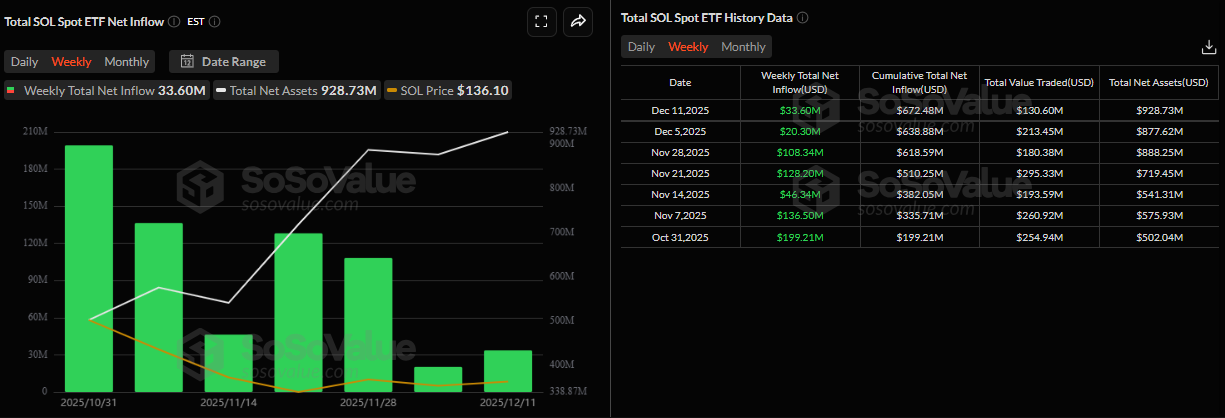
- US-listed spot Solana ETFs have recorded weekly net inflows since October 31, bringing total AUM to nearly $1 billion.
- The technical outlook favors an upside breakout, with a target above $160.
Solana (SOL) price hovers above $131 at the time of writing on Monday, nearing the upper boundary of a falling wedge pattern, awaiting a decisive breakout. On the institutional side, demand for spot Solana Exchange-Traded Funds (ETFs) remained firm, pushing total assets under management (AUM) to nearly $1 billion since launch. Moreover, the technical outlook suggests a potential upside breakout, with bulls aiming for levels above $160.
Institutional investors keep accumulating SOL
The institutional demand for SOL continues to grow since its launch on October 28. SoSoValue data shows that spot Solana ETFs have recorded positive net inflows every week since their launch, with total net assets reaching $907.18 million on Monday. This persistent ETF inflow, despite recent price consolidation, suggests institutions are buying dips rather than exiting positions, signaling a bullish outlook for SOL.
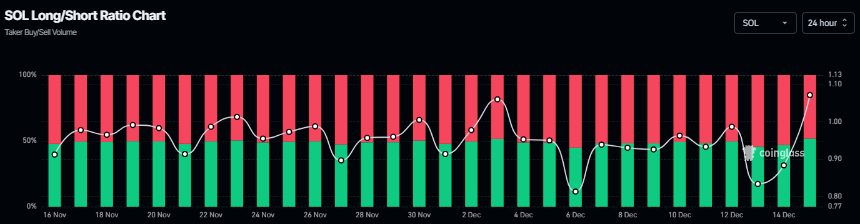
On the derivatives side, CoinGlass’s long-to-short ratio for SOL reads 1.07, the highest level in over a month. The ratio above one suggests bullish sentiment in the market, as traders are betting on the asset price to rally.
Solana Price Forecast: SOL on the verge of a breakout
Solana’s price has been trading within a falling wedge pattern (formed by connecting multiple highs and lows with two trendlines since early October). At the time of writing on Monday, SOL nears the upper trendline boundary of this pattern.
If SOL breaks above the pattern, it could extend the rally toward the next daily resistance at $160.
The Relative Strength Index (RSI) on the daily chart reads 42, pointing upward toward the neutral level of 50, indicating fading bearish momentum. For the bullish momentum to be sustained, the RSI must move above the neutral level.
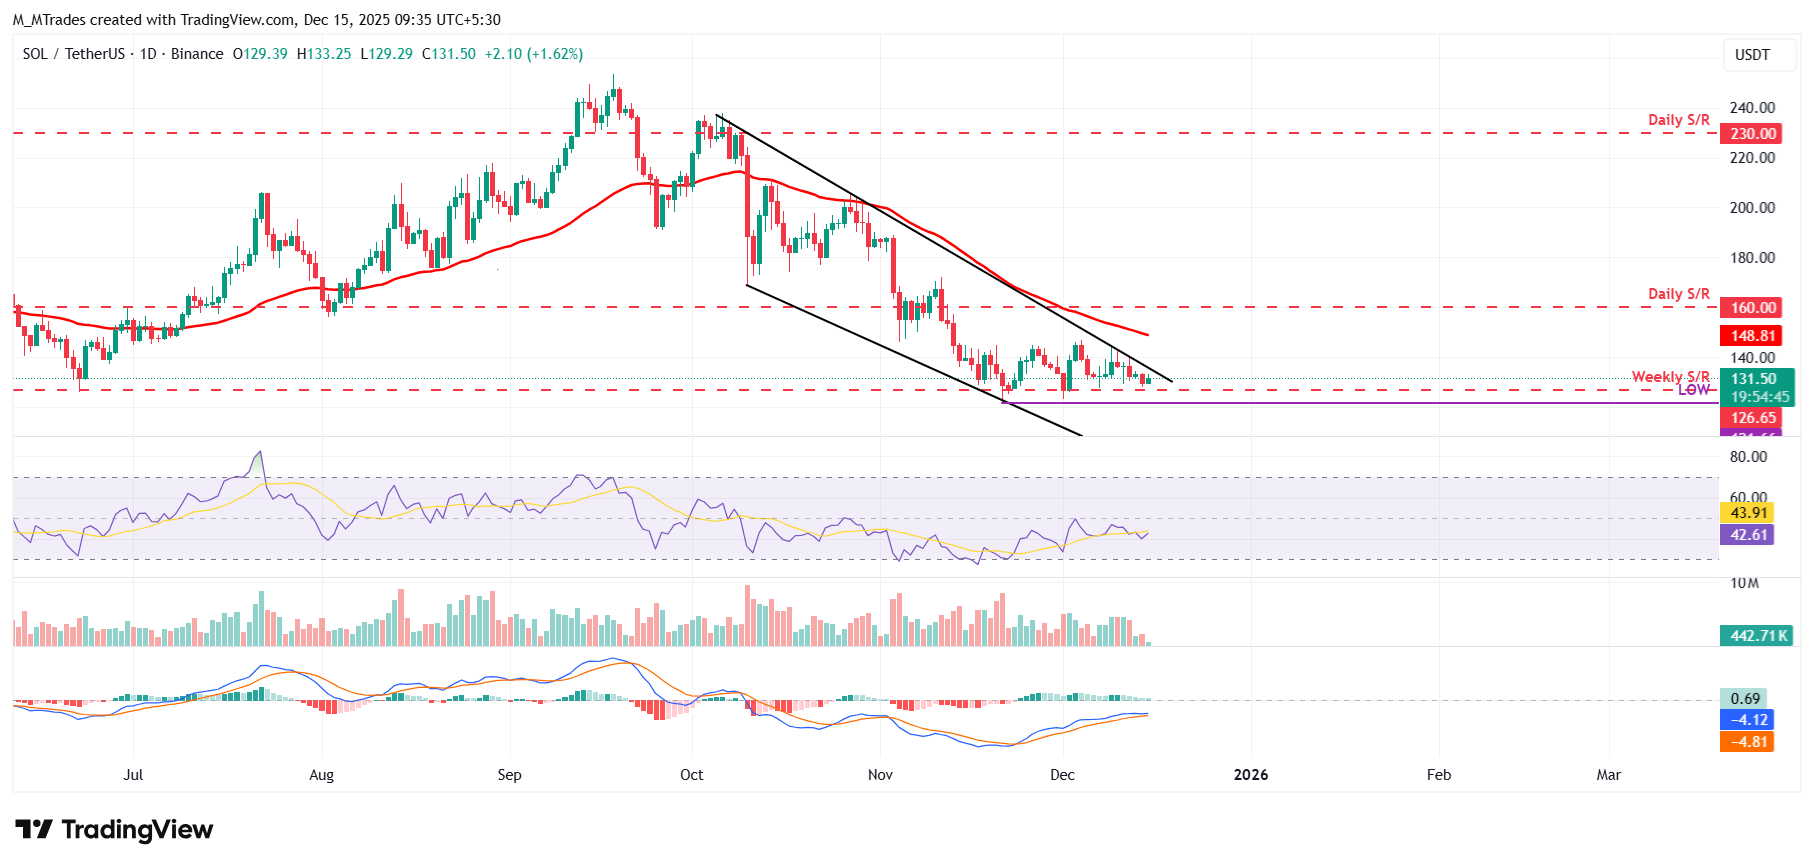
However, if SOL faces a correction, it could extend the decline toward the November 21 low of $121.66.

100만 명이 넘는 사용자가 FXStreet를 통해 실시간 시장 데이터, 차트 도구, 전문가 인사이트, 포렉스 뉴스를 이용합니다. 포괄적인 경제 캘린더와 교육 웨비나는 트레이더가 정보를 유지하고 신중한 결정을 내리도록 돕습니다. FXStreet는 바르셀로나 본사와 전 세계 지역에 걸쳐 약 60명의 팀으로 구성되어 있습니다.
더 읽기


