
Solana Price Forecast: SOL risks correction within descending wedge as bearish bets rise
작성자 Vishal Dixit
게시일: 30 Dec 2025 | 수정일: 30 Dec 2025


인기 기사

Solana (SOL) hovers above $120 at press time on Tuesday after a nearly 2% decline on Monday. The SOL-focused Exchange Traded Funds (ETFs) see renewed interest after recording their lowest weekly inflow last week.
- Solana holds above $120 following a nearly 2% decline on Monday, risking further correction in a descending wedge pattern.
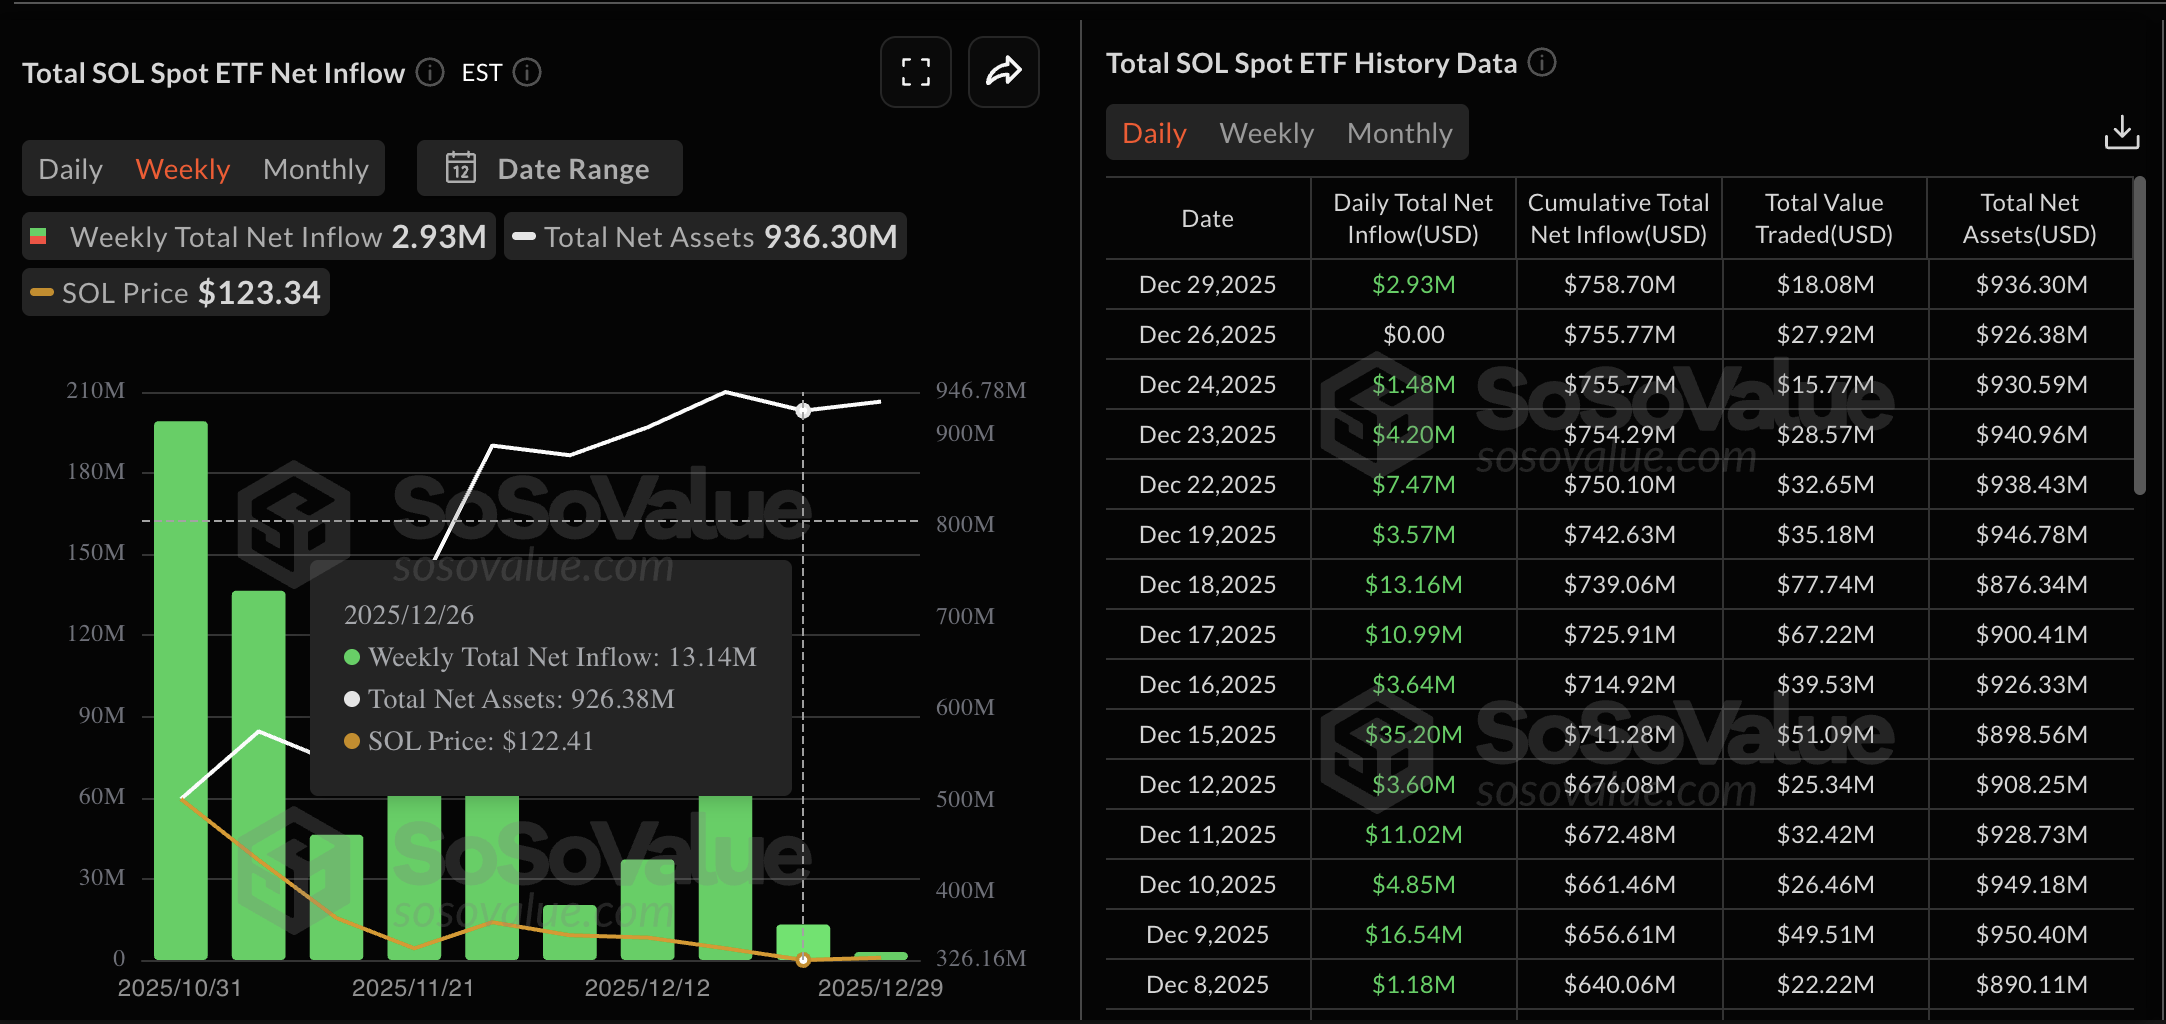
- Institutional confidence in Solana remains steady as ETFs extend their streak with a $2.93 million inflow on Monday.
- Derivatives data reveals fresh capital inflow amid rising bearish bets, indicating a sell-side dominance.
Solana (SOL) hovers above $120 at press time on Tuesday after a nearly 2% decline on Monday. The SOL-focused Exchange Traded Funds (ETFs) see renewed interest after recording their lowest weekly inflow last week. However, the derivatives data indicates a sell-side inclination in traders' sentiment amid rising SOL futures Open Interest.
Institutions bag SOL as retail sentiment falters
Solana ETFs recorded their lowest weekly collection of $13.14 million, down from $66.55 million the previous week, suggesting lower institutional interest amid broader cryptocurrency market volatility. Still, an inflow of $2.93 million on Monday, after a net-zero flow on Friday, reflects steady demand.
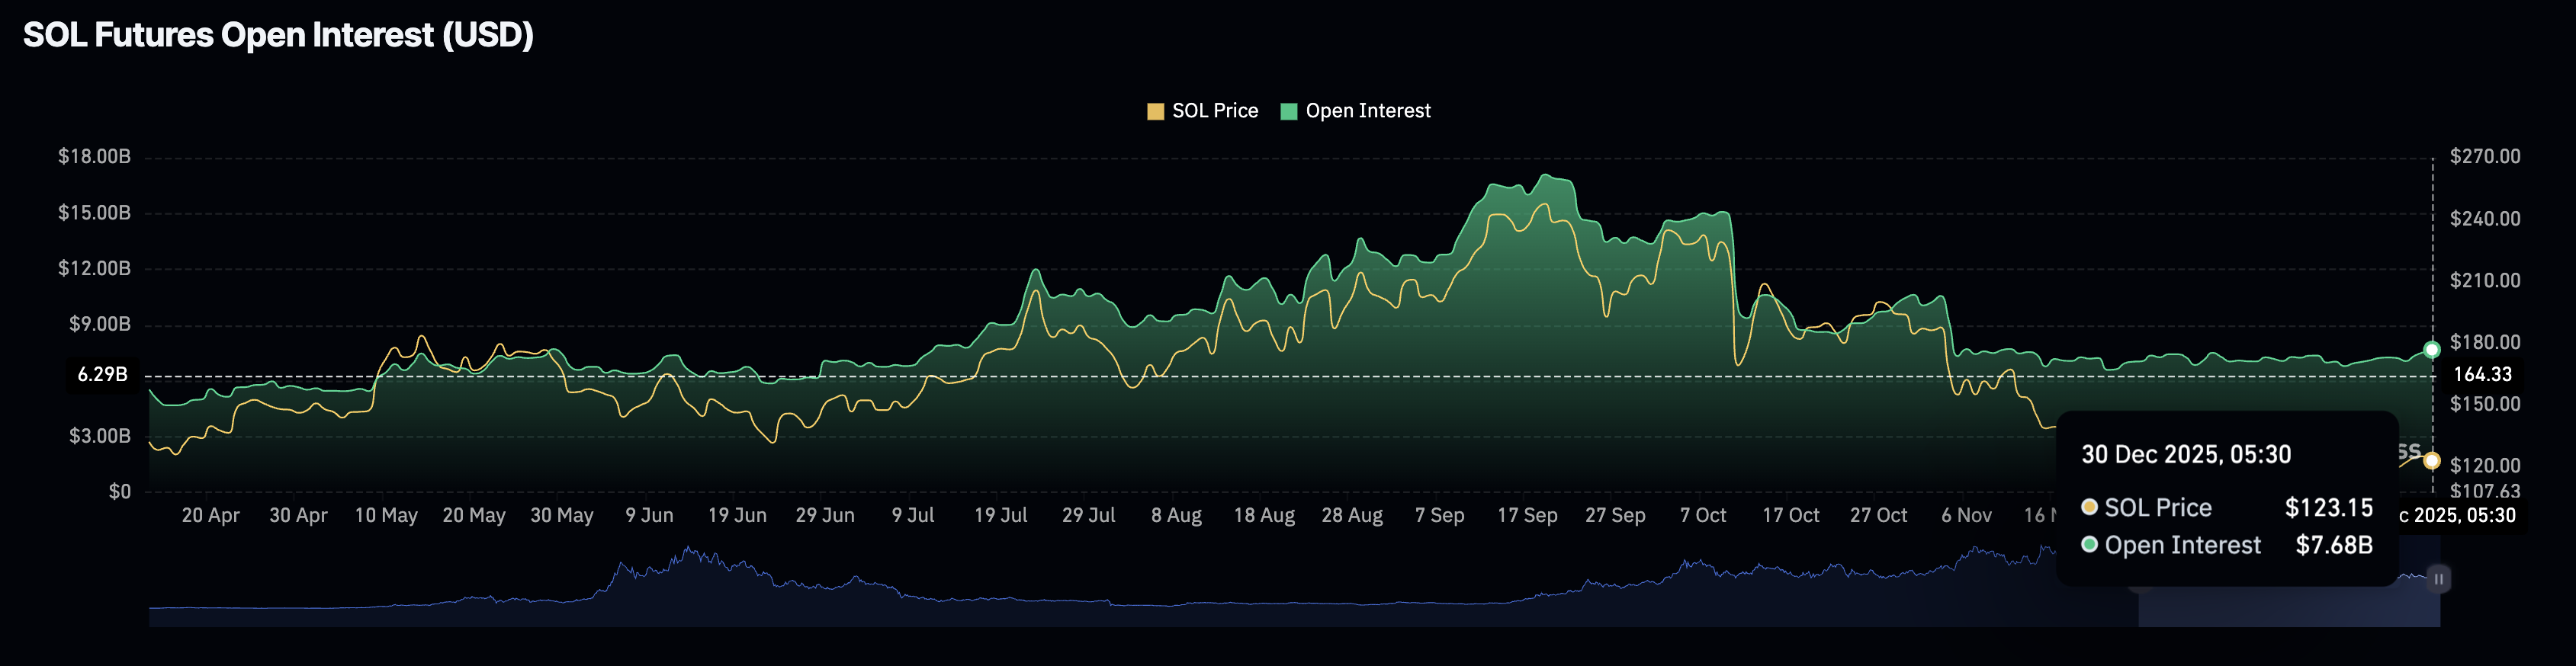
On the derivatives side, retail sentiment inclines to a sell-side strategy. CoinGlass data shows that the SOL futures Open Interest (OI) – total notional value of active positions – is at $7.68 billion on Monday, up from $7.54 billion on the previous day. This suggests that traders are pouring fresh capital into Solana derivatives.
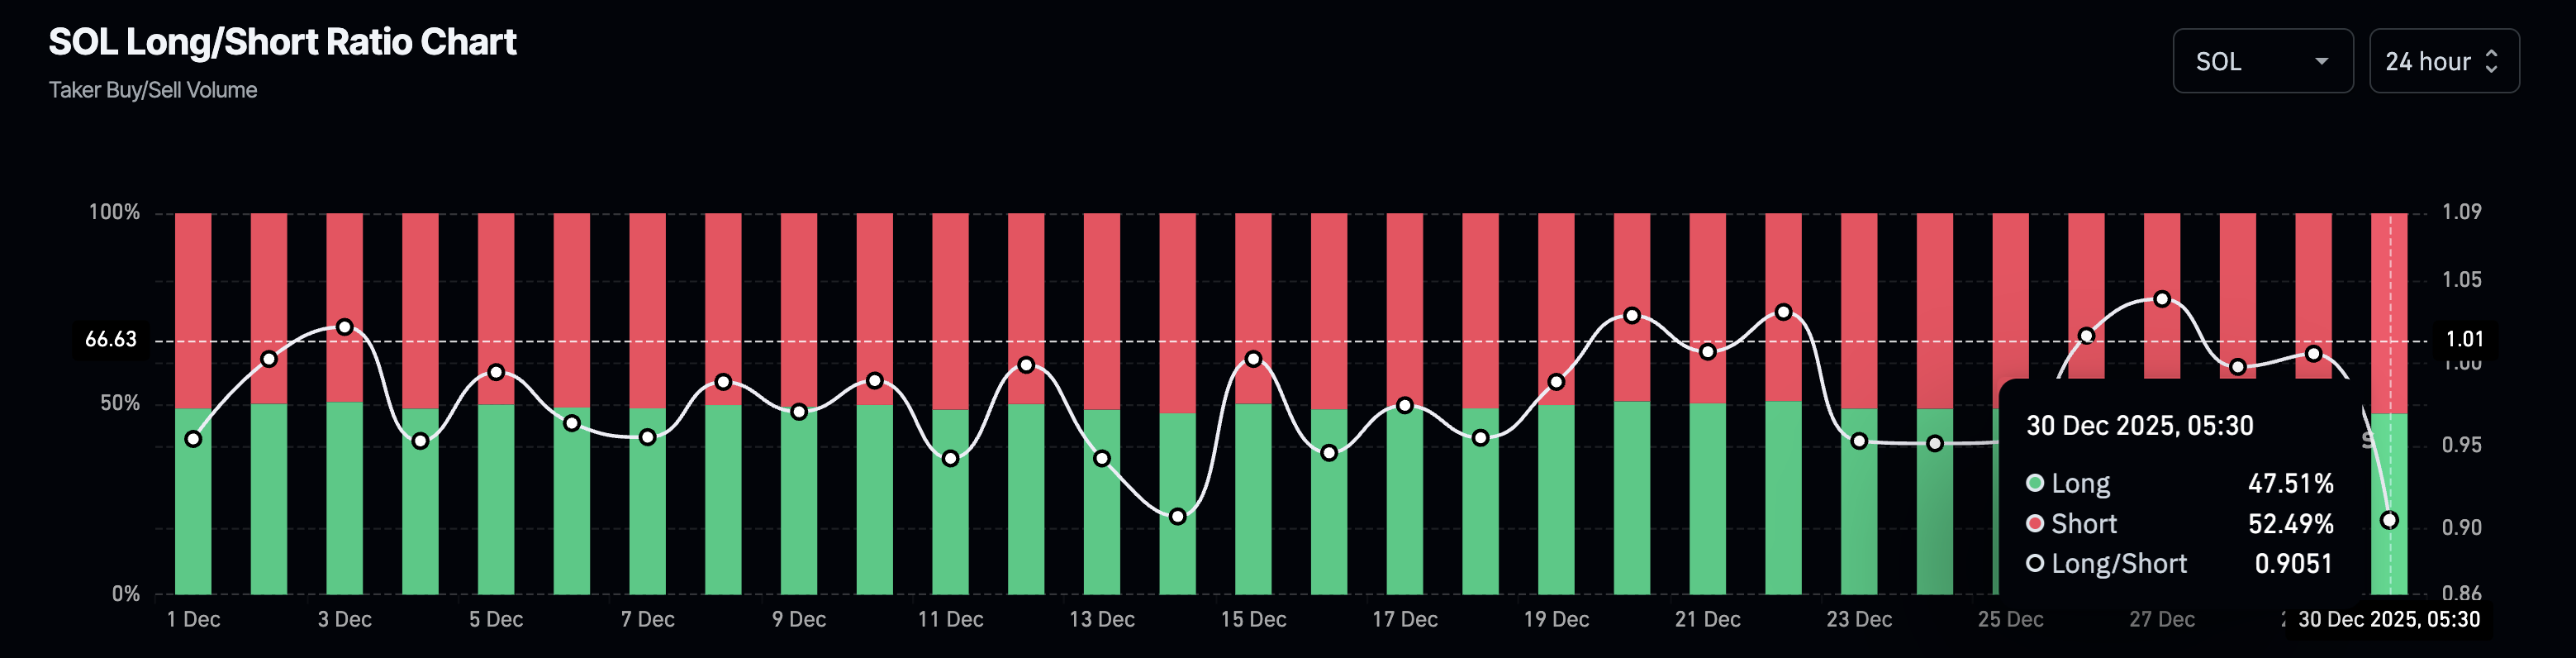
However, the long-to-short ratio reflects a bearish bias in active positions, suggesting that capital inflows may have fueled the short positional buildup. The short positions account for 52.49%, up from 49.85% over the last 24 hours.
Technical outlook: Could Solana bounce back?
Solana hovers near $120 within a descending wedge pattern formed by two converging trendlines on the daily chart. The reversal from $130 on Monday, which led to an almost 2% decline, risks a steeper correction toward the support trendline connecting the November 21 and December 18 lows, near $115.
If SOL drops below $115, it could test the S1 Pivot Point at $107, which serves as support, above the April 7 low at $95.
The momentum indicators on the daily chart remain mixed as Solana fluctuates between $120 and $125. The Relative Strength Index (RSI) at 41 extends a sideways trend below the 50% mark, indicating persistent bearish pressure.
At the same time, the Moving Average Convergence Divergence (MACD) bounces off the signal line toward the zero line, suggesting a boost in bullish momentum.
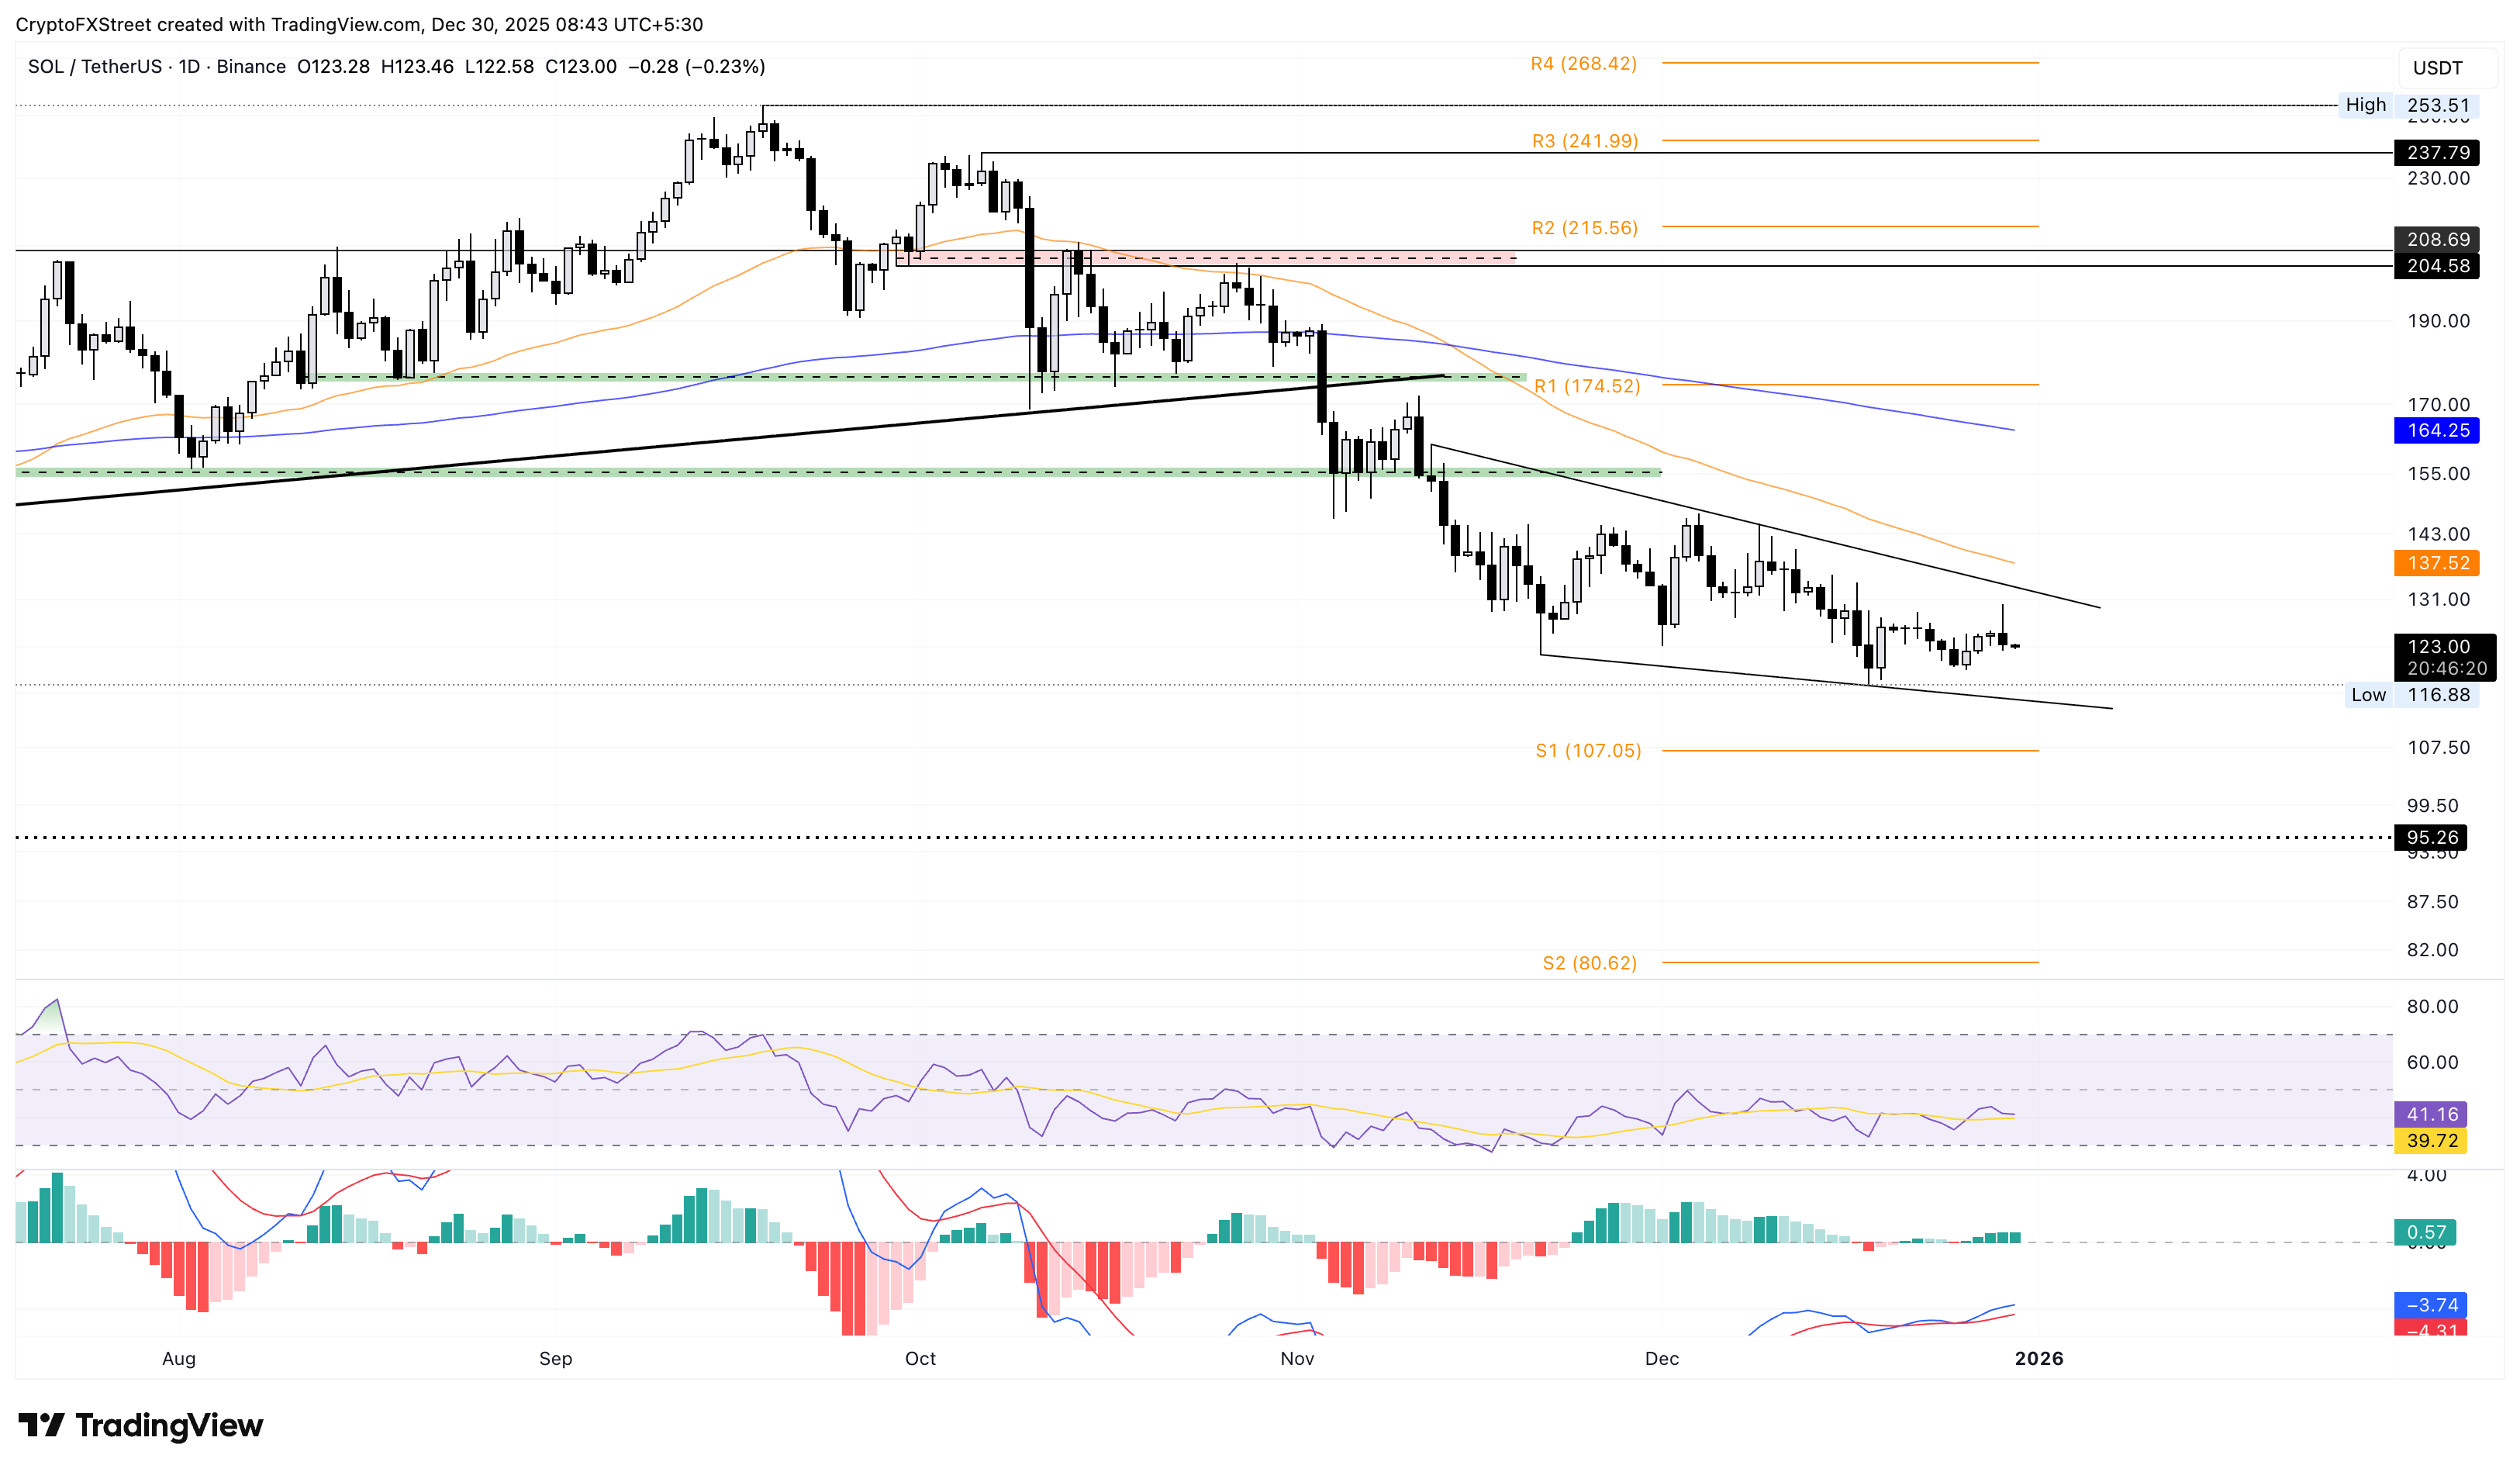
Looking up, if SOL exceeds the overhead trendline, connecting the November 12 and December 9 highs, near $133, it could test the 50-day Exponential Moving Average (EMA) at $137.

100만 명이 넘는 사용자가 FXStreet를 통해 실시간 시장 데이터, 차트 도구, 전문가 인사이트, 포렉스 뉴스를 이용합니다. 포괄적인 경제 캘린더와 교육 웨비나는 트레이더가 정보를 유지하고 신중한 결정을 내리도록 돕습니다. FXStreet는 바르셀로나 본사와 전 세계 지역에 걸쳐 약 60명의 팀으로 구성되어 있습니다.
더 읽기


