
Stellar Price Forecast: Correction deepens with bearish signals prevailing
작성자 Manish Chhetri
게시일: 5 Feb 2026 | 수정일: 5 Feb 2026


인기 기사

Stellar (XLM) price is extending its correction, trading below $0.167 at the time of writing on Thursday after being rejected at a key level. The derivatives data shows signs of weakness, with XLM’s short bets rising amid falling Open Interest (OI).
- Stellar price extends the correction on Thursday after a rejection at the previously broken trendline.
- Derivatives data indicates weakness, as short bets are rising alongside falling open interest.
- The technical outlook suggests bears are still in control, aiming for a deeper correction.
Stellar (XLM) price is extending its correction, trading below $0.167 at the time of writing on Thursday after being rejected at a key level. The derivatives data shows signs of weakness, with XLM’s short bets rising amid falling Open Interest (OI). On the technical side, bears remain in control, aiming for lower lows in XLM.
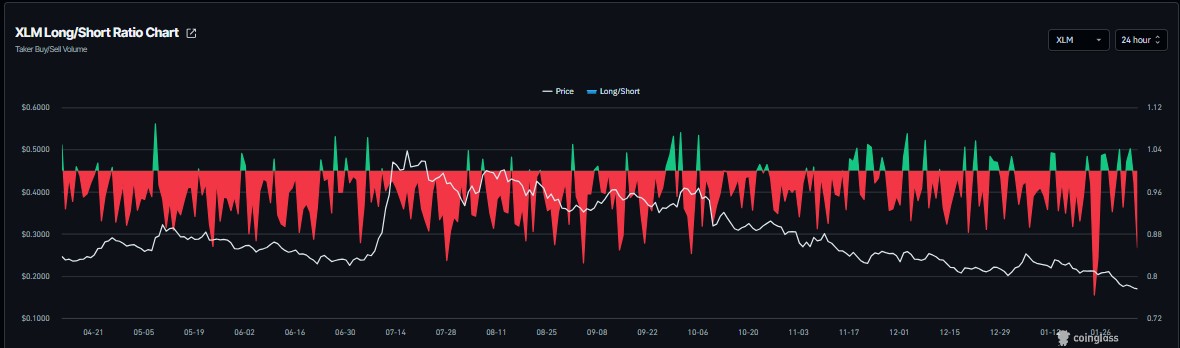
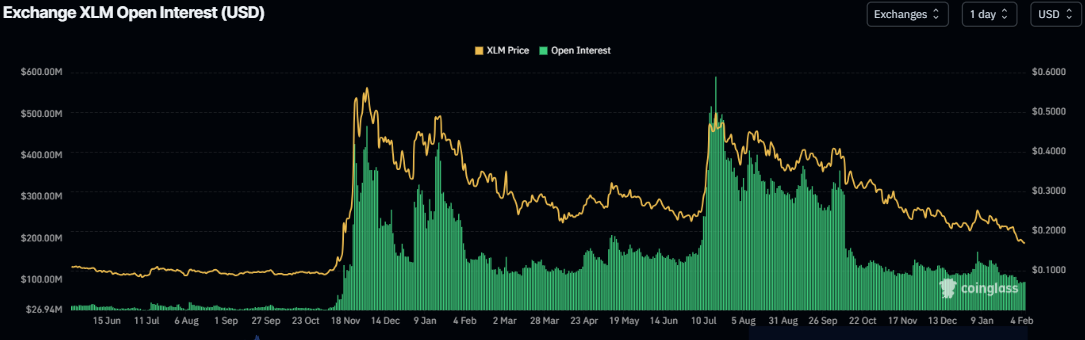
XLM’s derivatives data shows bearish bias
CoinGlass’s XLM long-to-short ratio stands at 0.85 on Thursday, nearing the lowest value in a month. This ratio, below one, reflects bearish sentiment in the markets, as more traders are betting on the asset price to fall.
In addition, Stellar’s futures OI dropped to $95 million on Thursday, the lowest level since November 2024, and has been steadily falling since the start of this year. This drop in OI reflects waning investor participation and projects a bearish outlook.
Stellar Price Forecast: XLM extends correction after closing below key support
Stellar price declined more than 13% last week, closing below the lower trendline of the falling wedge pattern on Saturday. XLM has been rejected around this broken trendline through Wednesday, extending losses to over 5%. As of Thursday, XLM is trading at $0.169.
If XLM continues its correction, it could extend the drop toward the 2025 yearly low of $0.160, set on October 10.
The Relative Strength Index (RSI) reads 26 on the daily chart, an oversold condition, indicating strong bearish momentum. The Moving Average Convergence Divergence (MACD) also showed a bearish crossover in mid-January, which remains intact with rising red histogram bars below the neutral level, further supporting the negative outlook.
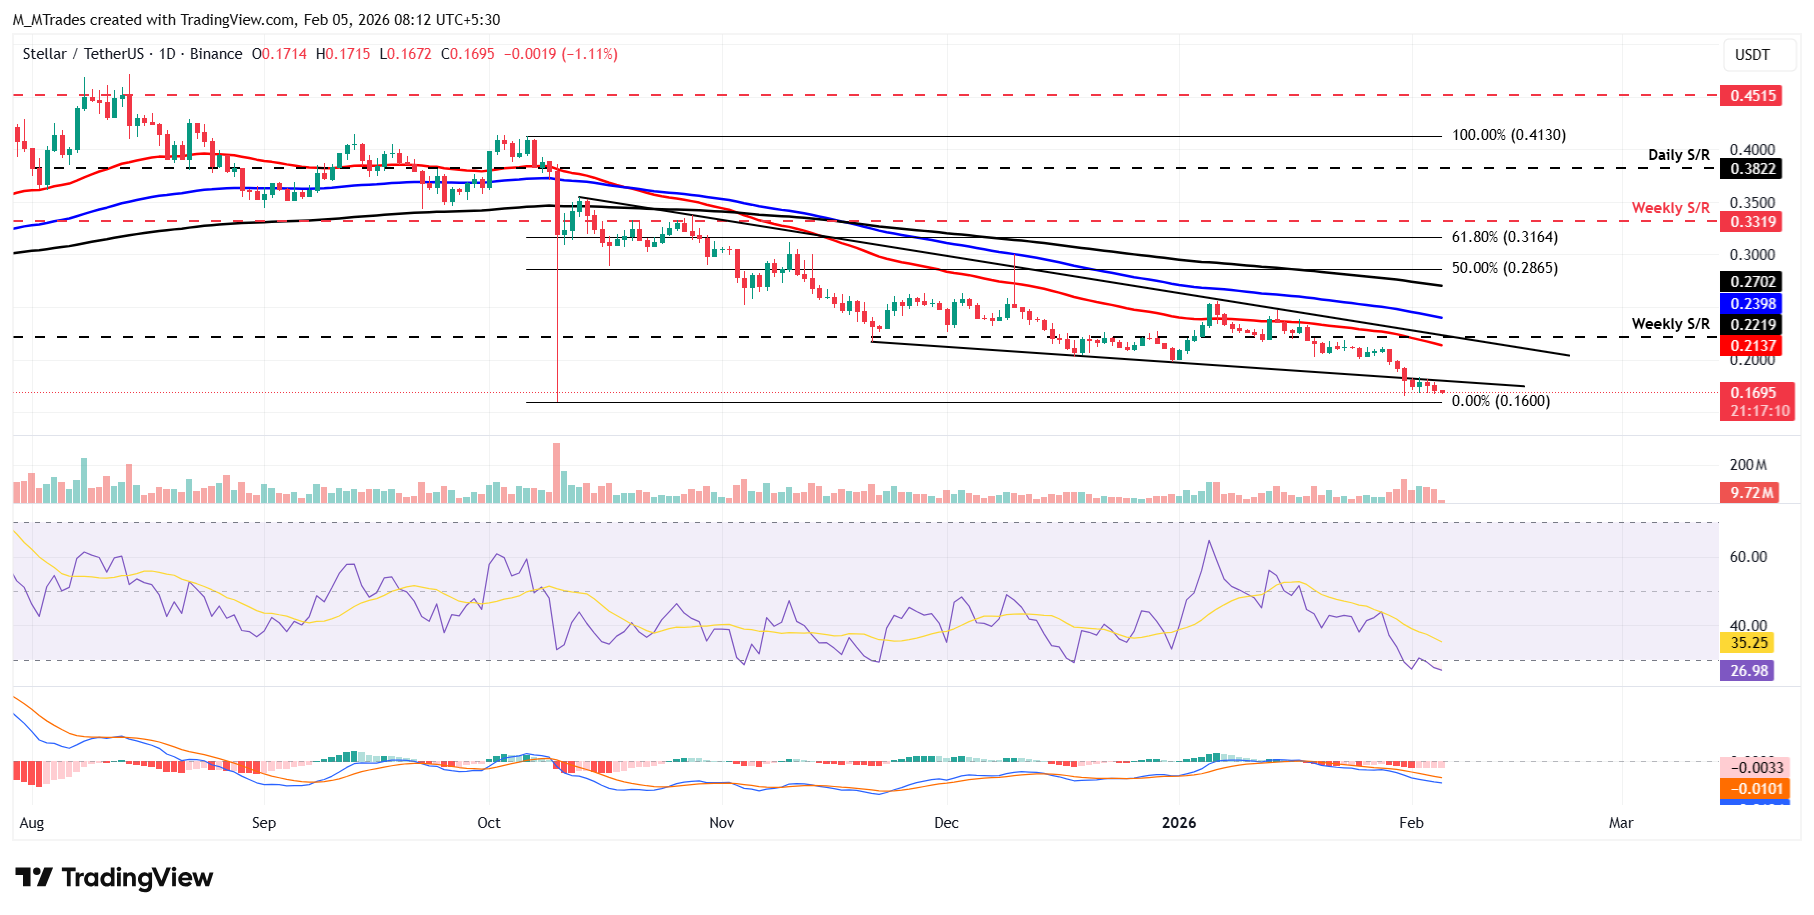
On the other hand, if XLM recovers, it could extend the advance toward the lower trendline boundary at around $0.180.

100만 명이 넘는 사용자가 FXStreet를 통해 실시간 시장 데이터, 차트 도구, 전문가 인사이트, 포렉스 뉴스를 이용합니다. 포괄적인 경제 캘린더와 교육 웨비나는 트레이더가 정보를 유지하고 신중한 결정을 내리도록 돕습니다. FXStreet는 바르셀로나 본사와 전 세계 지역에 걸쳐 약 60명의 팀으로 구성되어 있습니다.
더 읽기


