
Top 3 Price Prediction: Bitcoin, Ethereum, Ripple – BTC, ETH and XRP post cautious recovery amid downside risks
작성자 Manish Chhetri
게시일: 25 Feb 2026 | 수정일: 25 Feb 2026


인기 기사

Bitcoin (BTC), Ethereum (ETH), and Ripple (XRP) are posting a cautious recovery on Wednesday following a market correction earlier this week. BTC is approaching a key breakdown level, while ETH and XRP are rebounding from crucial support levels.
- Bitcoin price is nearing the previously broken lower consolidation boundary at $65,729, rejection suggests further correction ahead.
- Ethereum price rises 4% after finding support around the $1,800 level the previous day.
- XRP recovers slightly after retesting its weekly support at $1.30, though broader downside pressure remains intact.
Bitcoin (BTC), Ethereum (ETH), and Ripple (XRP) are posting a cautious recovery on Wednesday following a market correction earlier this week. BTC is approaching a key breakdown level, while ETH and XRP are rebounding from crucial support levels. Despite the short-term bounce in the top three cryptocurrencies, traders should be cautious as technical indicators suggest downside risks remain intact.
Bitcoin tests breakdown zone
Bitcoin price broke and closed below the lower consolidation boundary at $65,729 on Monday and declined slightly, hitting a daily low of $62,510 the next day. As of writing on Wednesday, BTC is testing this breakdown zone.
If BTC fails to close above the $65,729 breakdown level on a daily basis, it could extend the decline toward the key support level at $60,000.
The Relative Strength Index (RSI) reads 36, rebounding from the oversold territory, indicating fading bearish momentum. The Moving Average Convergence Divergence (MACD) showed a bullish crossover that remains intact, suggesting a positive outlook.
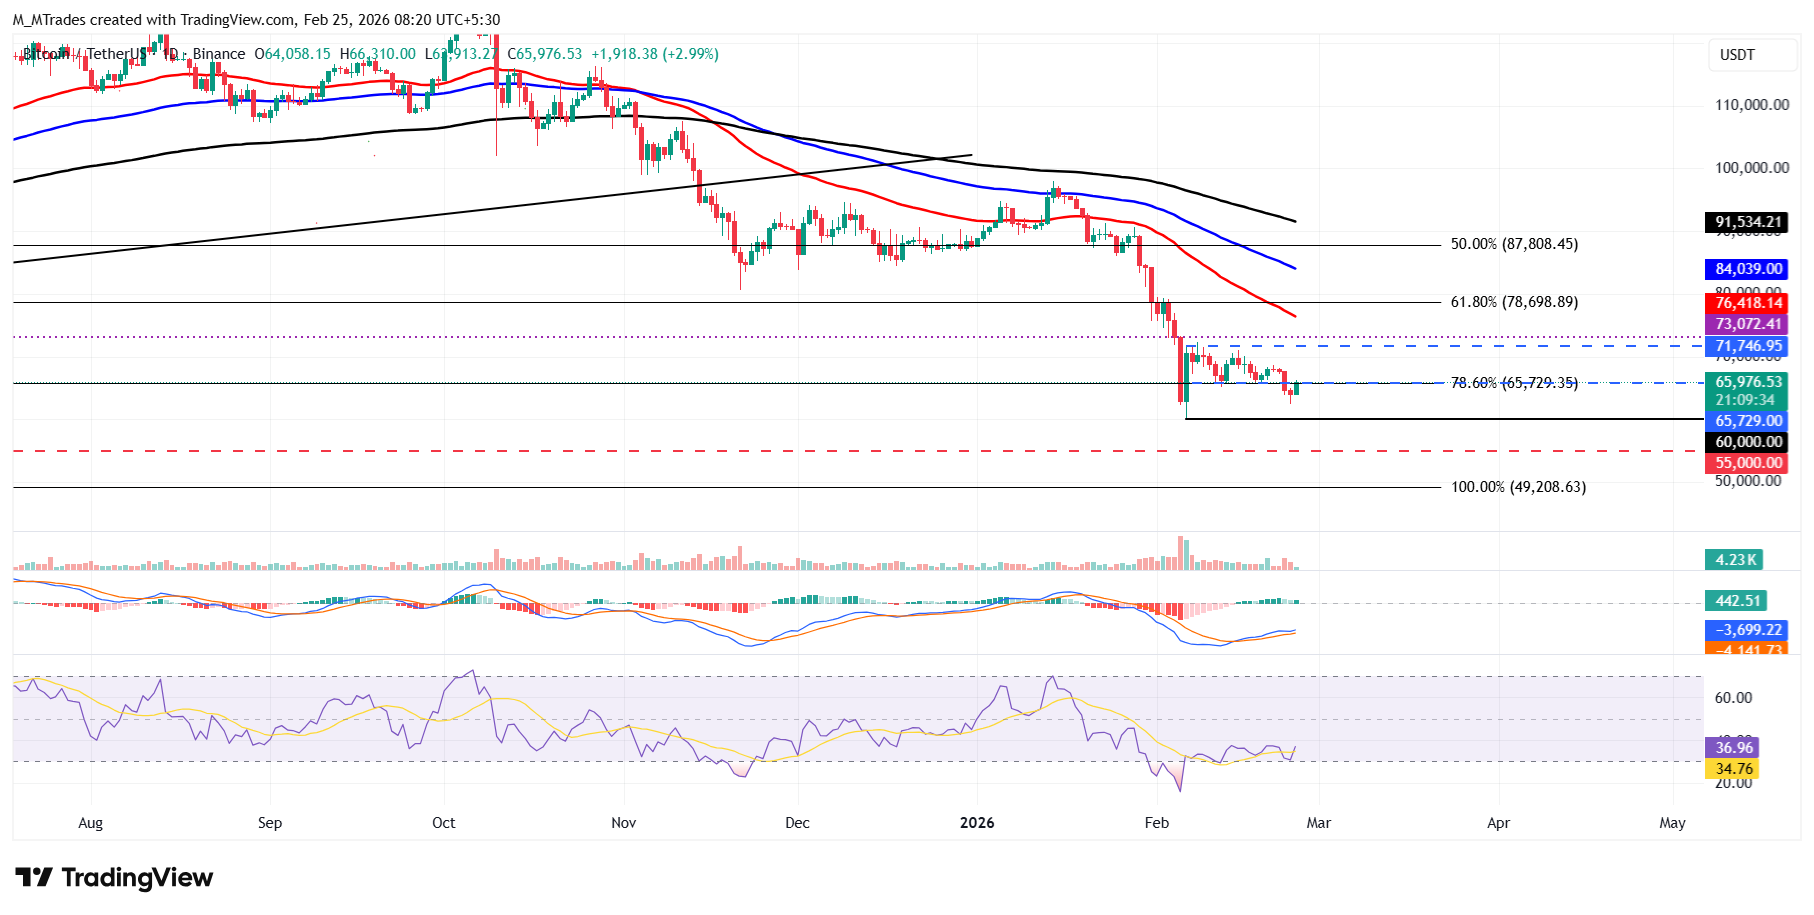
If BTC continues its recovery and closes above $65,729 on a daily basis, it could extend the advance toward the upper boundary of the mentioned consolidation range at $71,746.
Ethereum finds support around $1,800
Ethereum price corrected slightly during the previous week, extending its loss since mid-January. ETH continued its correction, falling 5.5% to test the key psychological level at $1,800 on Tuesday. As of writing on Wednesday, ETH is trading at $1,916.
If ETH continues its downward trend and closes below $1,800, it could extend the decline toward the lower consolidation range at $1,747. A firm close below this level could extend further losses toward the daily support at $1,669.
Like Bitcoin, Ethereum’s momentum indicators show mixed signals: the RSI indicates fading bearish momentum, while the MACD is showing a bullish crossover.
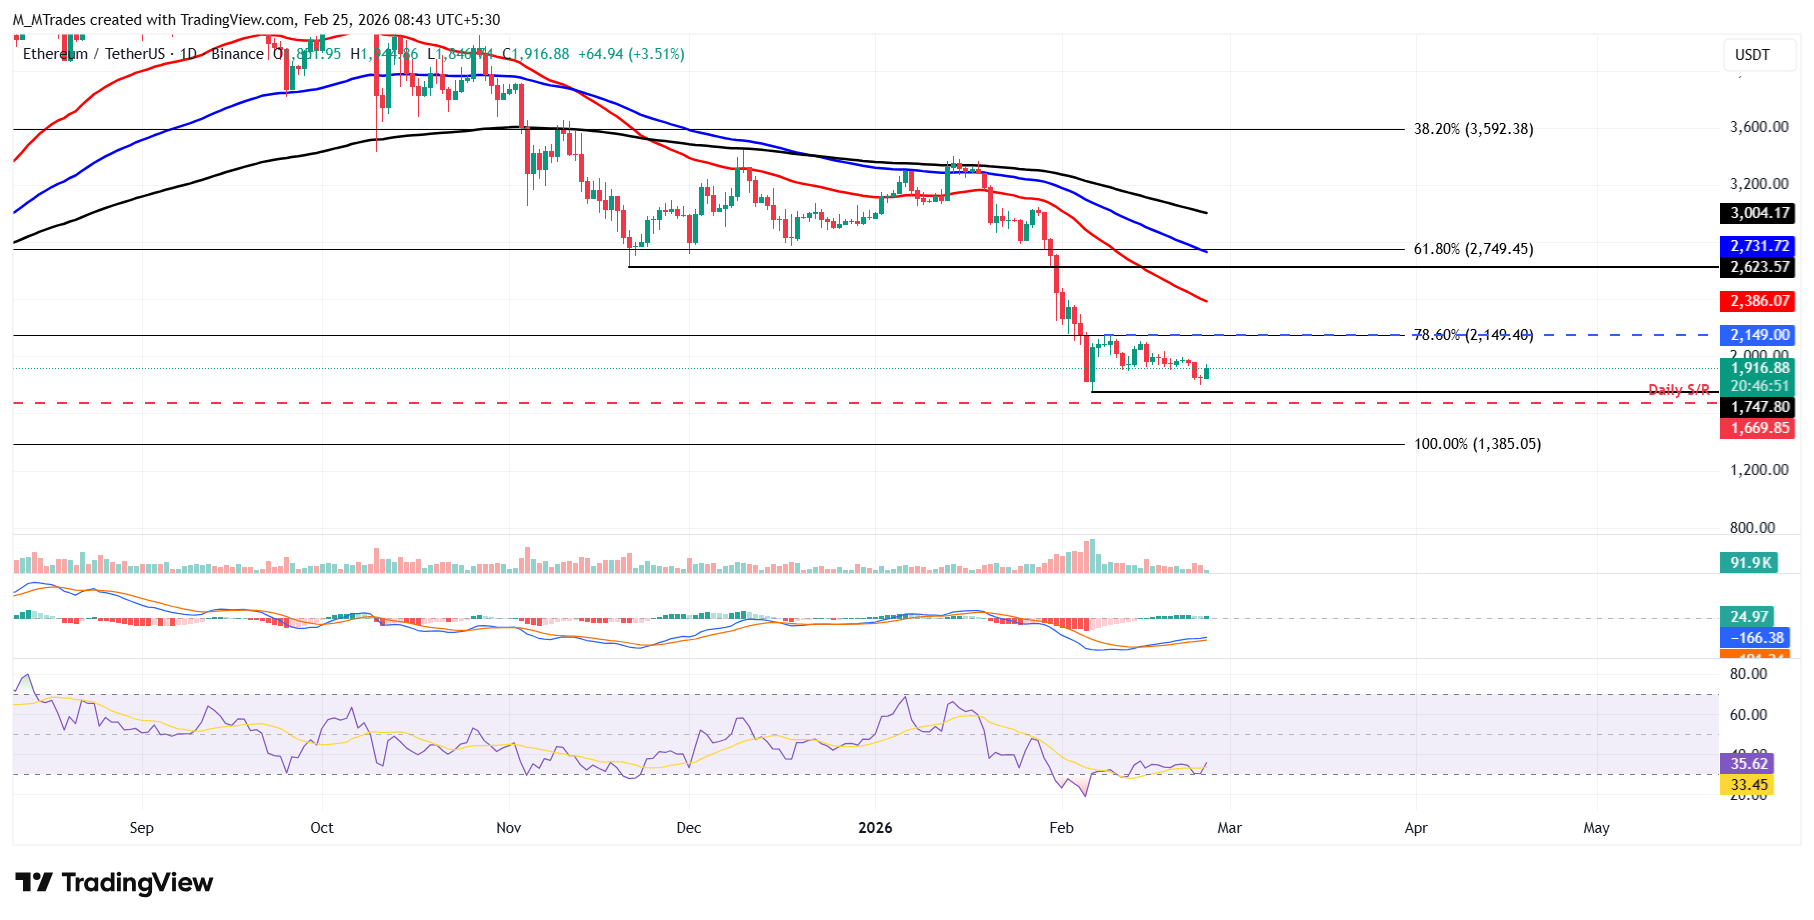
However, if ETH recovers, it could extend the advance toward the upper consolidation range at $2,149.
XRP revisits its lower trendline boundary
XRP price closed below the lower trendline boundary of a falling wedge on Monday and declined slightly, nearing the weekly support at $1.30 the next day. As of Wednesday, XRP is recovering slightly, revisiting this broken trendline.
If XRP fails to find support around the trendline and corrects, it could extend the decline toward the weekly support at $1.30. A close below this level could extend the losses toward the February 6 low of $1.11.
Like Bitcoin and Ethereum, XRP’s momentum indicators also show mixed signals: the RSI indicates fading bearish momentum, while the MACD is showing a bullish crossover.
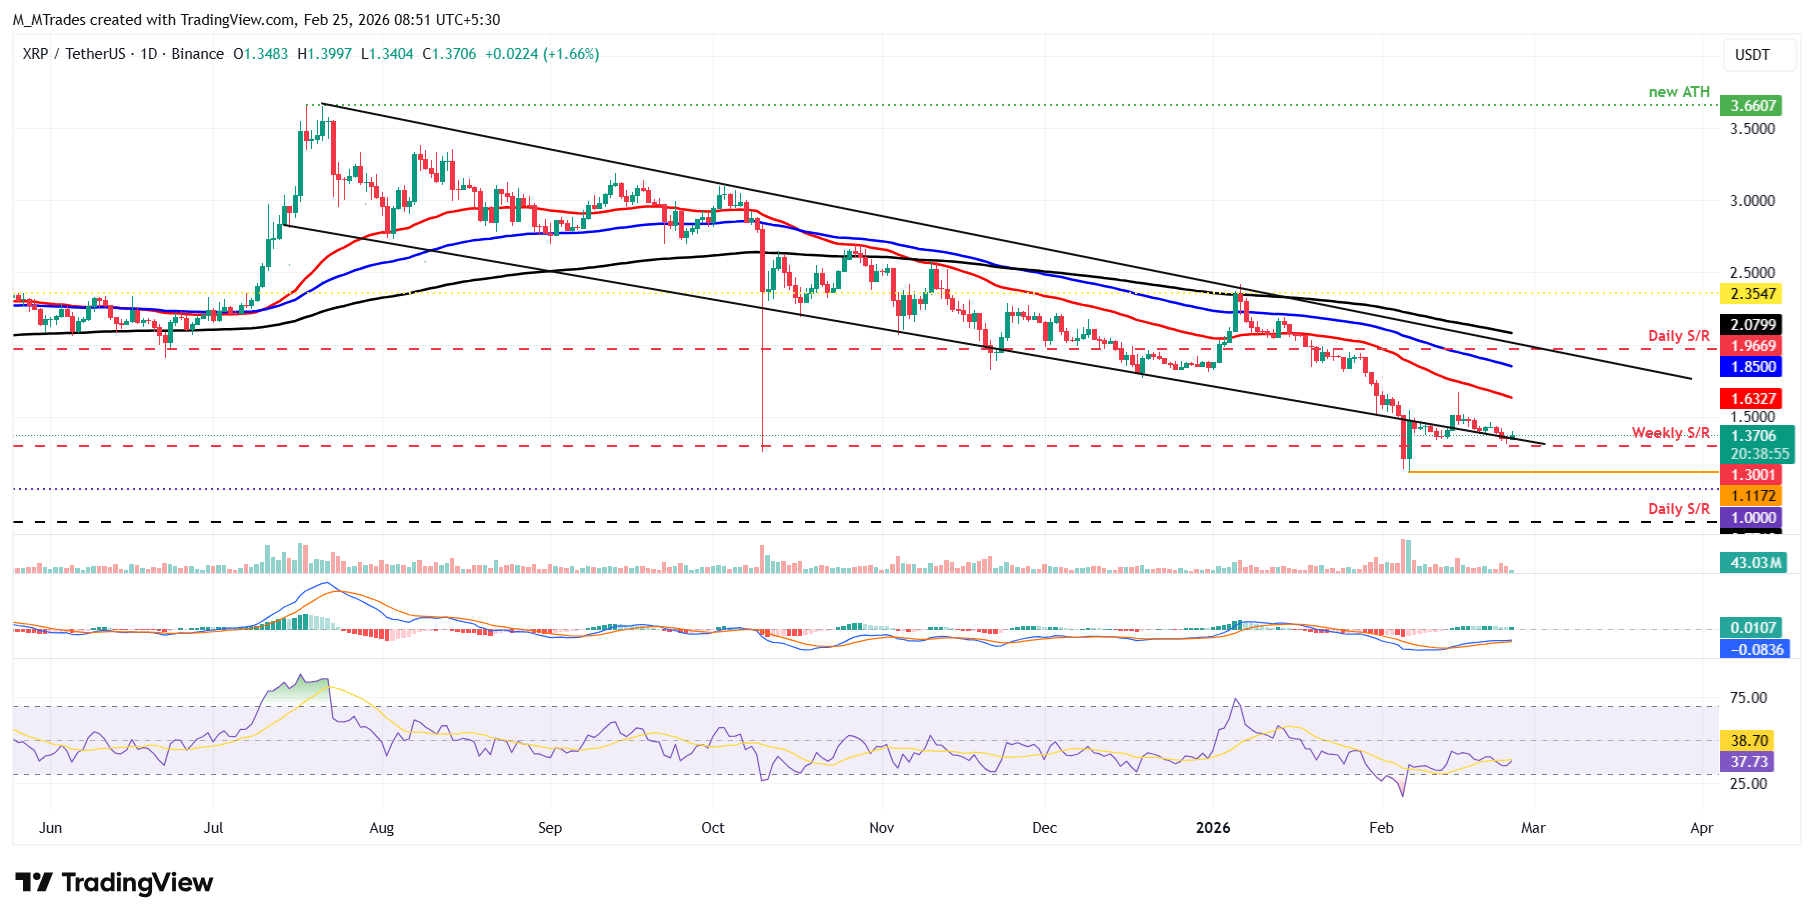
Conversely, if the lower trendline boundary holds as support, it could extend the recovery toward the key psychological level at $1.50.
Cryptocurrency metrics FAQs
The developer or creator of each cryptocurrency decides on the total number of tokens that can be minted or issued. Only a certain number of these assets can be minted by mining, staking or other mechanisms. This is defined by the algorithm of the underlying blockchain technology. On the other hand, circulating supply can also be decreased via actions such as burning tokens, or mistakenly sending assets to addresses of other incompatible blockchains.
Market capitalization is the result of multiplying the circulating supply of a certain asset by the asset’s current market value.
Trading volume refers to the total number of tokens for a specific asset that has been transacted or exchanged between buyers and sellers within set trading hours, for example, 24 hours. It is used to gauge market sentiment, this metric combines all volumes on centralized exchanges and decentralized exchanges. Increasing trading volume often denotes the demand for a certain asset as more people are buying and selling the cryptocurrency.
Funding rates are a concept designed to encourage traders to take positions and ensure perpetual contract prices match spot markets. It defines a mechanism by exchanges to ensure that future prices and index prices periodic payments regularly converge. When the funding rate is positive, the price of the perpetual contract is higher than the mark price. This means traders who are bullish and have opened long positions pay traders who are in short positions. On the other hand, a negative funding rate means perpetual prices are below the mark price, and hence traders with short positions pay traders who have opened long positions.

100만 명이 넘는 사용자가 FXStreet를 통해 실시간 시장 데이터, 차트 도구, 전문가 인사이트, 포렉스 뉴스를 이용합니다. 포괄적인 경제 캘린더와 교육 웨비나는 트레이더가 정보를 유지하고 신중한 결정을 내리도록 돕습니다. FXStreet는 바르셀로나 본사와 전 세계 지역에 걸쳐 약 60명의 팀으로 구성되어 있습니다.
더 읽기


