
Top 3 Price Prediction: Bitcoin, Ethereum, Ripple – BTC pauses recovery, ETH holds key support, XRP nears breakout zone
작성자 Manish Chhetri
수정됨: 17 Jun 2026


인기 기사

Bitcoin (BTC), Ethereum (ETH) and Ripple (XRP) are showing mixed signals on Wednesday as assets struggle to build a unified direction after their recent recoveries. BTC paused its rebound near $66,000, while ETH holds above a key support zone, keeping bullish hopes alive.
- Bitcoin pauses its recovery and steadies at $66,000 on Wednesday.
- Ethereum remains resilient above the $1,800 support level, keeping the door open for further rebound.
- XRP approaches the upper boundary of a falling channel, a breakout and close above suggest further gains.
Bitcoin (BTC), Ethereum (ETH) and Ripple (XRP) are showing mixed signals on Wednesday as assets struggle to build a unified direction after their recent recoveries. BTC paused its rebound near $66,000, while ETH holds above a key support zone, keeping bullish hopes alive. Meanwhile, XRP edges closer to a critical resistance zone, where a breakout move could open the door for further upside momentum.
Bitcoin rebound pauses near key level
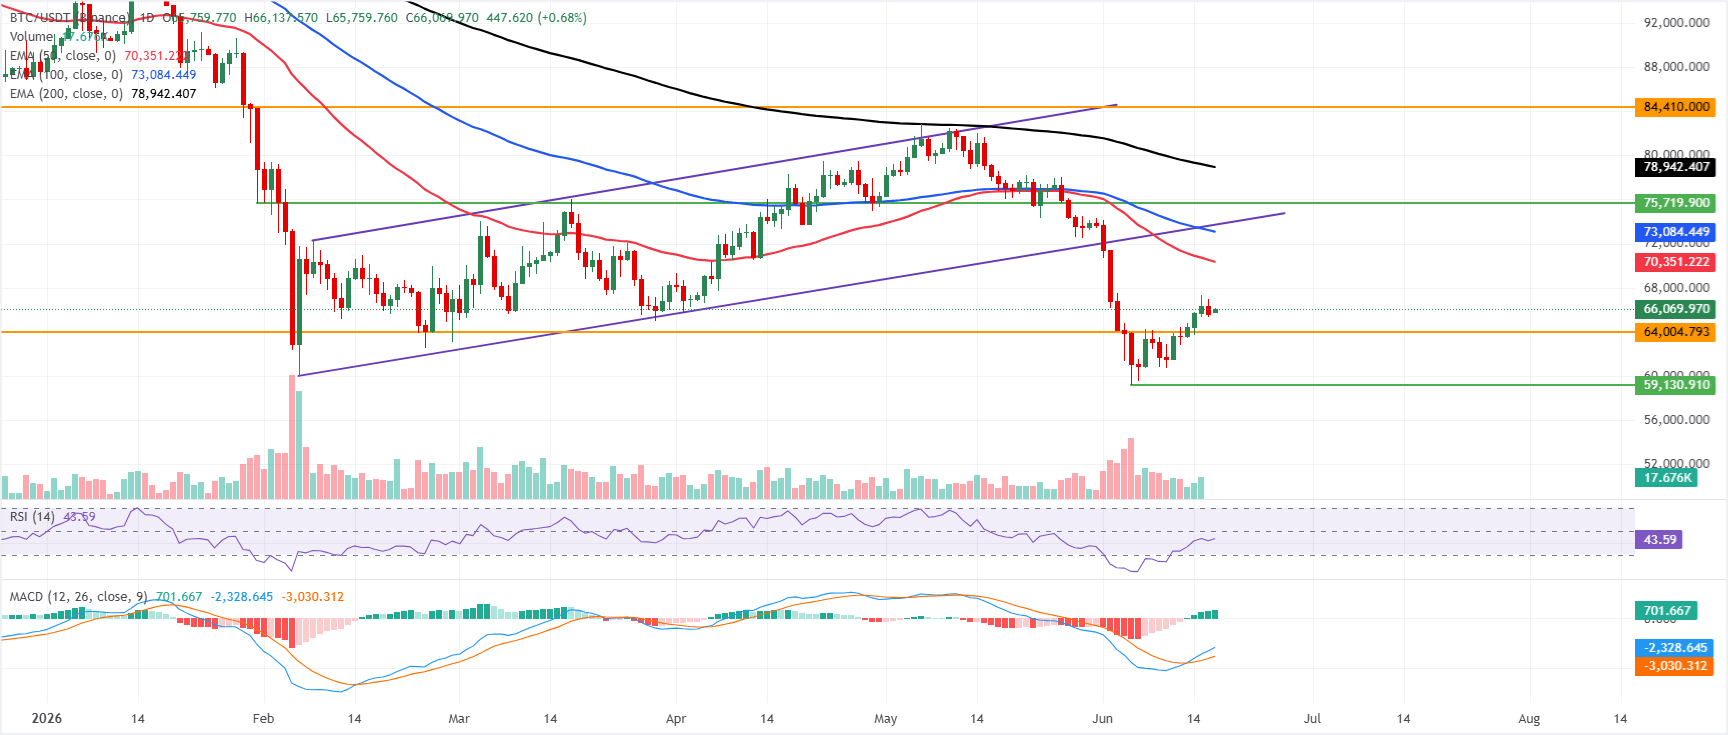
Bitcoin price trades at $66,000 on Wednesday, pausing after its recent rebound. BTC sits below the 50-day Exponential Moving Average (EMA) at $70,351 and the 100-day EMA at $73,084, while the 200-day EMA at $78,942 remains a distant cap, suggesting rallies are likely to face overhead supply.
The Relative Strength Index (RSI) on the daily chart is hovering in the low-40s, hinting at subdued bullish conviction despite a positive Moving Average Convergence Divergence (MACD) reading above zero, which merely signals that the latest rebound is corrective within a broader capped structure.
On the topside, initial resistance is seen at the 50-day EMA near $70,351, followed by the 100-day EMA at $73,084 and the broken upward trendline region around $73,715, which together form a dense barrier for buyers. Beyond that, the 200-day EMA at $78,942 and the horizontal resistance level at $84,410 act as higher-limit caps if upside momentum extends.
On the downside, immediate support is located at the horizontal level near $64,005, where a decisive break would expose a deeper retracement and reinforce the prevailing bearish tone.
Ethereum holds strong above the support zone
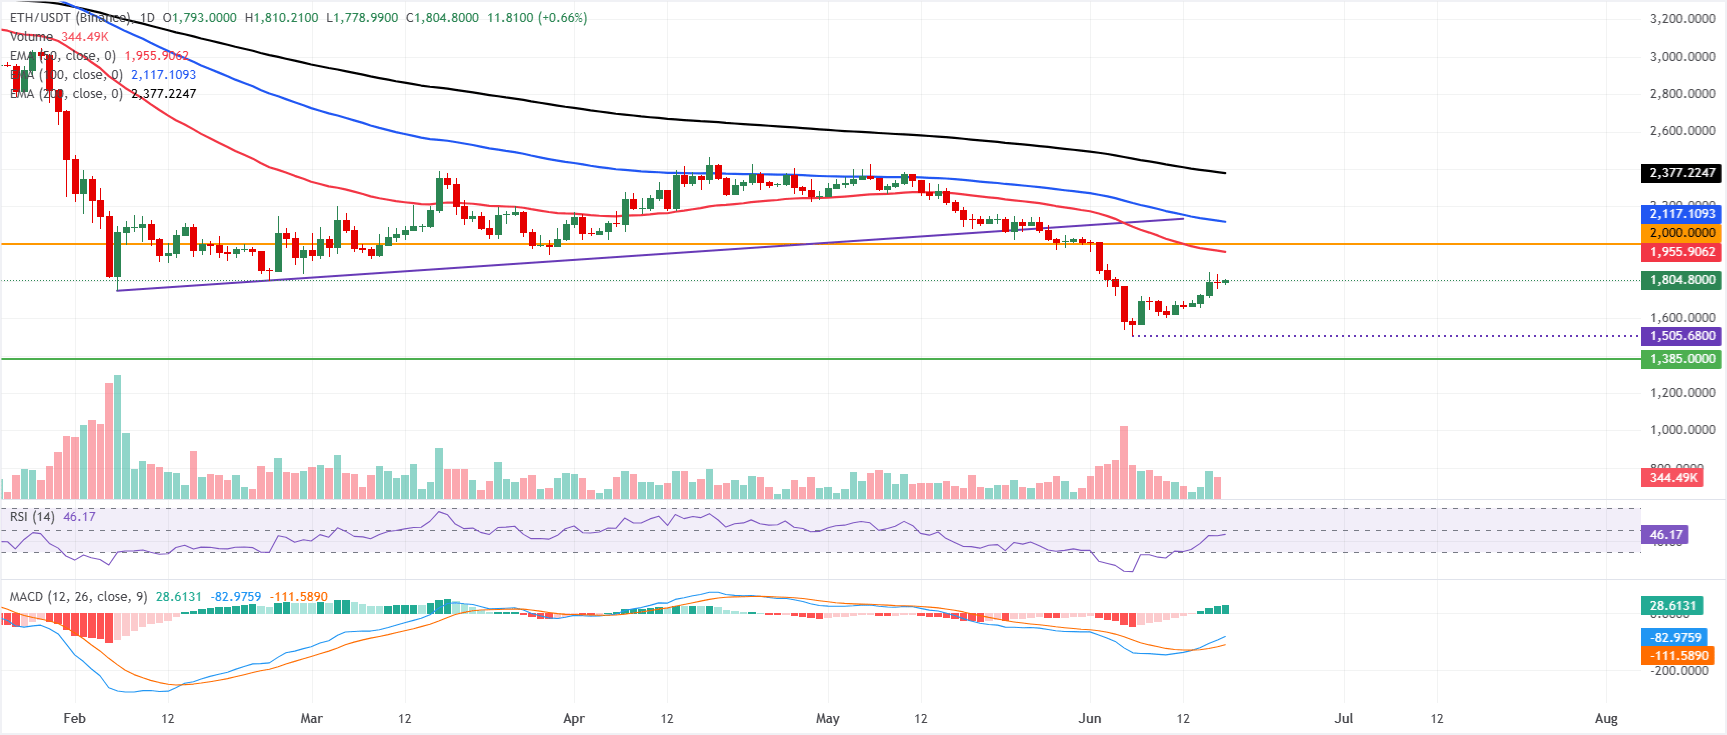
Ethereum price trades at $1,804 on Wednesday, after a mild recovery earlier this week. However, ETH is maintaining a bearish near-term bias as it remains well below the 50-day, 100-day, and 200-day EMAs at roughly $1,955, $2,117, and $2,377, respectively.
The RSI at 46 maintains a slightly negative tone despite having recovered from oversold territory. At the same time, the positive Moving Average Convergence Divergence (MACD) reading suggests a tentative rebound attempt that remains structurally capped by the overhead EMAs.
On the topside, initial resistance is seen at the horizontal barrier near $2,000, ahead of the 50-day EMA at $1,955 and the 100-day EMA at $2,117, with the 200-day EMA at $2,377 reinforcing a broader bearish supply zone higher up.
On the downside, the key structural floor sits much lower at the horizontal support around $1,385, where a break would expose further weakness in the broader trend.
XRP nears falling channel breakout zone
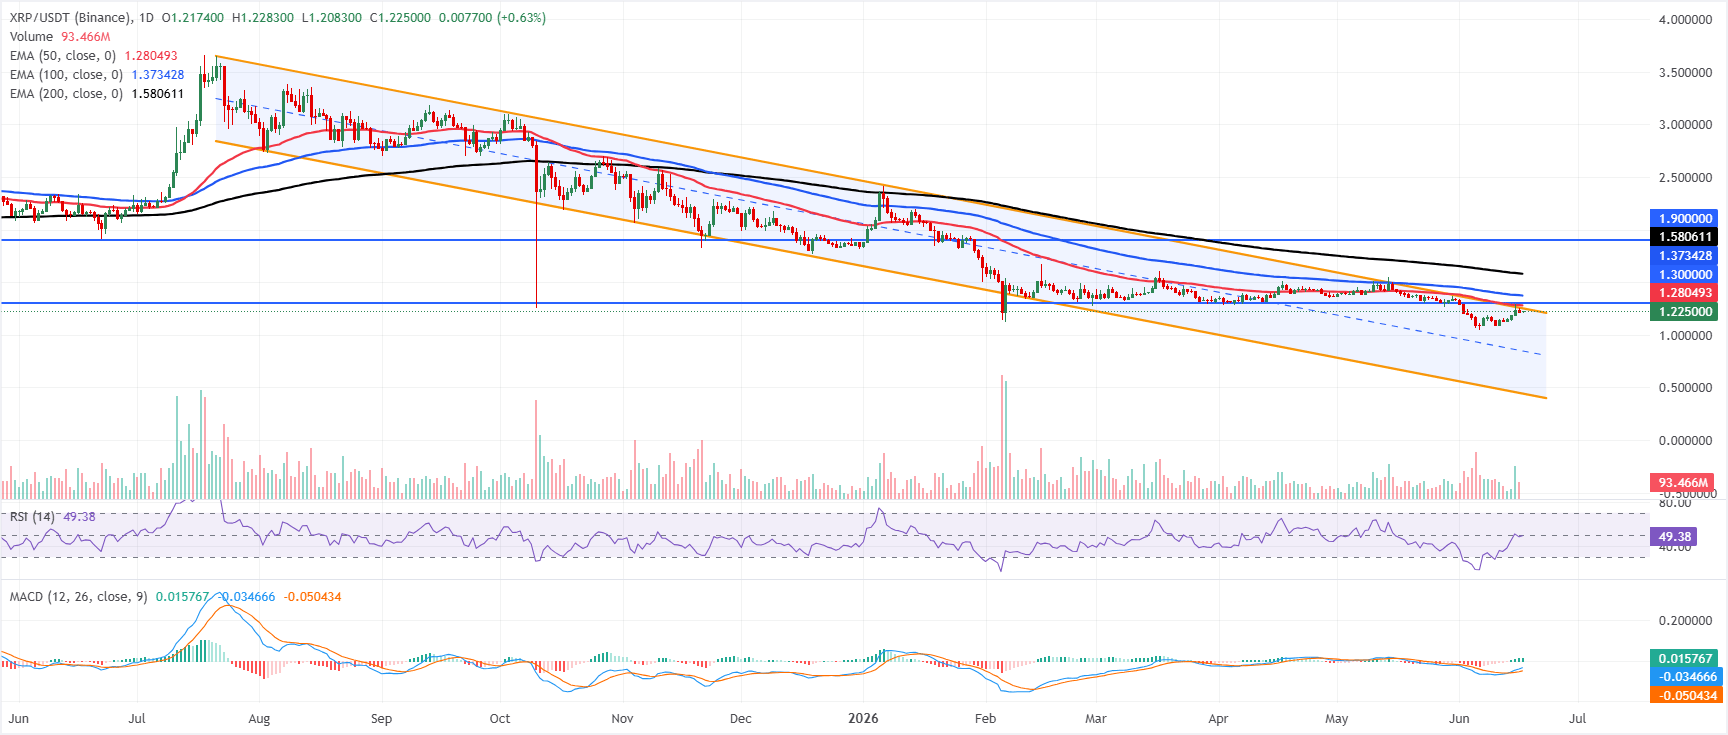
XRP price trades at $1.22 on Wednesday, reattempting to break above the upper boundary of the falling channel pattern, after being rejected from it the previous day.
Momentum, however, shows some stabilization, with the RSI hovering just below the neutral 50 line at 49 and the MACD turning modestly positive above the zero line, hinting that selling pressure is losing traction even as the broader structure stays capped.
On the topside, initial resistance is aligned with the channel boundary around $1.250, followed by the 50-day EMA at $1.280 and the horizontal barrier at $1.3000, where a break would open the way toward the 100-day EMA around $1.373. Beyond there, the 200-day EMA at $1.580 and the prior horizontal resistance near $1.900 define a distant supply zone that would likely cap any extended recovery unless buyers regain clear control.
With no identifiable support levels from the provided indicators below, traders may look to recent swing lows or psychological handles for interim demand cues. At the same time, price action remains constrained beneath these clustered moving averages and structural caps.
(The technical analysis of this story was written with the help of an AI tool.)
Cryptocurrency prices FAQs
Token launches influence demand and adoption among market participants. Listings on crypto exchanges deepen the liquidity for an asset and add new participants to an asset’s network. This is typically bullish for a digital asset.
A hack is an event in which an attacker captures a large volume of the asset from a DeFi bridge or hot wallet of an exchange or any other crypto platform via exploits, bugs or other methods. The exploiter then transfers these tokens out of the exchange platforms to ultimately sell or swap the assets for other cryptocurrencies or stablecoins. Such events often involve an en masse panic triggering a sell-off in the affected assets.
Macroeconomic events like the US Federal Reserve’s decision on interest rates influence crypto assets mainly through the direct impact they have on the US Dollar. An increase in interest rate typically negatively influences Bitcoin and altcoin prices, and vice versa. If the US Dollar index declines, risk assets and associated leverage for trading gets cheaper, in turn driving crypto prices higher.
Halvings are typically considered bullish events as they slash the block reward in half for miners, constricting the supply of the asset. At consistent demand if the supply reduces, the asset’s price climbs.

100만 명이 넘는 사용자가 FXStreet를 통해 실시간 시장 데이터, 차트 도구, 전문가 인사이트, 포렉스 뉴스를 이용합니다. 포괄적인 경제 캘린더와 교육 웨비나는 트레이더가 정보를 유지하고 신중한 결정을 내리도록 돕습니다. FXStreet는 바르셀로나 본사와 전 세계 지역에 걸쳐 약 60명의 팀으로 구성되어 있습니다.
더 읽기


