

Top Altcoins Price Forecast: XRP, HYPE, and ZEC risk further decline
- Ripple extends losses on Thursday, as price remains capped below the 50-day EMA at $1.1456.
- Hyperliquid edges below $60 after breaking a crucial support trendline the previous day.
- Zcash hovers above $500 after four consecutive days of losses, capped below a local resistance trendline.
Ripple (XRP), Hyperliquid (HYPE) and Zcash (ZEC) are trading in the red on Thursday, facing headwinds near crucial support levels. The technical outlook for XRP, HYPE and ZEC is bearish in the near term, with risks of further declines as selling pressure builds.

Ripple remains capped below 50-day EMA
XRP edges lower on Thursday, maintaining a corrective tone below the 50-day Exponential Moving Average (EMA) at $1.1458 and remains well below the 200-day EMA at $1.4425. The pair has bounced off recent lows, but upside attempts are still capped by this overhead moving-average structure.
Momentum is improving, with the Moving Average Convergence Divergence (MACD) and signal line advancing higher and its histogram expanding positively, while the Relative Strength Index (RSI) at about 55 hints at a recovery in bullish pressure without entering overbought territory.
On the topside, initial resistance is located at the 50-day EMA at $1.1458, followed closely by the 50% Fibonacci retracement of the latest swing from $1.2935 to $1.0092 at $1.1514, forming a nearby barrier.
On the downside, first support emerges at the 38.2% Fibonacci retracement at $1.1178, with additional demand seen near the broken rising trendline area around $1.0937. A deeper slide would expose the 23.6% retracement at $1.0763, before the anchor low at $1.0092 comes into view as a critical floor.
Hyperliquid breaks below crucial support trendline
Hyperliquid trades below $60.00 on Thursday, holding below the 50-day EMA at $62.52. From a technical perspective, the near-term bias is bearish, with the path of least resistance targeting the 50% retracement at $54.19, measured from $38.17 to $76.93.
Price remains above the longer-term 200-day EMA at $50.77, but the rejection from the descending resistance line near $69.67 and the break of the former uptrend support line now acting as resistance at $60.72 suggest that rallies are being sold.
The RSI at 40 remains in weak territory, while the MACD and signal line are trending below the zero line, reinforcing a downside-biased tone.
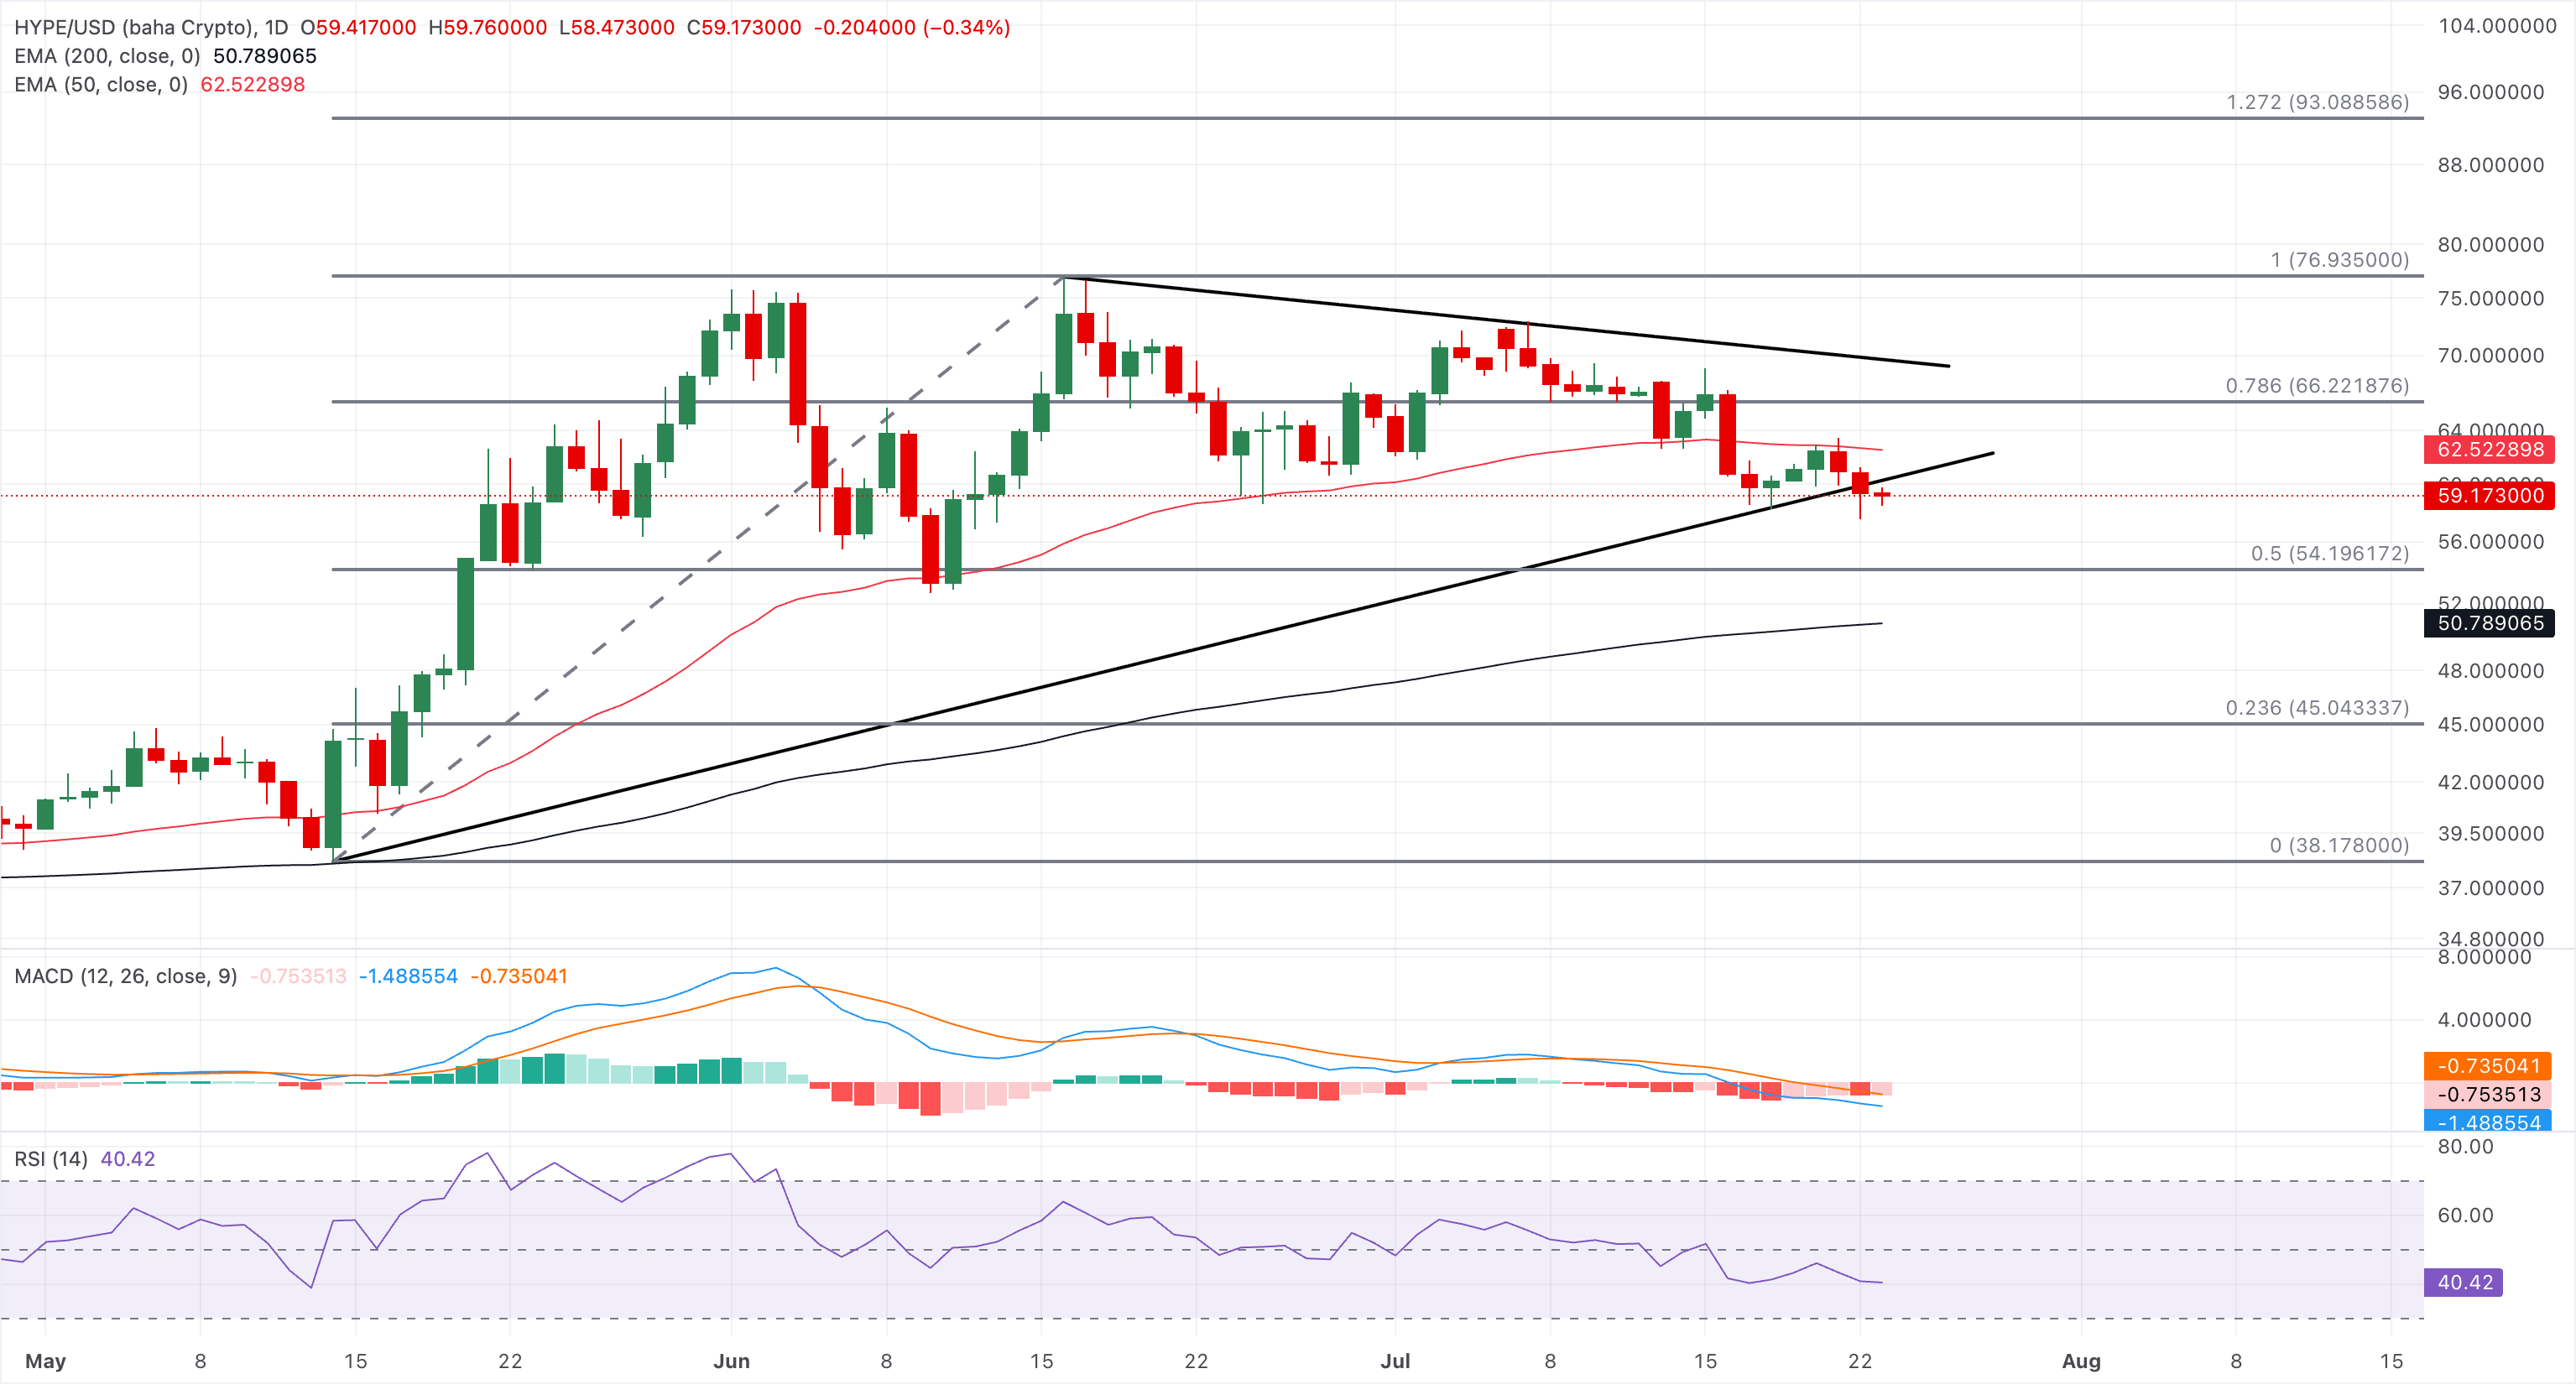
Looking up, HYPE faces headwinds from the broken support trendline near $60.72, the 50-day EMA at $62.52, and the 78.6% Fibonacci retracement level at $66.22.
Zcash extends decline toward the 50-day EMA
Zcash trades above $500 on Thursday, facing downside pressure from an overhead trendline near $581. The privacy coin holds above both the 50-day EMA and 200-day EMA at $489 and $407, respectively, keeping the broader bias constructive.
Momentum is mixed, with the RSI hovering around a neutral 52 and the MACD slipping below zero, hinting that bullish structure is intact but upside conviction has cooled.
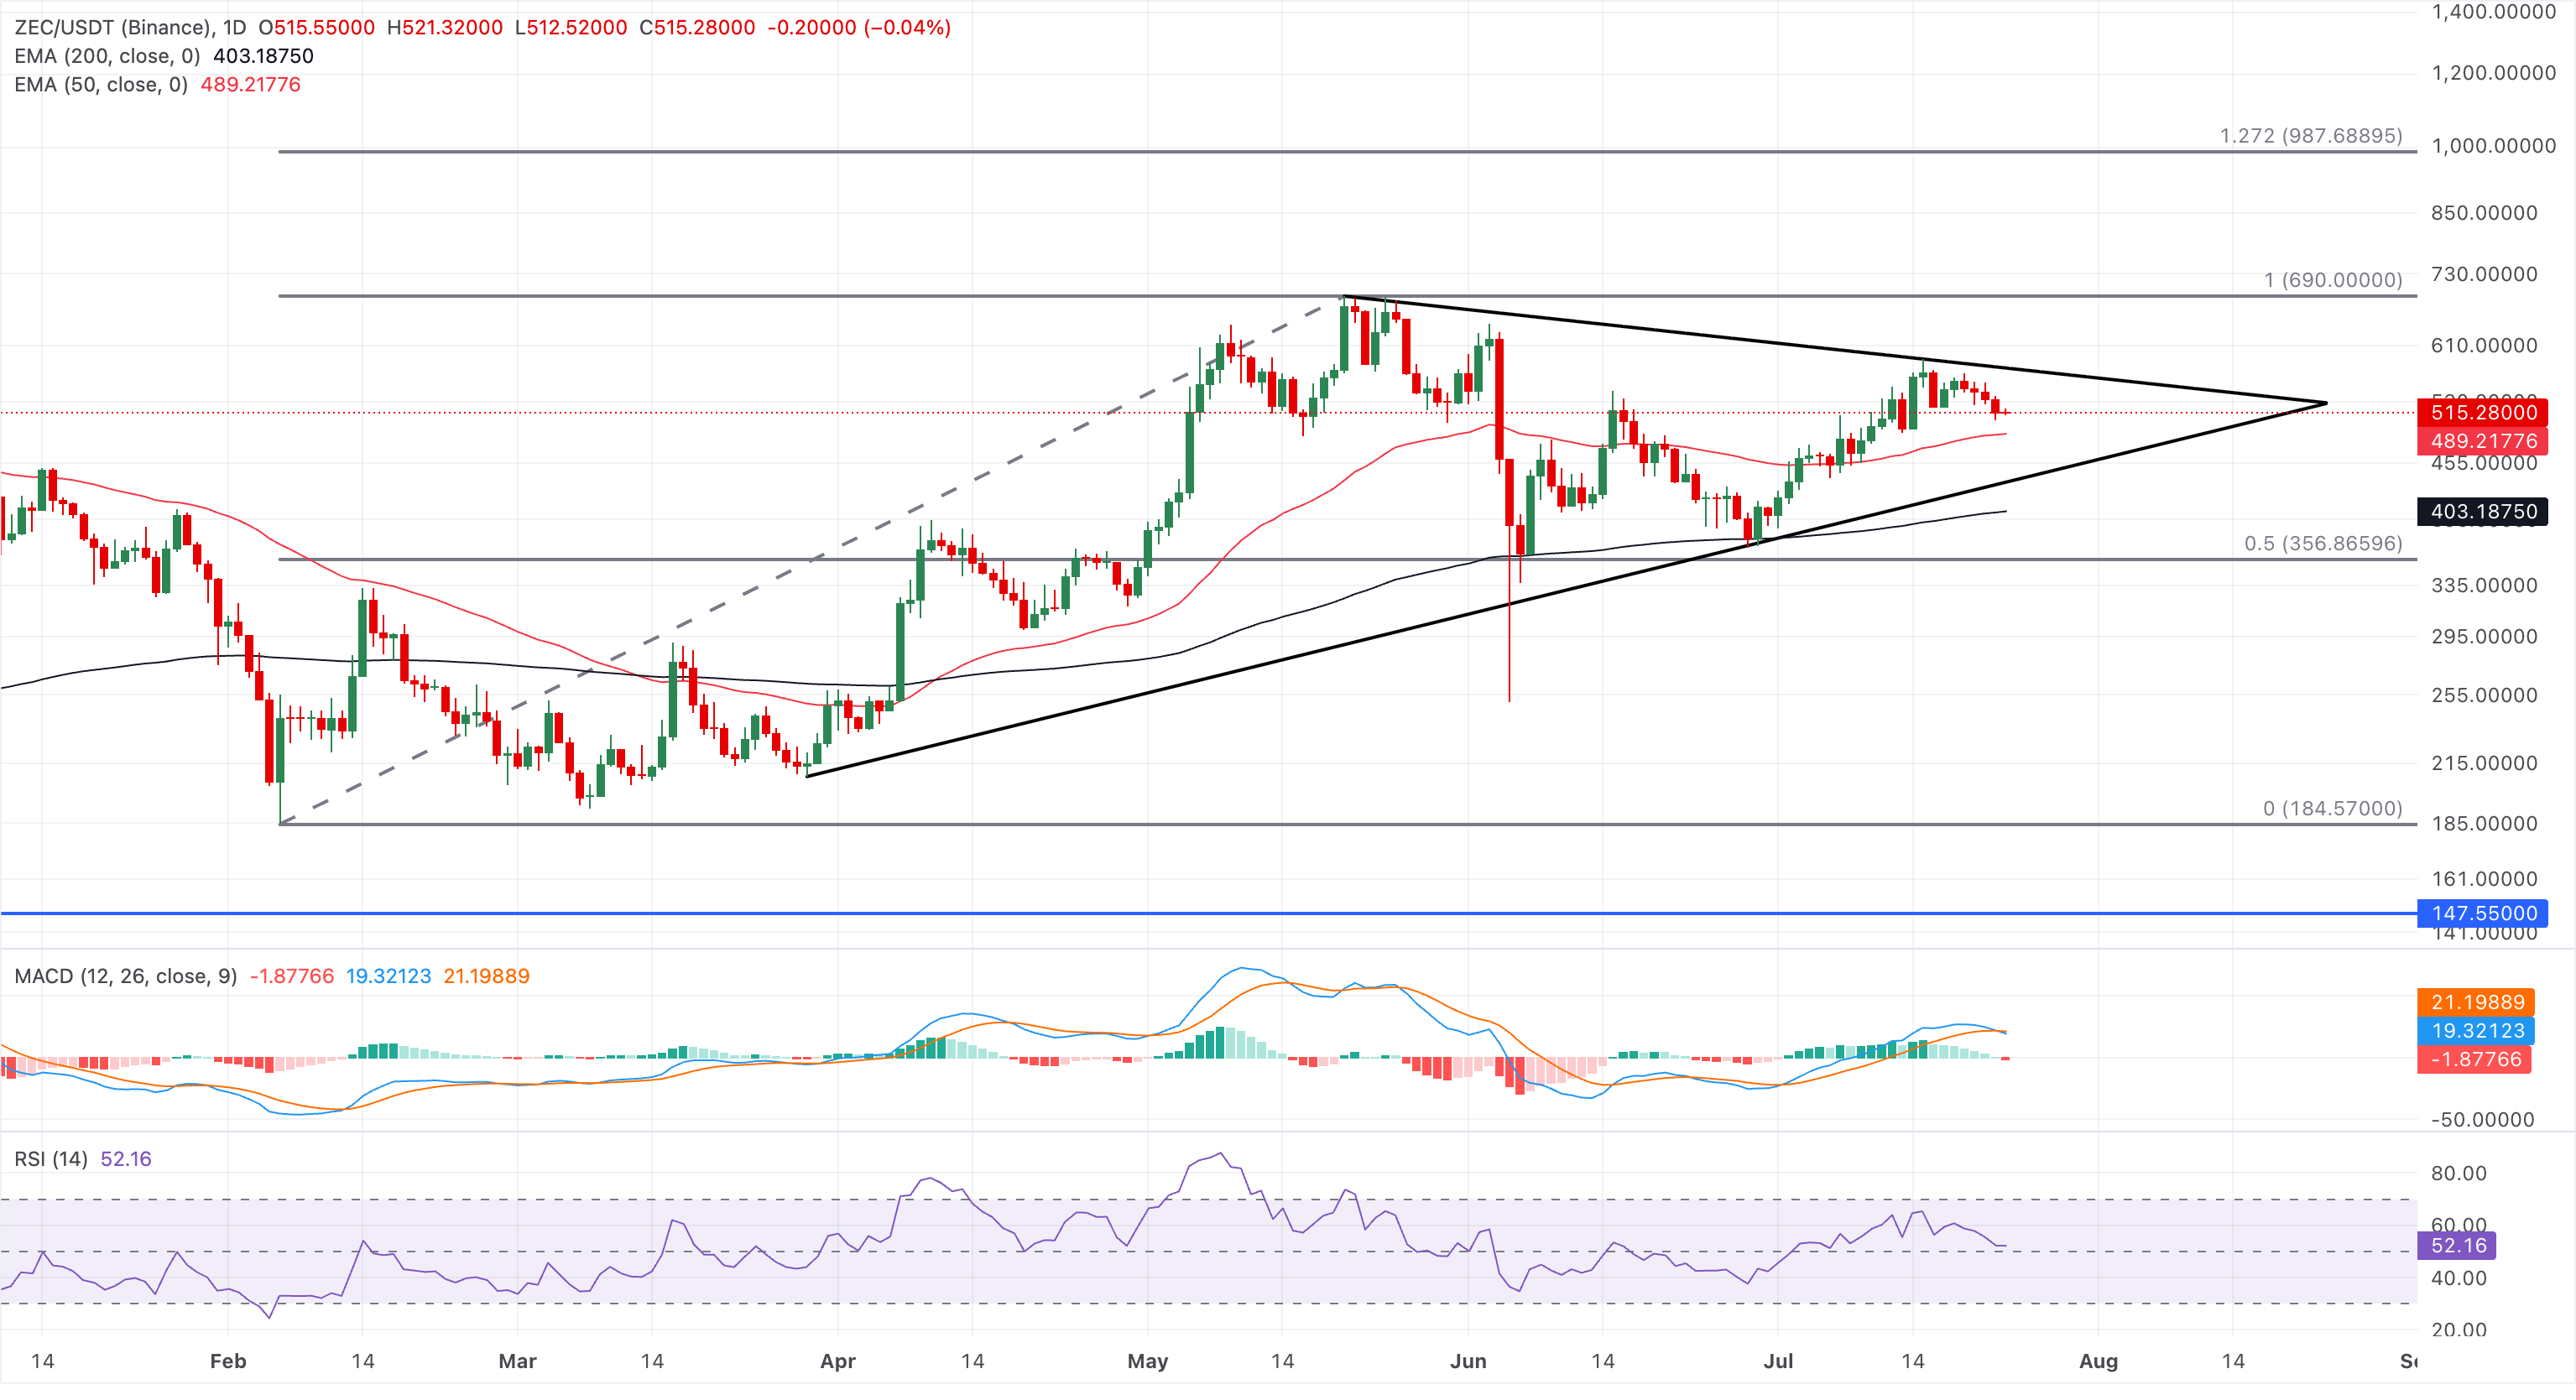
On the topside, initial resistance aligns with the descending trendline barrier around $581, with the prior swing high near $690.00 marking a more distant bullish objective if buyers regain control.
(The technical analysis of this story was written with the help of an AI tool. Know more.)














