
Top Crypto Gainers: World Liberty Financial, Sky, and Cosmos confront major resistance
작성자 Vishal Dixit
게시일: 19 Feb 2026 | 수정일: 19 Feb 2026


인기 기사

World Liberty Financial (WLFI), Sky (SKY), and Cosmos (ATOM) rank among the top gainers over the last 24 hours but face critical overhead resistance levels.
- World Liberty Financial is up nearly 2% on Thursday, but is struggling to break through a key overhead resistance level.
- Sky extends higher after a 5% jump on Wednesday, inching closer to a crucial supply zone.
- Cosmos remains steady near a resistance level after a 4% jump from the 50-day EMA.
World Liberty Financial (WLFI), Sky (SKY), and Cosmos (ATOM) rank among the top gainers over the last 24 hours but face critical overhead resistance levels. WLFI gained momentum at the World Liberty Forum, an invite-only conference held at Mar-a-Lago by US President Donald Trump’s family, while SKY and ATOM reversed off a crucial support level.
WLFI prices in the World Liberty Forum hype
World Liberty Financial is up nearly 2% at the time of writing on Thursday, extending the gains for the third consecutive day. The short-term recovery is driven by the World Liberty Forum, a conference hosted by the Trump family's crypto project on Wednesday, which brought together global market leaders.
The WLFI token encounters resistance at $0.1215, aligning with the December 18 low. A decisive close above this level would extend the WLFI rally to the 50-day Exponential Moving Average (EMA) at $0.1337.
The Relative Strength Index (RSI) on the daily chart is at 46, rising near the halfway line from the oversold zone, indicating a significant decline in selling pressure. At the same time, the Moving Average Convergence Divergence (MACD) continues its upward trend following a bullish crossover on Tuesday, indicating increased bullish momentum.
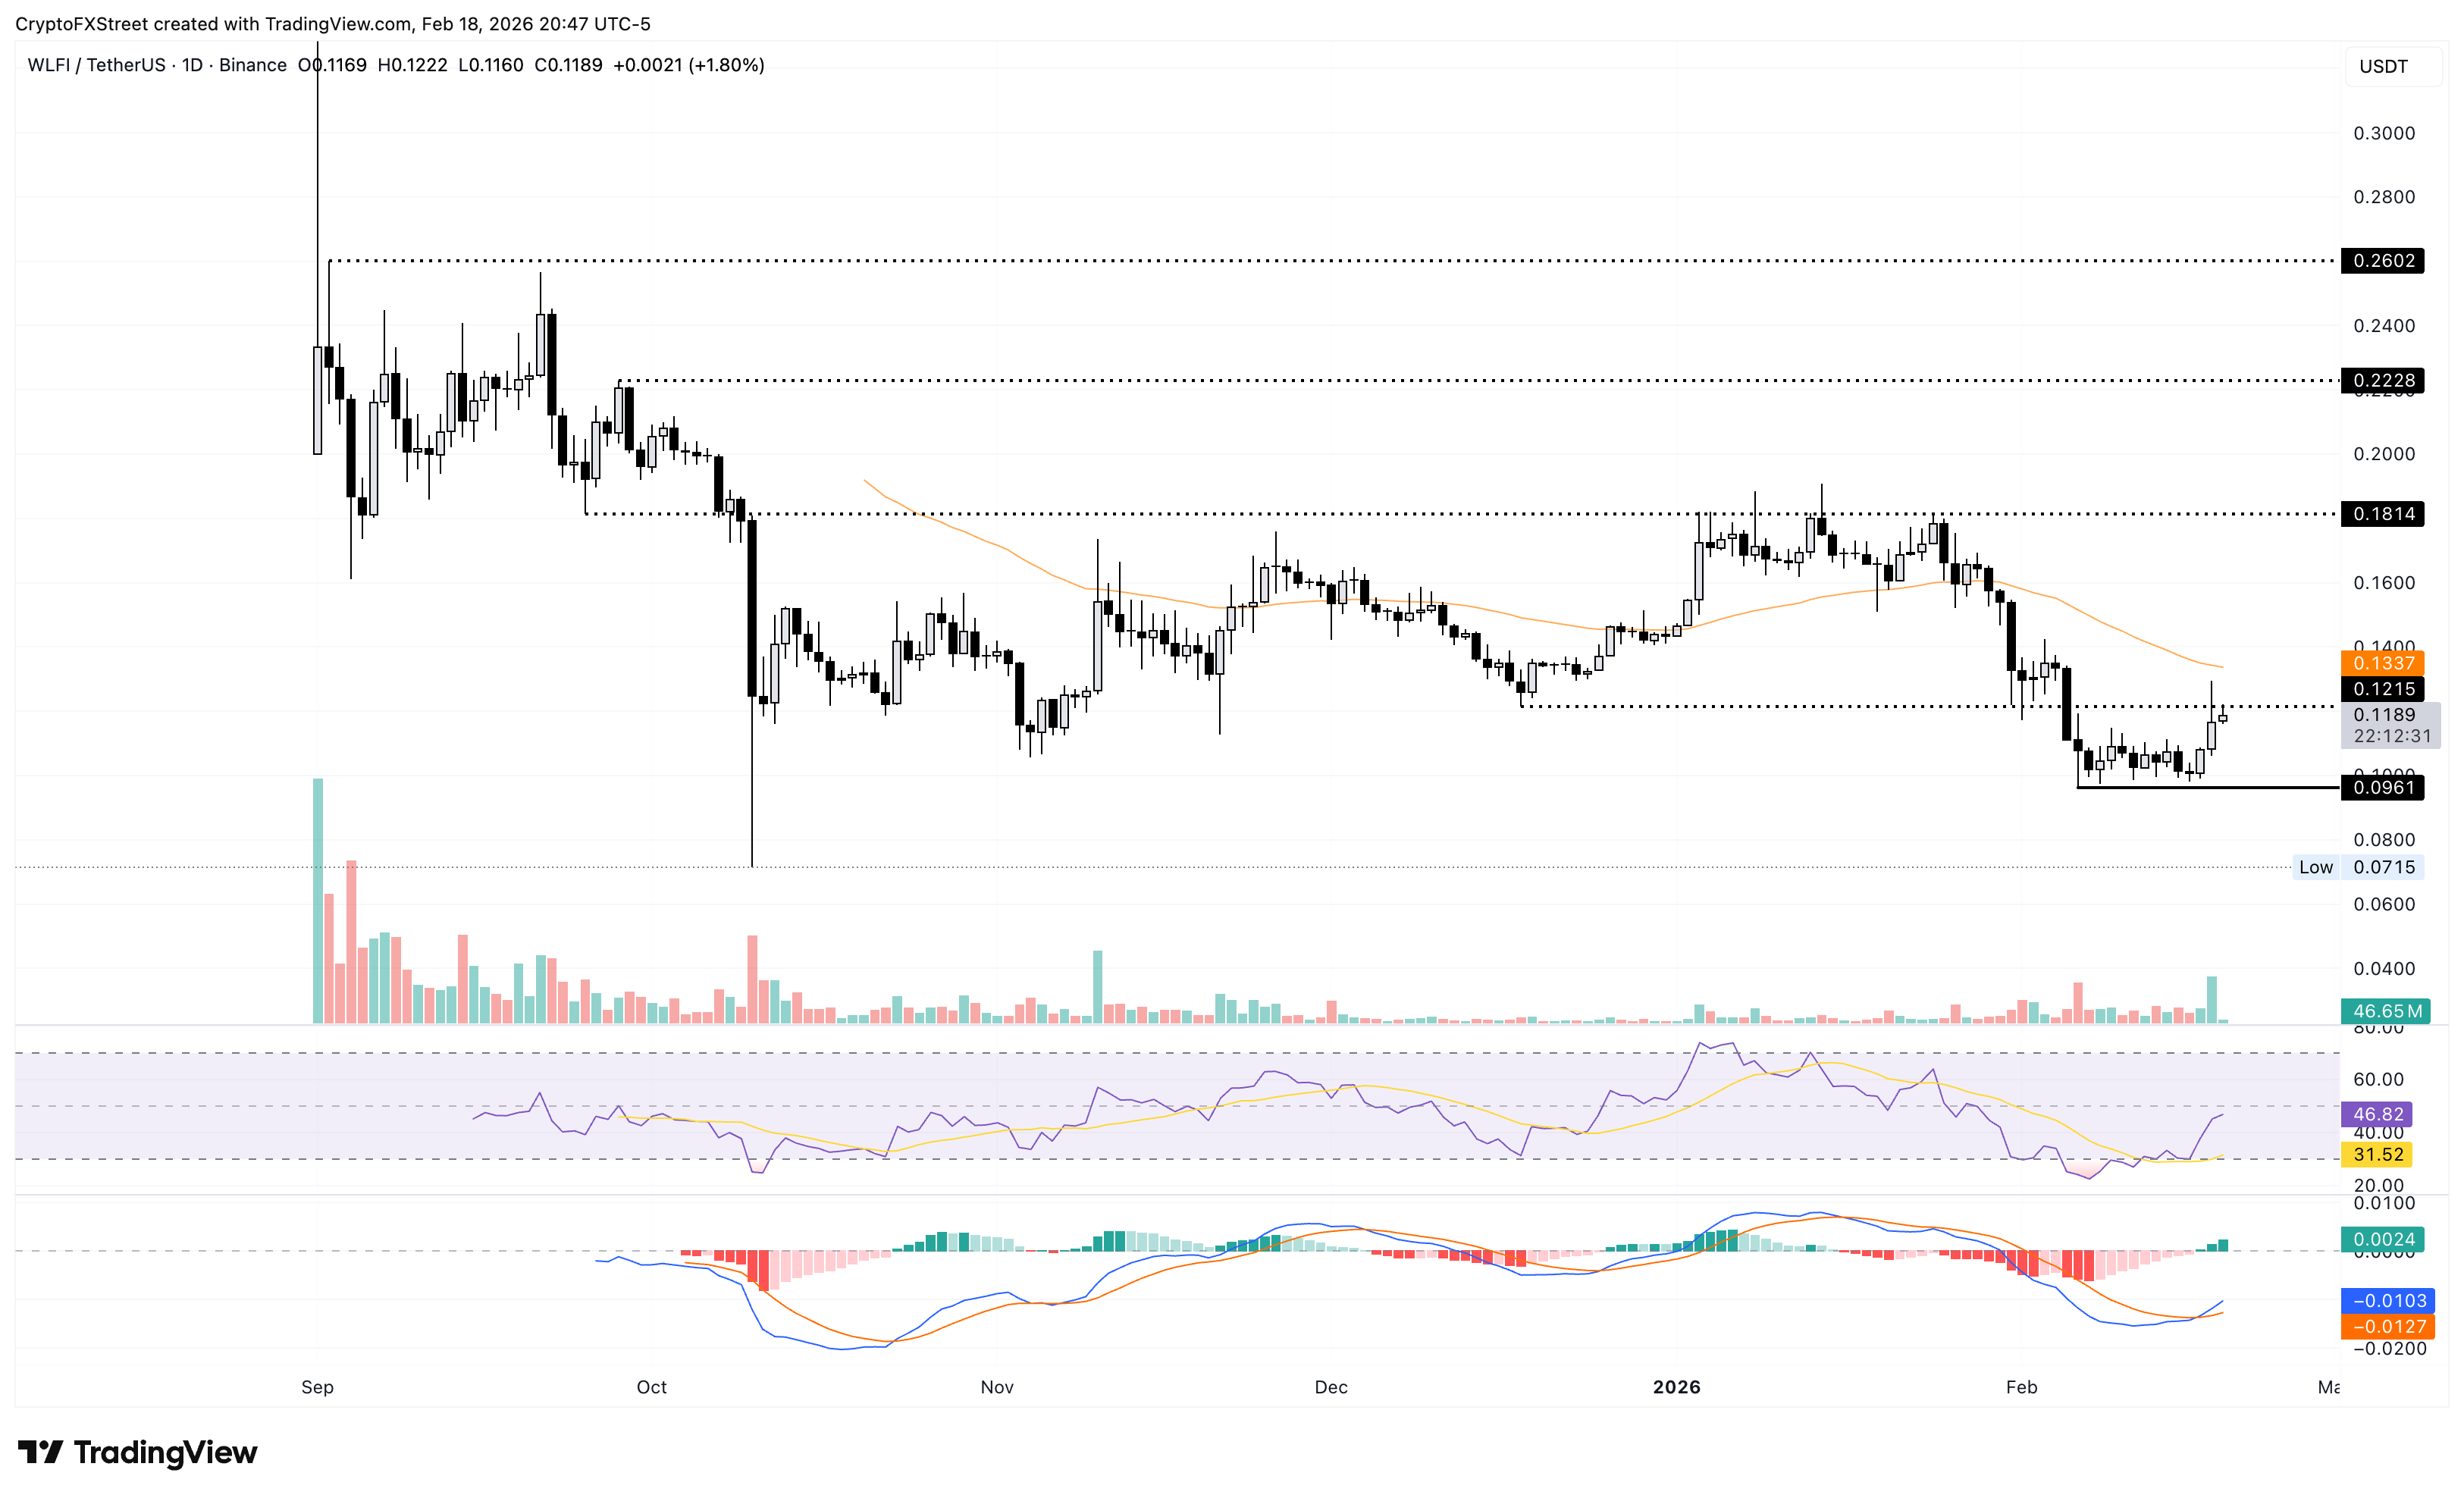
On the flip side, a bearish close for the day would reaffirm downside pressure, risking a decline to the $0.1000 psychological level.
SKY recovery nears a crucial supply zone
SKY is up over 1% as of press time on Thursday, extending the 5% rebound from the 50-day EMA at $0.06381 the previous day. The intraday recovery inches closer to the overhead supply zone near the $0.070000 round figure.
A decisive close above this level would likely extend the rally to the 1.272 Fibonacci extension level at $0.08197, measured from the October 1 high at $0.07299 to the November 22 low at $0.03998.
The RSI at 52 on the daily chart is edging above the midline, indicating a neutral-to-bullish stance. Meanwhile, the MACD hovers slightly below the signal line, maintaining a sideways trend and approaching a potential bullish crossover.
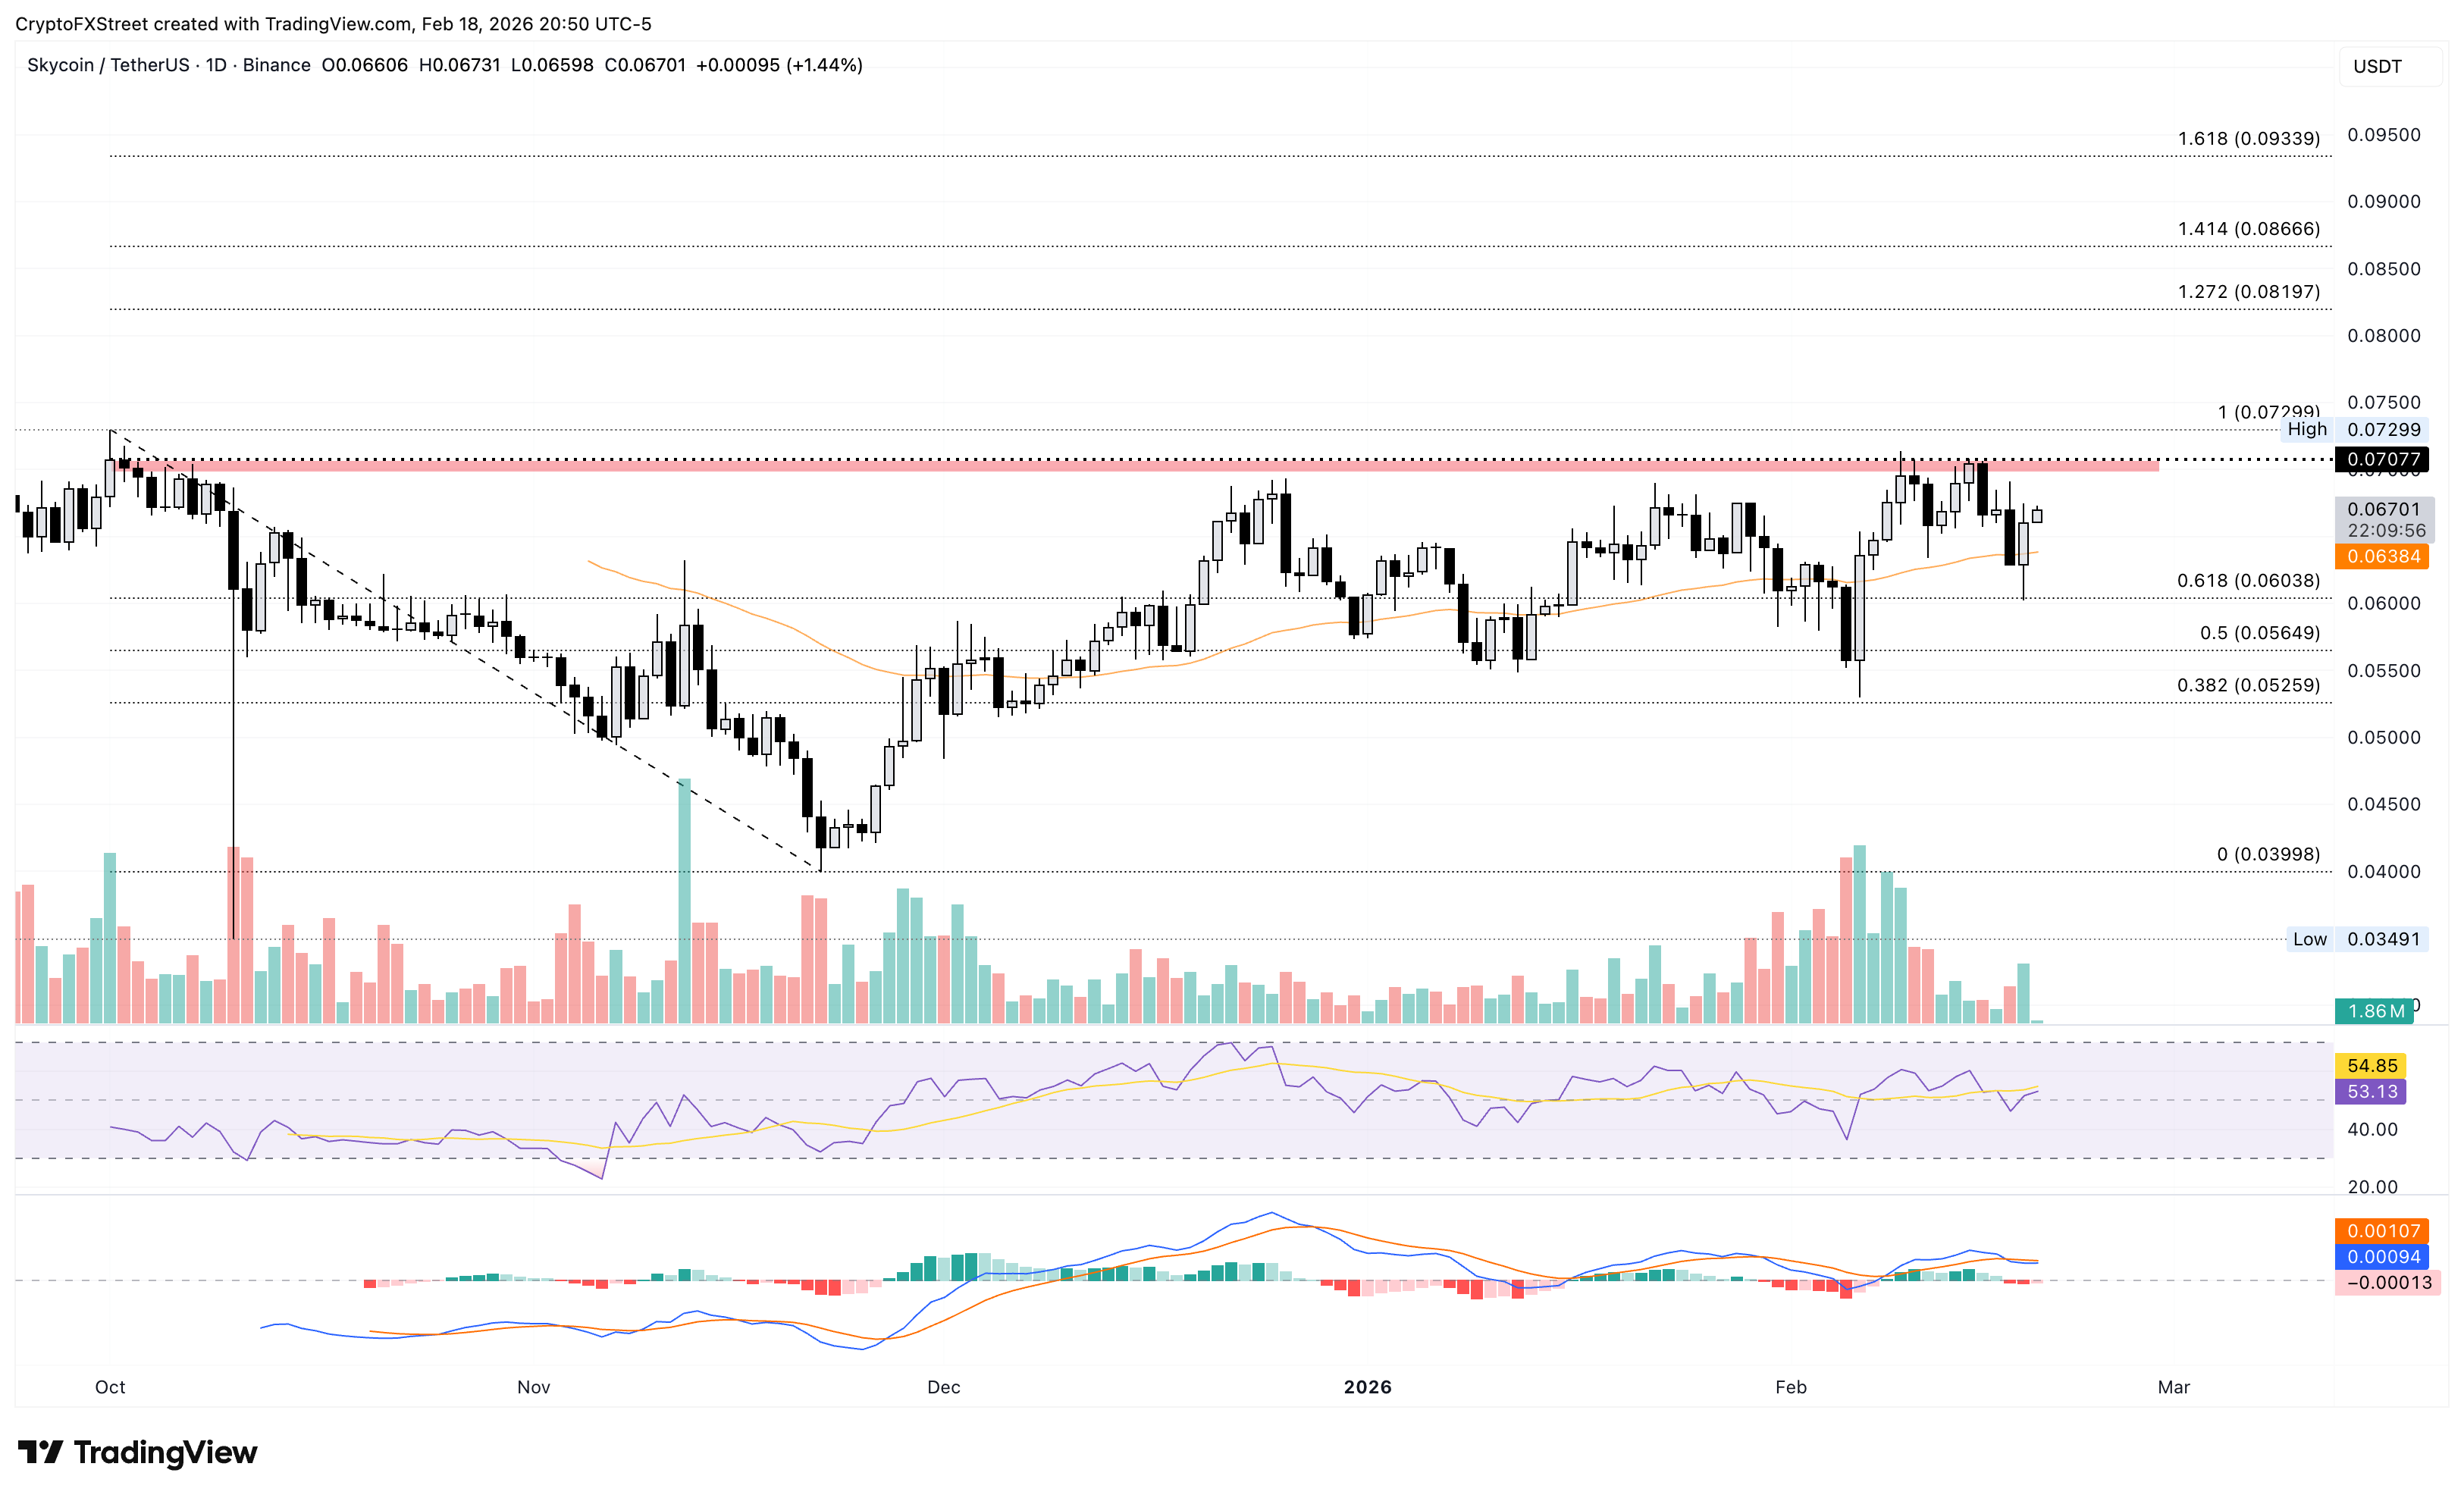
On the flip side, if Sky slips below the $0.06381, it could extend the decline to the 61.8% Fibonacci retracement level at $0.06038.
ATOM struggles at key resistance
Cosmos holds steady above the $2.300 level after a 4% rebound from the 50-day EMA at $2.201 on the previous day. However, the $2.346 resistance level marked by the November 4 low caps the intraday gain.
If ATOM clears this level, it could rise toward the $2.856, aligning with the October 11 low.
The RSI is at 60 on the daily chart, rising above the midline, with further upside before reaching the overbought zone. Additionally, the MACD and signal line recover as positive histograms widen above the zero line, suggesting increased bullish momentum.
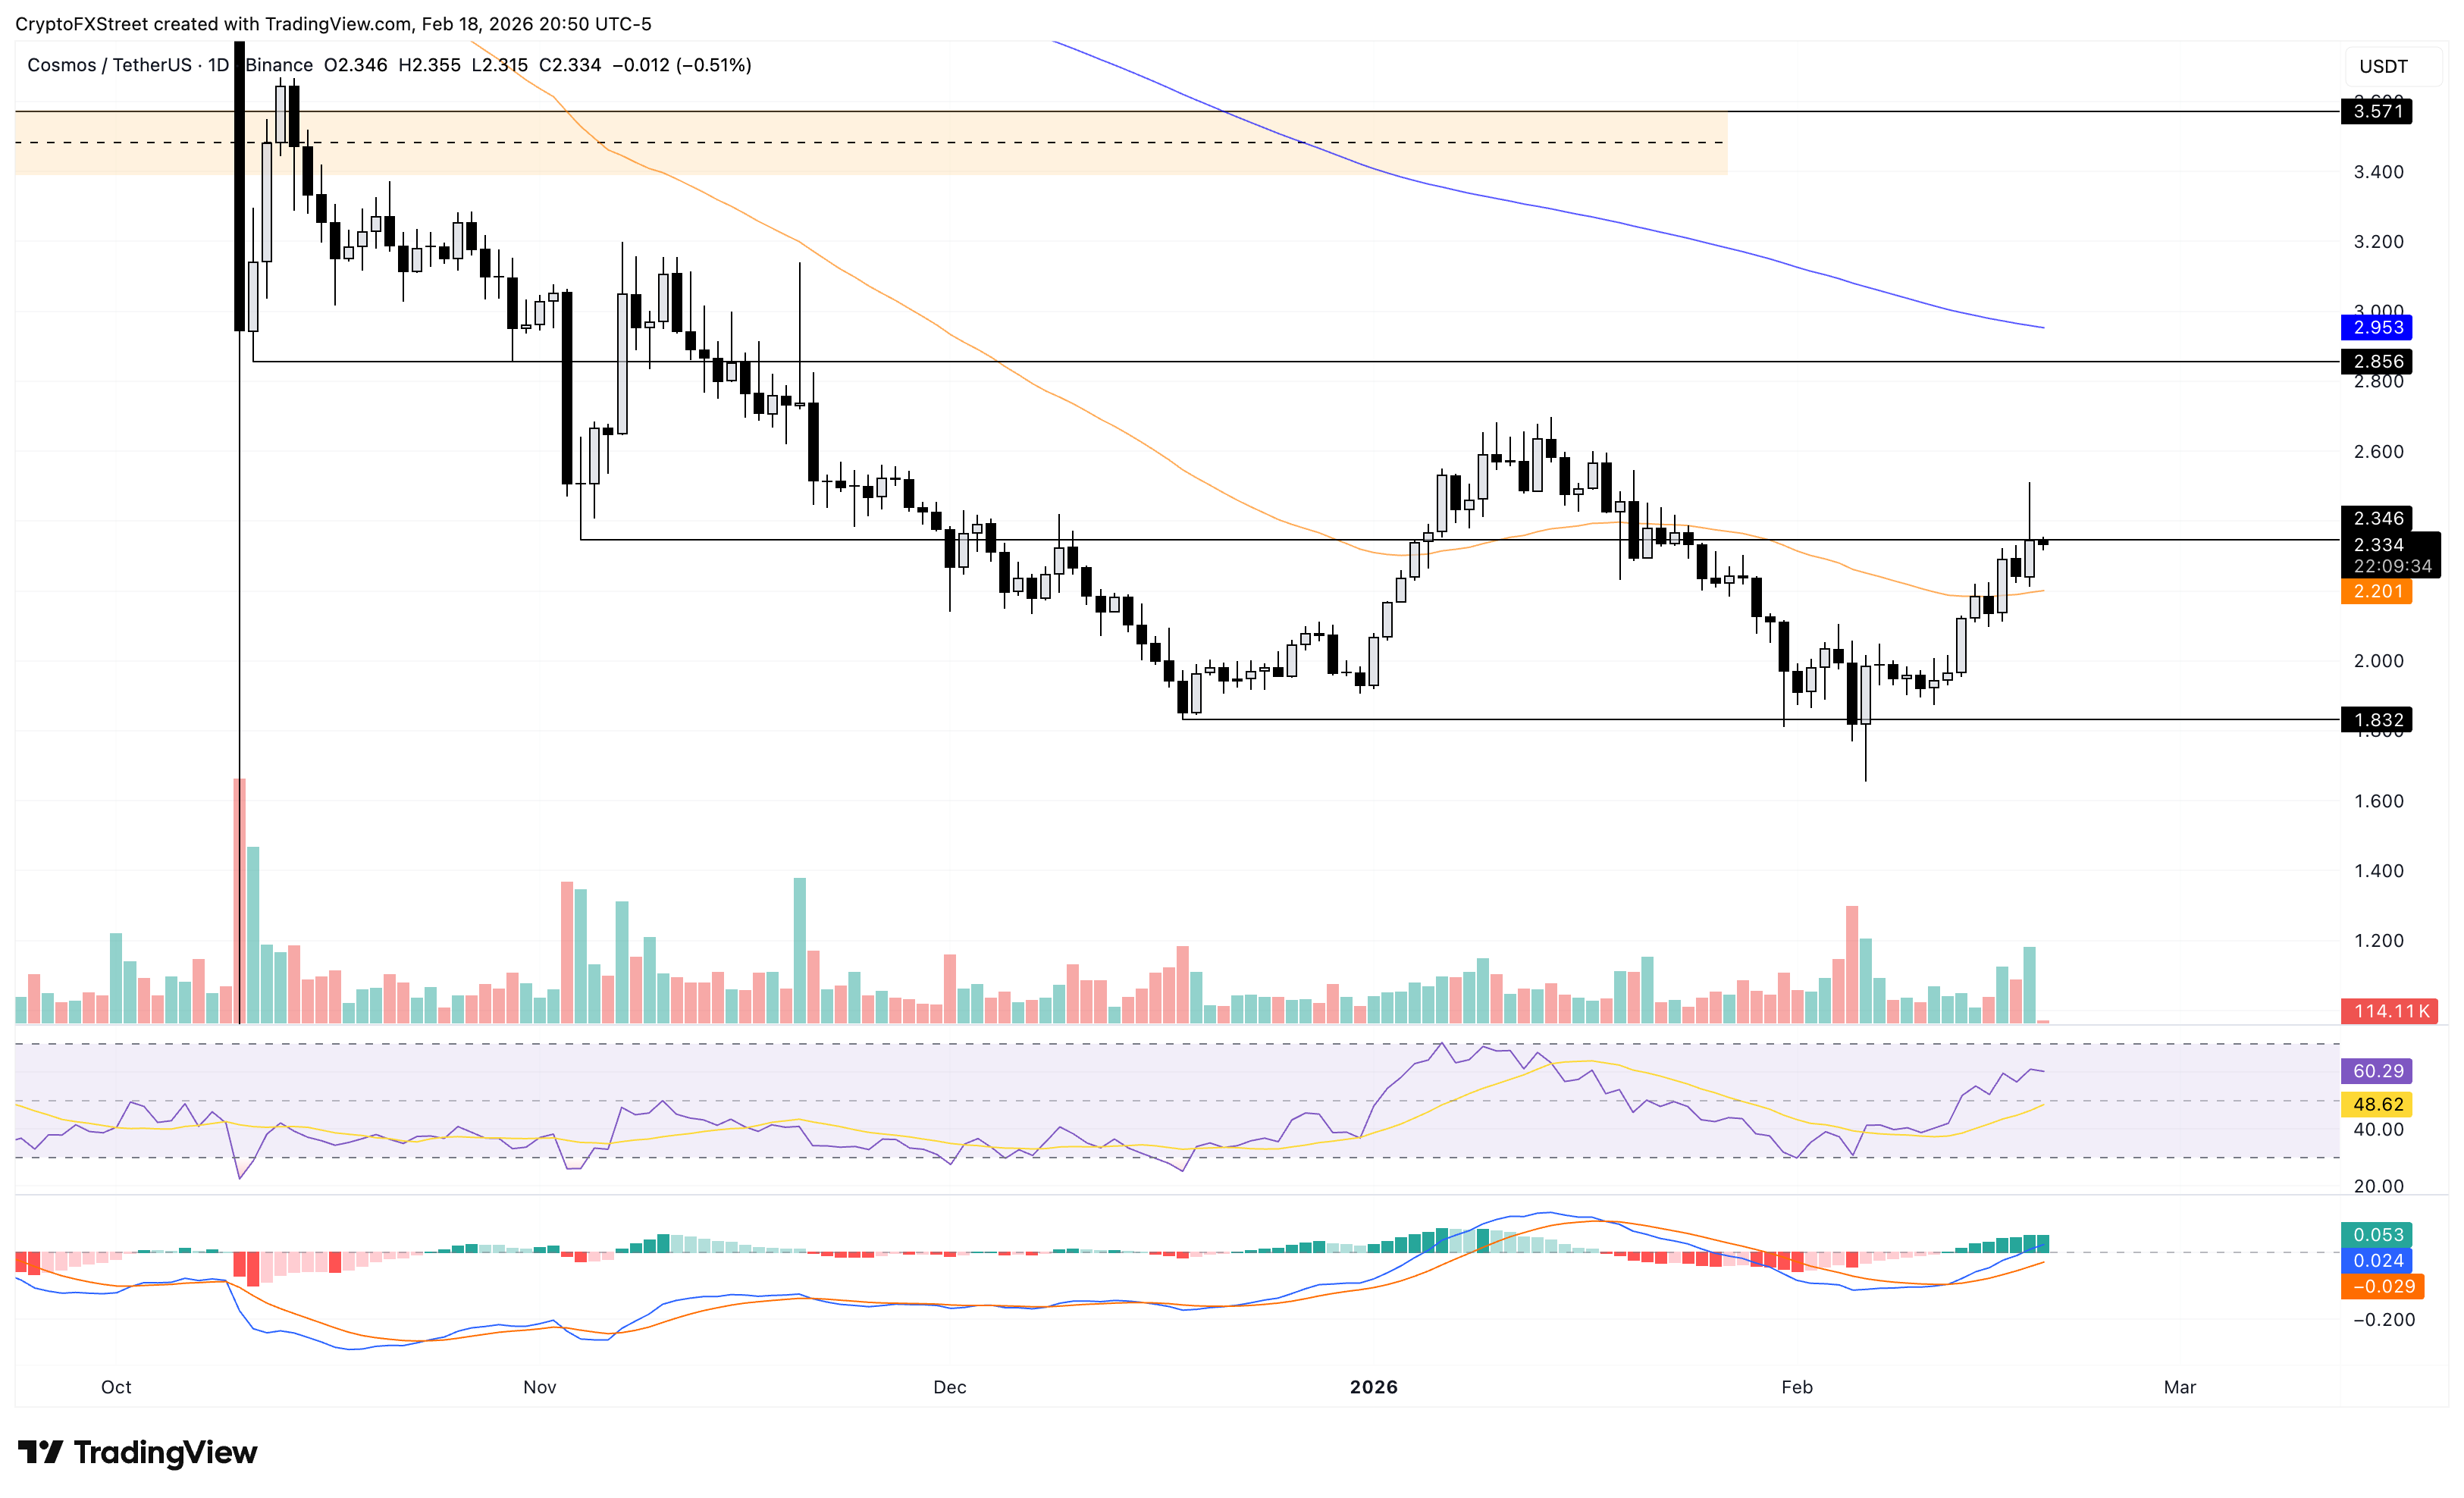
However, if ATOM slips below the 50-day EMA at $2.201, it could extend the decline to the December 18 low at $1.832.

100만 명이 넘는 사용자가 FXStreet를 통해 실시간 시장 데이터, 차트 도구, 전문가 인사이트, 포렉스 뉴스를 이용합니다. 포괄적인 경제 캘린더와 교육 웨비나는 트레이더가 정보를 유지하고 신중한 결정을 내리도록 돕습니다. FXStreet는 바르셀로나 본사와 전 세계 지역에 걸쳐 약 60명의 팀으로 구성되어 있습니다.
더 읽기


