
Tron Price Analysis: TRX extends gains as bullish breakout structure remains intact
작성자 Manish Chhetri
게시일: 23 Jan 2026 | 수정일: 23 Jan 2026


인기 기사

Tron (TRX) price extends its gains, trading above $0.30 at the time of writing on Friday after retesting the previously broken bullish breakout structure earlier this week. The positive on-chain and derivatives data back the bullish price action.
- Tron price extends gains on Friday after finding support around the previously broken upper boundary of the falling wedge pattern.
- On-chain and derivatives back the rally, with large whale orders, increased stablecoin activity, and rising bullish bets.
- The technical outlook suggests further gains, aiming for levels above $0.32.
Tron (TRX) price extends its gains, trading above $0.30 at the time of writing on Friday after retesting the previously broken bullish breakout structure earlier this week. The positive on-chain and derivatives data back the bullish price action. On the technical side, suggest further upside, targeting levels above $0.32.
Positive on-chain and derivatives metrics hint at an upside move
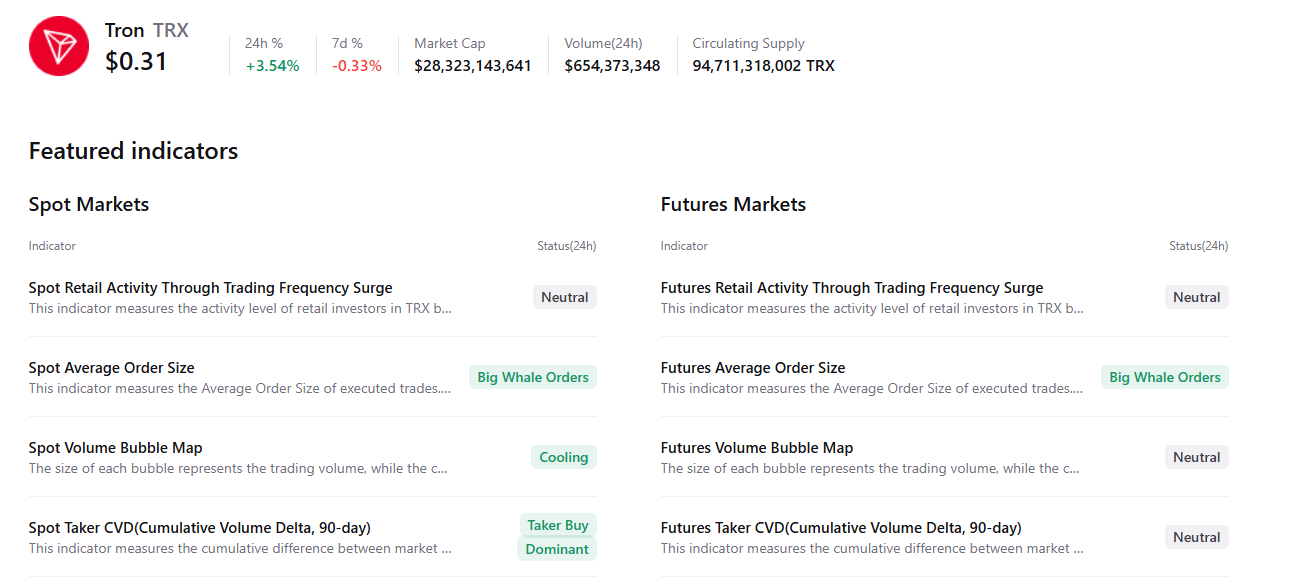
CryptoQuant's summary chart below supports a positive outlook, as TRX’s spot and futures markets show large whale orders, cooling conditions, and buy-side dominance, signaling a potential rally ahead.
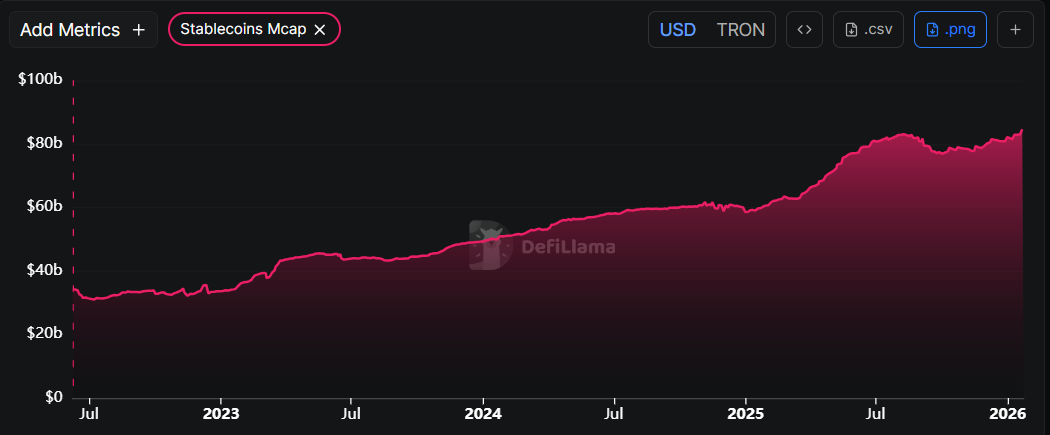
DefiLama data shows that TRX’s stablecoin total supply has risen since the end of December, reaching a new record high of $84.63 billion on Wednesday and steadying around $84.43 billion on Friday. Such stablecoin activity and value increase on the Tron project indicate a bullish outlook, as they boost network usage and can attract more users to the ecosystem.
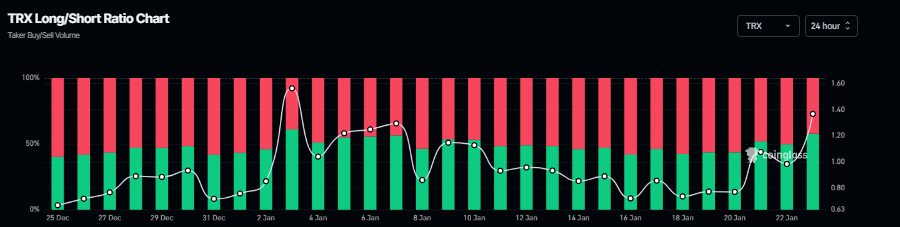
On the derivatives side, Coinglass' long-to-short ratio for TRX reads 1.36 on Friday, nearing the highest level over a month. The ratio above one suggests that more traders are betting on Tron’s price to rally.
Tron Price Analysis: TRX bulls target $0.32 mark
Tron price broke above the falling wedge pattern (drawn by connecting multiple highs and lows since the end of August) on January 13 and rose nearly 5% over the next four days. However, TRX gave up most of its gains through Tuesday. On Wednesday, TRX retested the upper boundary of the pattern and rebounded 3.42% the next day. This support level coincides with the daily support at $0.29 and the 50-day, 100-day, and 200-day EMAs, making this a key reversal zone. As of writing on Friday, TRX is trading above $0.30.
If TRX continues its upward trend, it could extend the rally toward the October 22 high of $0.32.
The Relative Strength Index (RSI) on the daily chart is 57, up from the neutral 50 level, indicating bullish momentum is gaining traction.
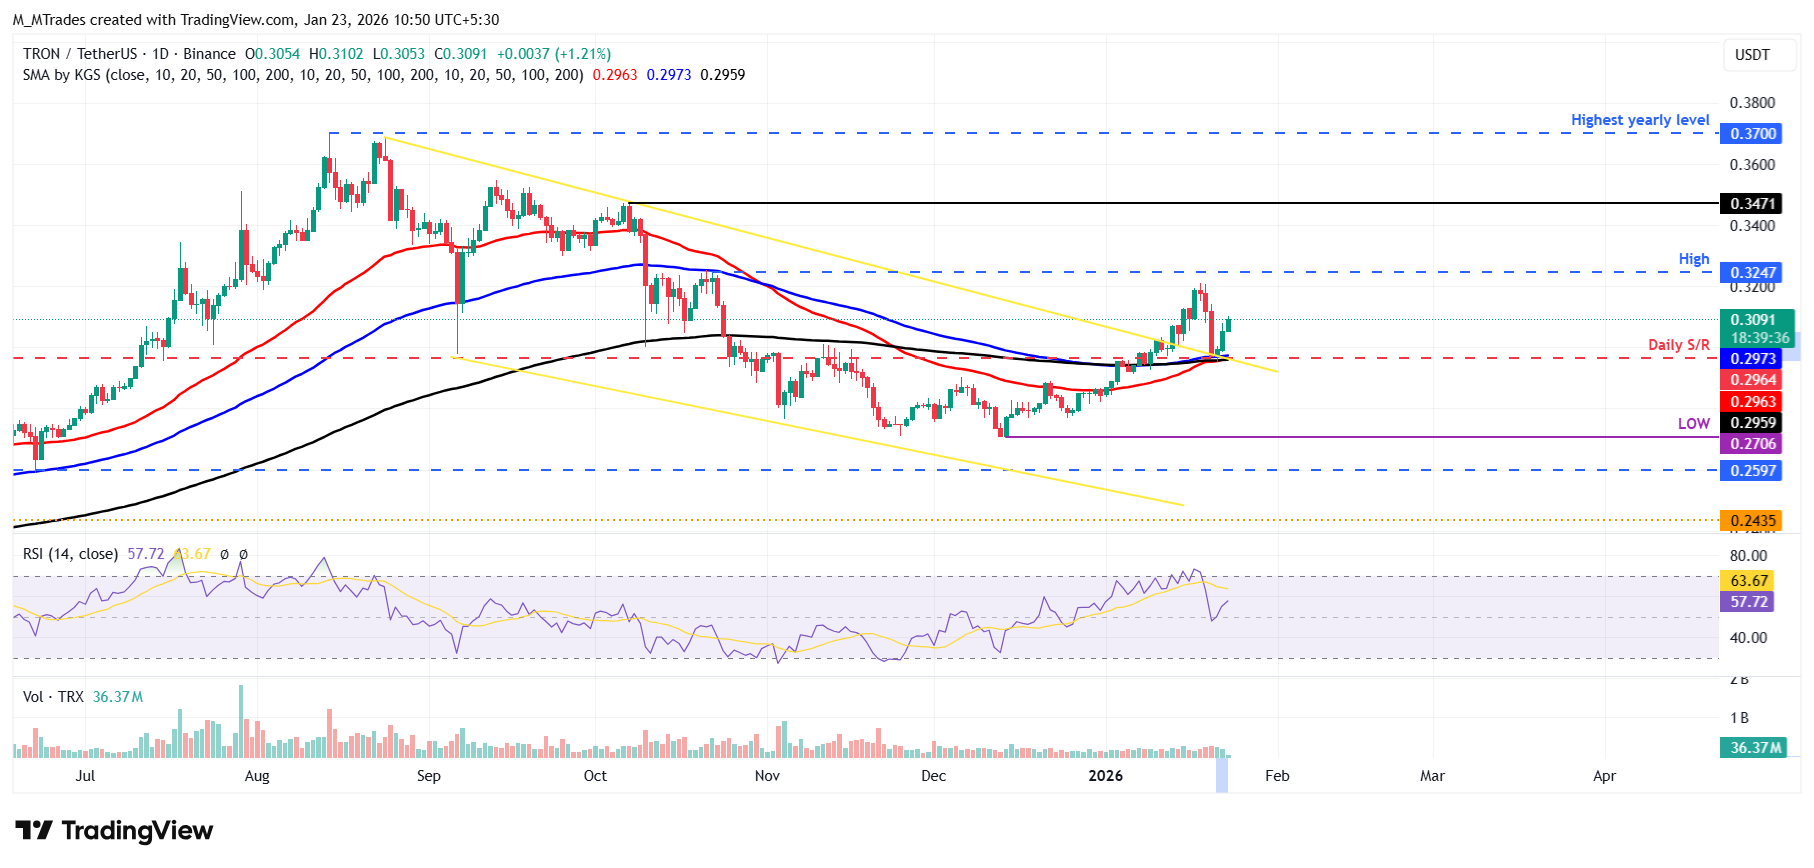
However, if TRX corrects, it could extend the decline toward the daily support at $0.29.

100만 명이 넘는 사용자가 FXStreet를 통해 실시간 시장 데이터, 차트 도구, 전문가 인사이트, 포렉스 뉴스를 이용합니다. 포괄적인 경제 캘린더와 교육 웨비나는 트레이더가 정보를 유지하고 신중한 결정을 내리도록 돕습니다. FXStreet는 바르셀로나 본사와 전 세계 지역에 걸쳐 약 60명의 팀으로 구성되어 있습니다.
더 읽기


