
Tron Price Forecast: TRX slides for fifth consecutive day despite treasury expansion
작성자 Vishal Dixit
게시일: 2 Feb 2026 | 수정일: 2 Feb 2026


인기 기사

Tron (TRX) remains in a steady decline for the fifth straight day, recording nearly 1% loss on Monday. Tron Inc., formerly SRM Entertainment Inc., acquired roughly 175,000 TRX tokens on Monday, reflecting its buy-the-dip strategy.
- Tron extends its decline for the fifth consecutive day on Monday, falling below $0.2900.
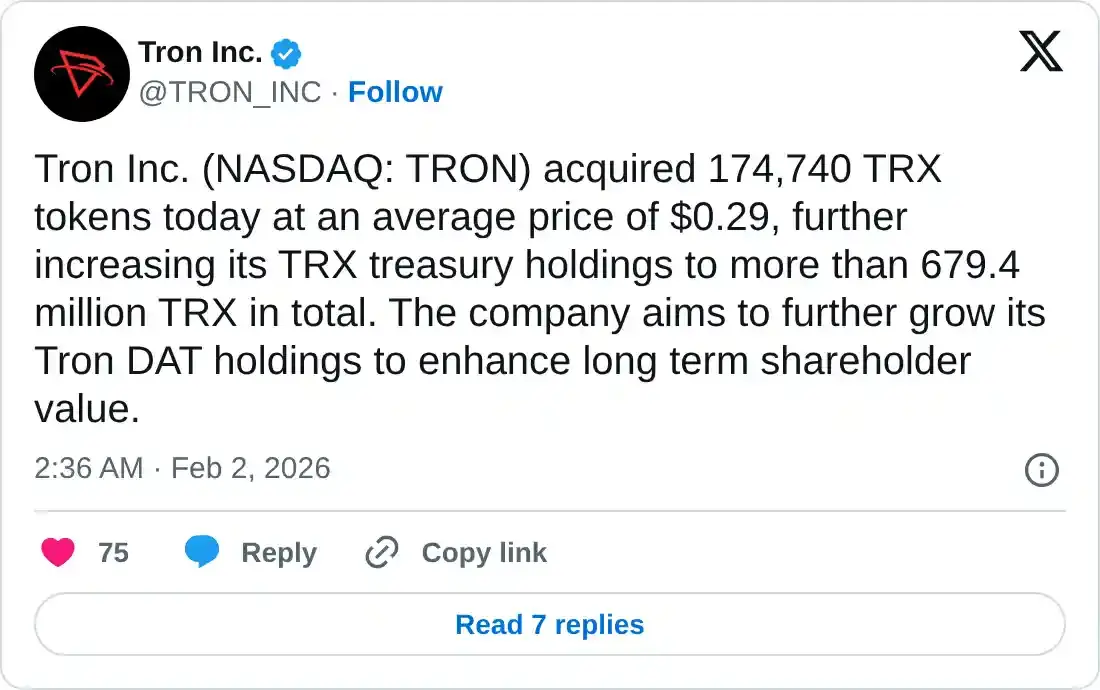
- Tron Inc. announced a purchase of approximately 175,000 TRX tokens on Monday, expanding its holdings at a discount.
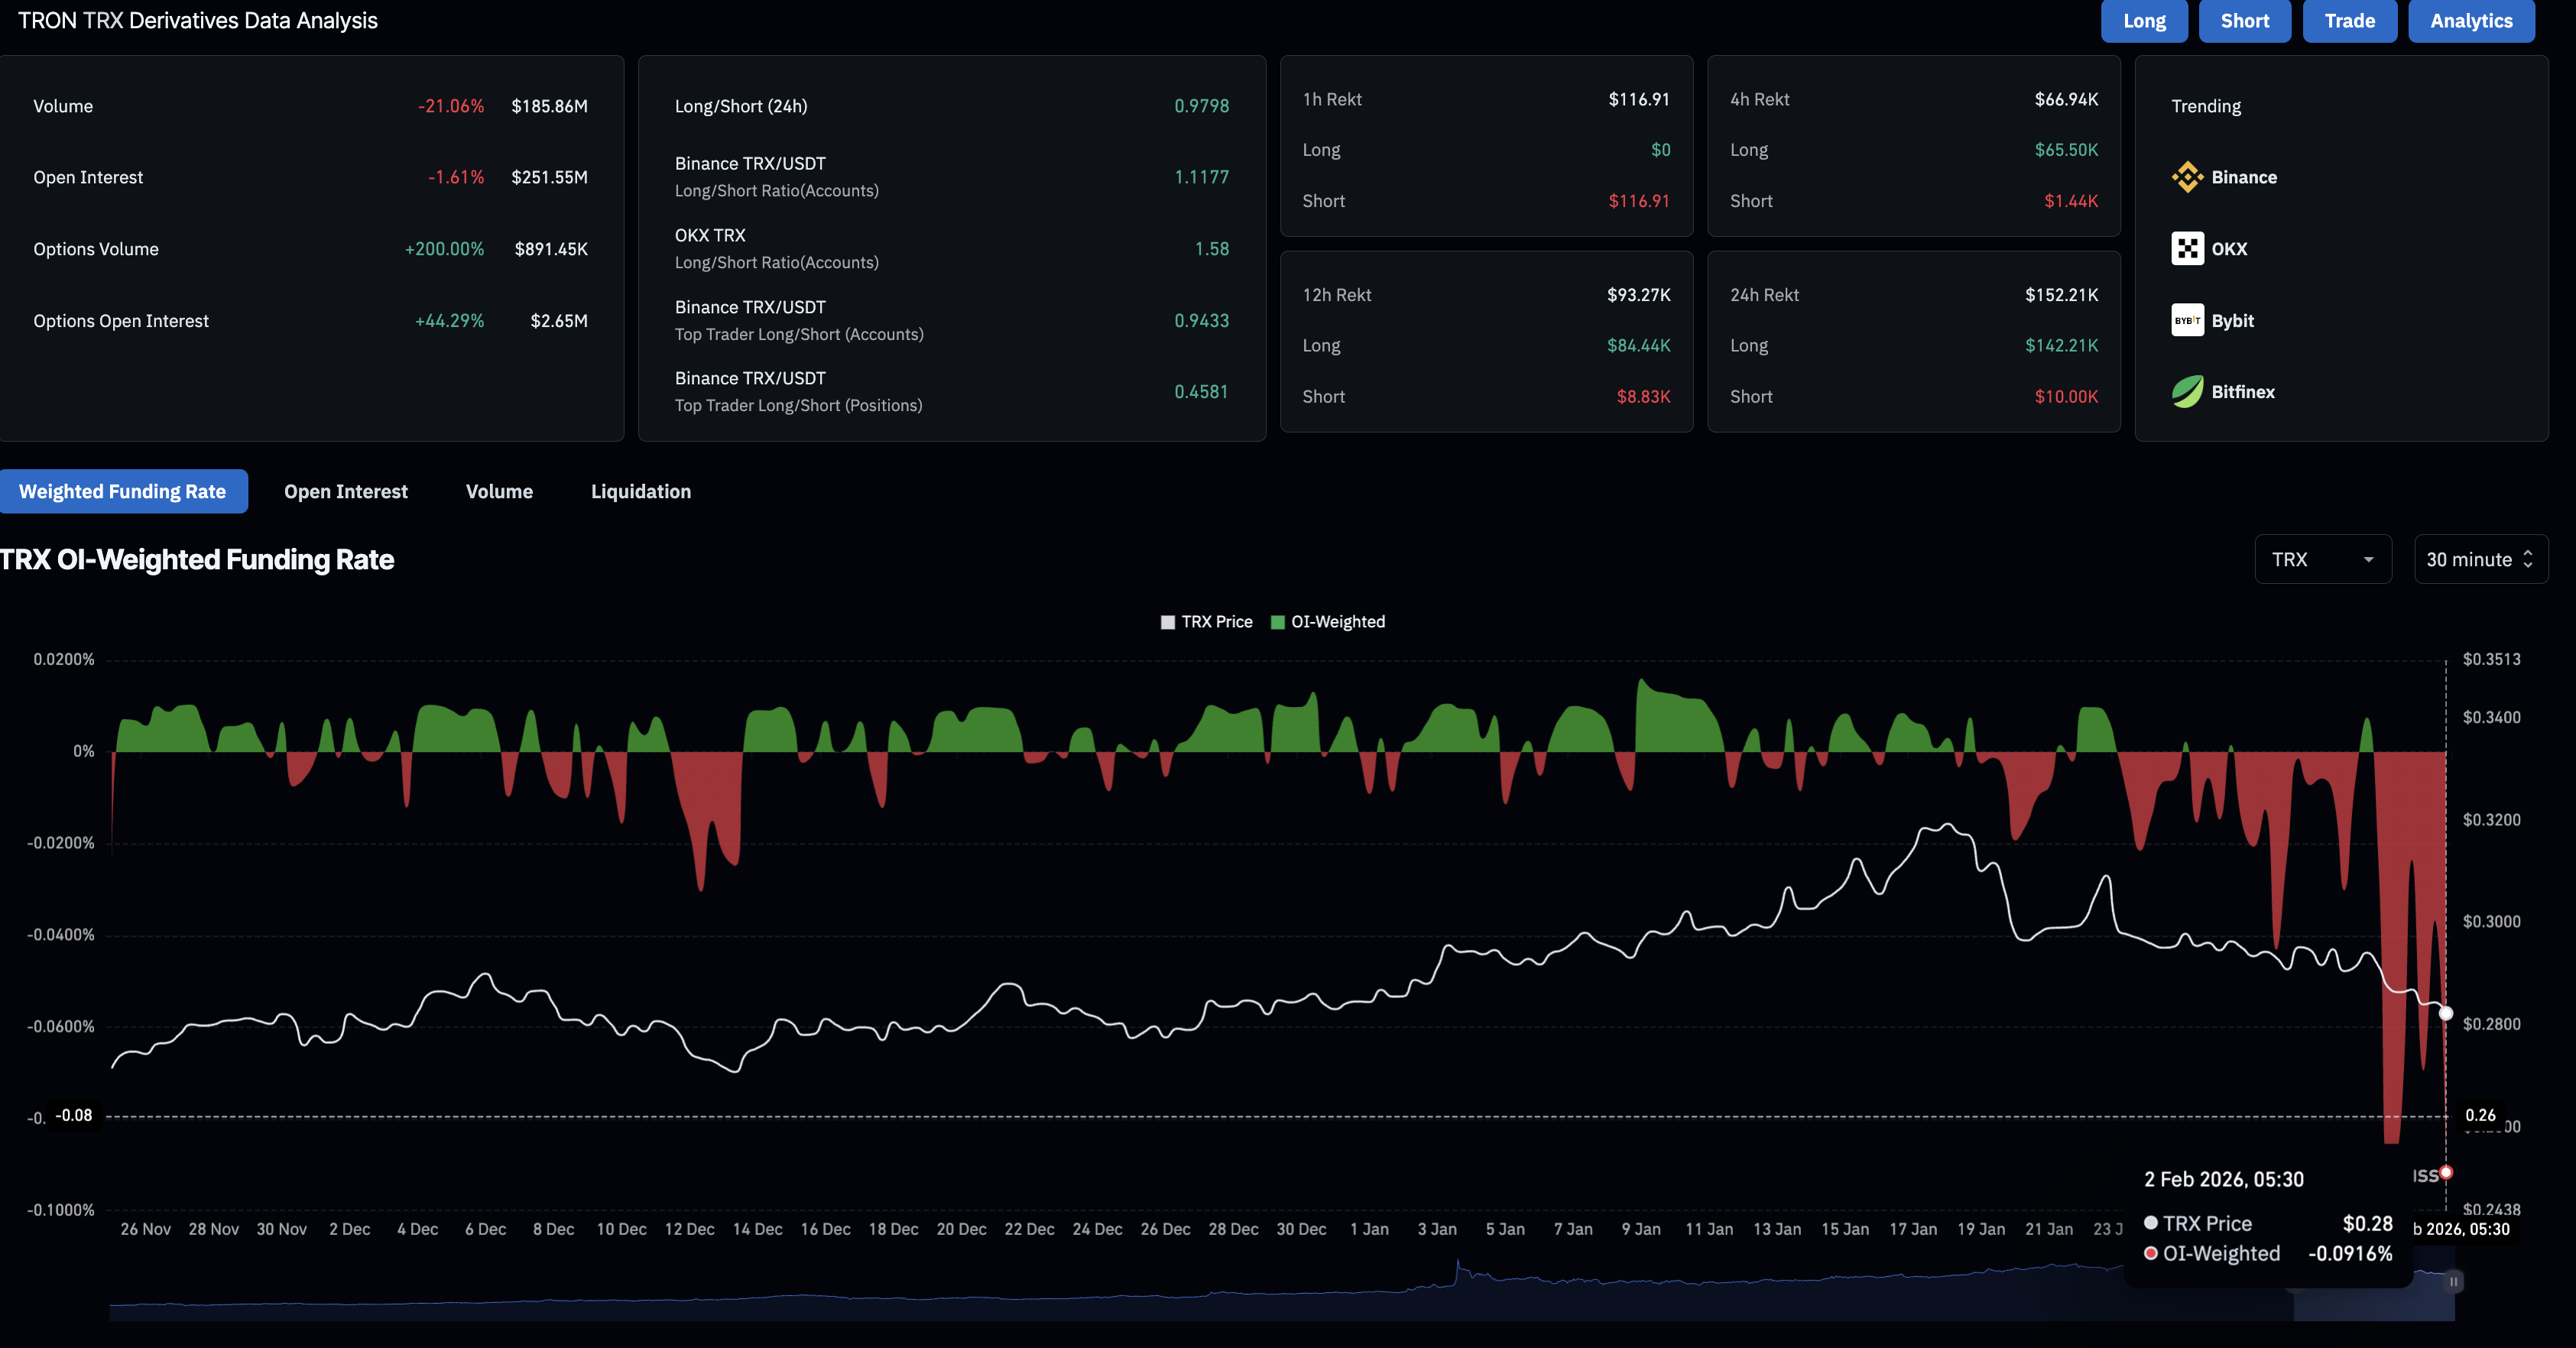
- Derivatives data suggests a significant rise in bearish interest amid massive positional wipeout.
Tron (TRX) remains in a steady decline for the fifth straight day, recording nearly 1% loss on Monday. Tron Inc., formerly SRM Entertainment Inc., acquired roughly 175,000 TRX tokens on Monday, reflecting its buy-the-dip strategy. Still, broader market pressures are shifting risk-off sentiment among altcoin investors, evidenced by bullish positional wipeout and negative funding rates.
Tron Inc’s TRX holding expansion fails to boost retail sentiment
Tron Inc., a TRX-focused Digital Asset Treasury (DAT), acquired 174,740 TRX tokens on Monday at an average price of $0.29 to boost its holdings to over 679 million tokens in total. Typically, a purchase from DAT relieves pressure on retail sentiment, but in the current market, Tron remains under pressure.
On the derivatives side, Tron futures Open Interest (OI) is down 1.61% over the last 24 hours, reaching $251.55 million, indicating reduced trader participation. Meanwhile, the existing trend indicates a bearish trend, as the funding rate is at -0.0916%, suggesting that traders are willing to pay a premium to hold short positions.
Tron risks further decline amid intense selling pressure
Tron trades below $0.2900 at press time on Monday, extending the decline below the 50-day Exponential Moving Average (EMA) at $0.2945 and the 200-day EMA at $0.2954, reinforcing a bearish bias.
The Moving Average Convergence Divergence (MACD) indicator stays below the signal line and under the zero mark on the daily chart, while a widening negative histogram suggests strengthening bearish momentum. The Relative Strength Index (RSI) at 35 on the same time frame indicates rising selling pressure, with the indicator remaining right above the oversold zone.
Looking down, the nearest support for Tron lies at the November 4 low of $0.2764, followed by a deeper zone at $0.2631.
To reinstate an uprising, TRX should reclaim the $0.3000 round figure.
(The technical analysis of this story was written with the help of an AI tool.)

100만 명이 넘는 사용자가 FXStreet를 통해 실시간 시장 데이터, 차트 도구, 전문가 인사이트, 포렉스 뉴스를 이용합니다. 포괄적인 경제 캘린더와 교육 웨비나는 트레이더가 정보를 유지하고 신중한 결정을 내리도록 돕습니다. FXStreet는 바르셀로나 본사와 전 세계 지역에 걸쳐 약 60명의 팀으로 구성되어 있습니다.
더 읽기


