
US core PCE inflation expected to rise in May as Fed rate hike bets increase
작성자 FXStreet Team
수정됨: 25 Jun 2026


인기 기사
The United States (US) Bureau of Economic Analysis (BEA) will publish the Personal Consumption Expenditures (PCE) Price Index data for May on Thursday at 12:30 GMT.
- The core Personal Consumption Expenditures Price Index is forecast to rise 0.3% MoM and 3.4% YoY in May.
- Headline annual PCE inflation is expected to rise to its highest level in three years at 4%.
- Markets see about a 70% chance of the Federal Reserve raising the policy rate at least once by September.
The United States (US) Bureau of Economic Analysis (BEA) will publish the Personal Consumption Expenditures (PCE) Price Index data for May on Thursday at 12:30 GMT.
The PCE Price Index is closely watched by market participants because it is the Federal Reserve’s (Fed) preferred measure of inflation and could influence its policy outlook.
Anticipating the PCE: Insights into the Federal Reserve's key inflation metric
The core PCE Price Index, which excludes volatile food and energy prices, is expected to advance 0.3% month-over-month (MoM) in May, following the 0.2% increase recorded in April.
In the 12 months to May, the core PCE inflation is set to edge higher to 3.4%. Meanwhile, the headline annual PCE inflation is forecast to reach its highest level since May 2023 at 4%.
Markets will scrutinize the PCE Price Index data as Fed officials take this inflation gauge into account when deciding on the next policy move. Although crude Oil prices declined sharply and almost returned to pre-war levels since the United States (US) and Iran reached a framework deal to reopen the Strait of Hormuz, markets remain convinced that the Fed will need to tighten its policy in the second half of the year, given the healthy labor market conditions and the uncertainty regarding how quickly the disinflation process could restart.
According to the CME FedWatch Tool, markets are currently pricing in about a 65% probability that the Fed will raise borrowing costs by at least 25 basis points (bps) by September.
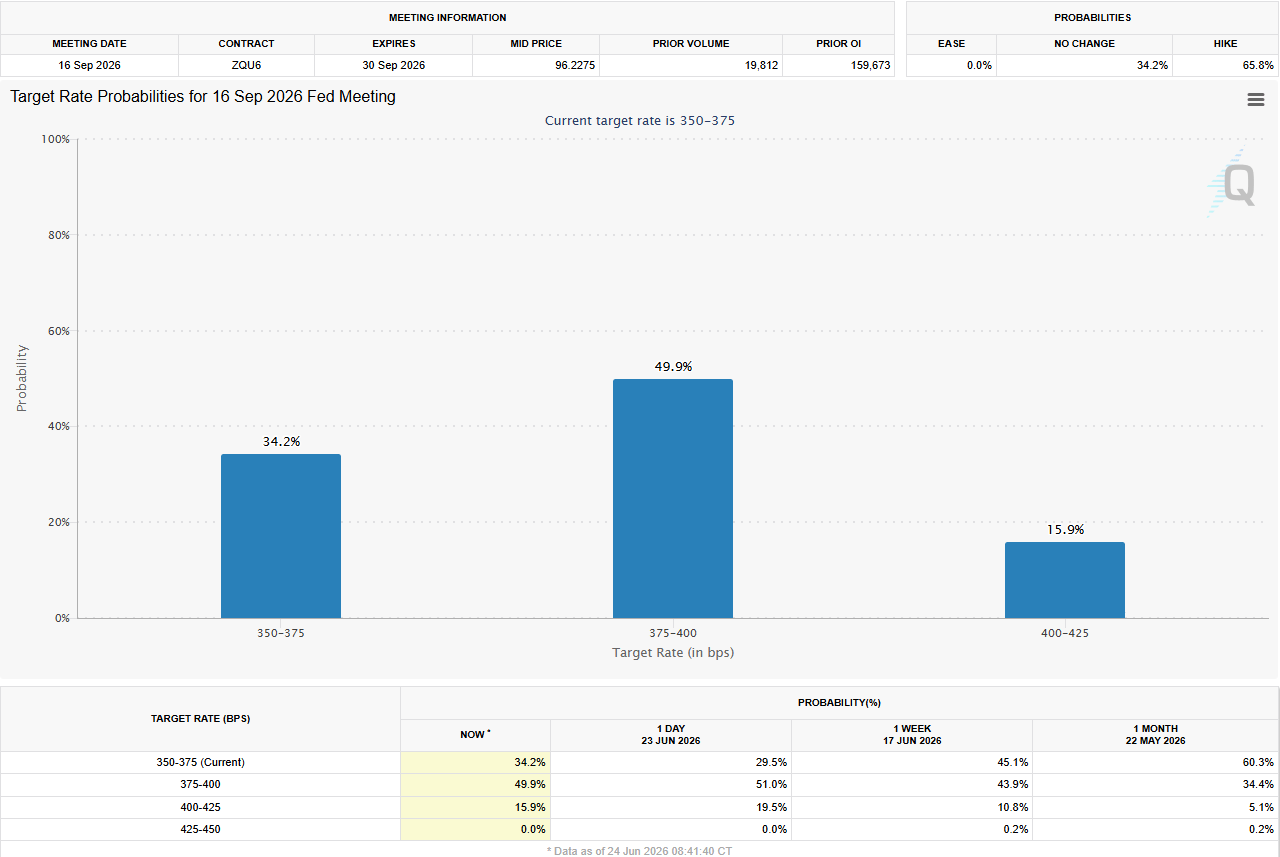
The revised Summary of Economic Projections (SEP), published alongside the monetary policy statement after the June Federal Open Market Committee (FOMC) meeting, showed that policymakers forecast PCE inflation to stand at 3.6% by year-end, and see the core PCE inflation at 3.3%.
Previewing the PCE inflation report, a TD Securities analyst said:
“We expect core PCE prices to show strong services inflation in May despite weak goods prices, as tariff passthrough has largely dissipated. Headline PCE will be higher at 0.49% m/m due to energy prices. Our forecast assumes 0.55% m/m for supercore after a strong PPI for the month. We look for personal spending to grow 0.5%, which reflects a moderation in real terms to 0.0%.”
Economic Indicator
Core Personal Consumption Expenditures - Price Index (MoM)
The Core Personal Consumption Expenditures (PCE), released by the US Bureau of Economic Analysis on a monthly basis, measures the changes in the prices of goods and services purchased by consumers in the United States (US). The PCE Price Index is also the Federal Reserve’s (Fed) preferred gauge of inflation. The MoM figure compares the prices of goods in the reference month to the previous month.The core reading excludes the so-called more volatile food and energy components to give a more accurate measurement of price pressures. Generally, a high reading is bullish for the US Dollar (USD), while a low reading is bearish.
Read more.Next release: Thu Jun 25, 2026 12:30
Frequency: Monthly
Consensus: 0.3%
Previous: 0.2%
Source: US Bureau of Economic Analysis
After publishing the GDP report, the US Bureau of Economic Analysis releases the Personal Consumption Expenditures (PCE) Price Index data alongside the monthly changes in Personal Spending and Personal Income. FOMC policymakers use the annual Core PCE Price Index, which excludes volatile food and energy prices, as their primary gauge of inflation. A stronger-than-expected reading could help the USD outperform its rivals as it would hint at a possible hawkish shift in the Fed’s forward guidance and vice versa.
How will the Personal Consumption Expenditures Price Index affect EUR/USD?
The US Dollar (USD) Index, which gauges the Greenback’s performance against a basket of six major currencies, is up more than 2.5% in June and has recently reached its highest level in over a year, above 101.50. Hawkish revisions seen in the Fed’s SEP, new Fed Chairman Kevin Warsh’s cautious and ambiguous comments on the policy outlook, combined with surprisingly upbeat macroeconomic data releases from the US, fuelled expectations for a Fed rate hike and drove the USD’s latest leg higher.
For markets to shift their view on the Fed policy outlook in a significant way, a softer-than-PCE inflation reading might not be enough. Still, a negative surprise in the monthly core PCE print could limit the USD’s gains and help EUR/USD hold its ground in the immediate term, but such a market reaction is likely to be short-lived. Conversely, a figure of 0.4% or bigger could fuel September Fed rate hike bets and cause EUR/USD to stretch its downtrend.
Eren Sengezer, European Session Lead Analyst at FXStreet, shares a brief technical outlook for EUR/USD:
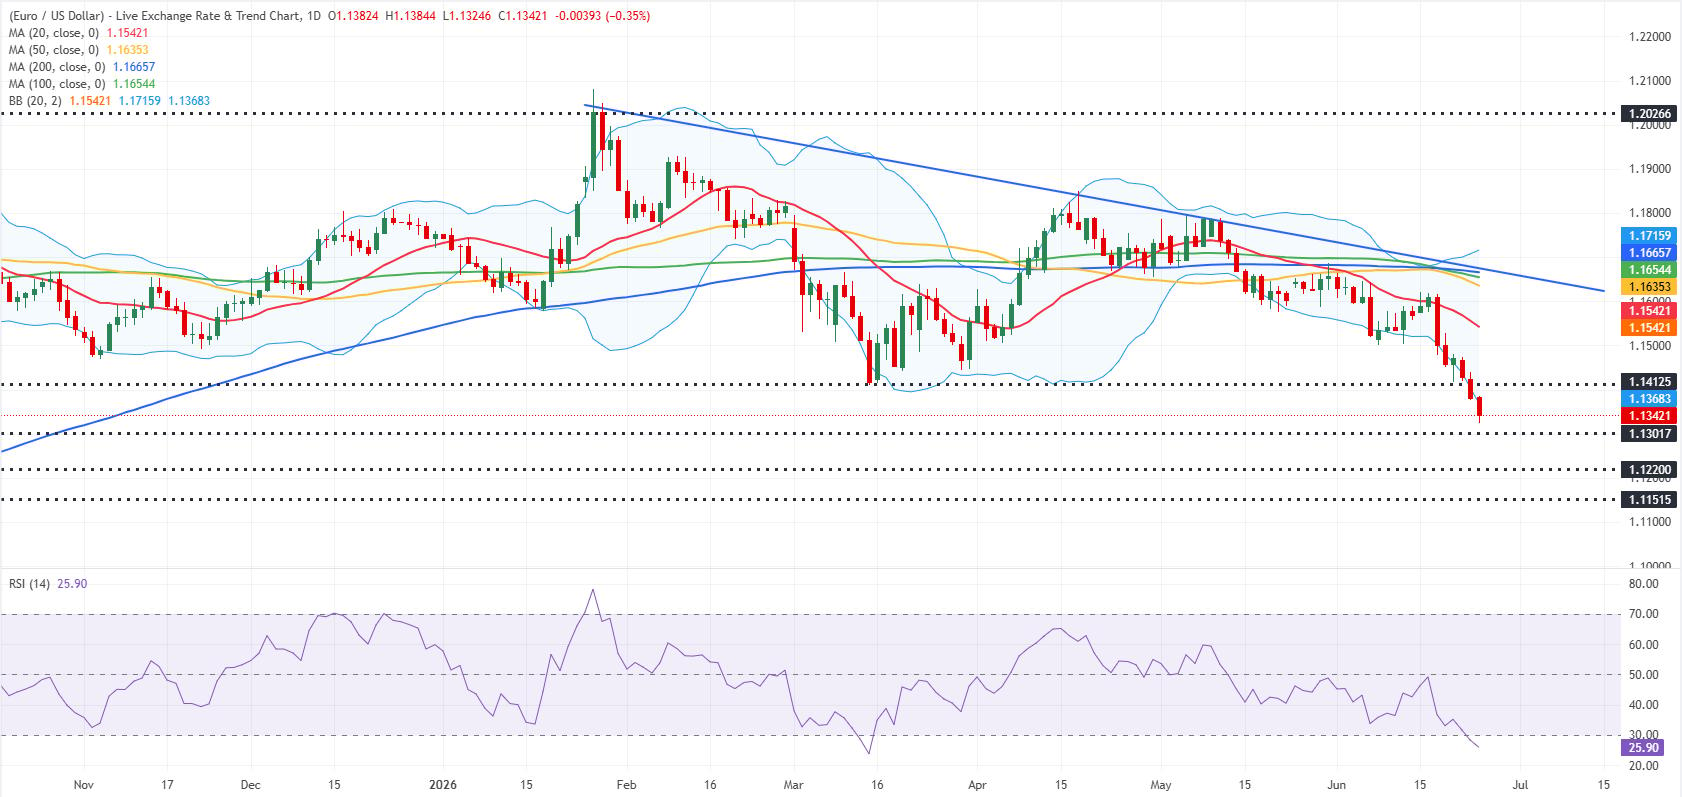
“The near-term technical outlook for EUR/USD reaffirms the bearish stance but highlights oversold conditions. The Relative Strength Index (RSI) indicator on the daily chart stays below 30 and the pair trades slightly below the lower arm of the Bollinger Bands. This setup suggests that there could be a technical correction before there is an extended slide.”
“On the downside, 1.1300 (static level, round level) aligns as the first support level before 1.1220 (static level) and 1.1150 (static level). In case the pair stages a correction, 1.1410/1.1400 (former support level, round level) could be seen as the immediate resistance area ahead of 1.1540 (Bollinger Bands mid-point) and 1.1660-1.1670 (upper arm of the Bollinger Bands, 200-day Simple Moving Average SMA, 100-day SMA).”
Inflation FAQs
Inflation measures the rise in the price of a representative basket of goods and services. Headline inflation is usually expressed as a percentage change on a month-on-month (MoM) and year-on-year (YoY) basis. Core inflation excludes more volatile elements such as food and fuel which can fluctuate because of geopolitical and seasonal factors. Core inflation is the figure economists focus on and is the level targeted by central banks, which are mandated to keep inflation at a manageable level, usually around 2%.
The Consumer Price Index (CPI) measures the change in prices of a basket of goods and services over a period of time. It is usually expressed as a percentage change on a month-on-month (MoM) and year-on-year (YoY) basis. Core CPI is the figure targeted by central banks as it excludes volatile food and fuel inputs. When Core CPI rises above 2% it usually results in higher interest rates and vice versa when it falls below 2%. Since higher interest rates are positive for a currency, higher inflation usually results in a stronger currency. The opposite is true when inflation falls.
Although it may seem counter-intuitive, high inflation in a country pushes up the value of its currency and vice versa for lower inflation. This is because the central bank will normally raise interest rates to combat the higher inflation, which attract more global capital inflows from investors looking for a lucrative place to park their money.
Formerly, Gold was the asset investors turned to in times of high inflation because it preserved its value, and whilst investors will often still buy Gold for its safe-haven properties in times of extreme market turmoil, this is not the case most of the time. This is because when inflation is high, central banks will put up interest rates to combat it. Higher interest rates are negative for Gold because they increase the opportunity-cost of holding Gold vis-a-vis an interest-bearing asset or placing the money in a cash deposit account. On the flipside, lower inflation tends to be positive for Gold as it brings interest rates down, making the bright metal a more viable investment alternative.

100만 명이 넘는 사용자가 FXStreet를 통해 실시간 시장 데이터, 차트 도구, 전문가 인사이트, 포렉스 뉴스를 이용합니다. 포괄적인 경제 캘린더와 교육 웨비나는 트레이더가 정보를 유지하고 신중한 결정을 내리도록 돕습니다. FXStreet는 바르셀로나 본사와 전 세계 지역에 걸쳐 약 60명의 팀으로 구성되어 있습니다.
더 읽기


