
US Dollar Index (DXY) holds gains above 97.00 ahead of FOMC Minutes
작성자 Vishal Chaturvedi
게시일: 18 Feb 2026 | 수정일: 18 Feb 2026


인기 기사

The US Dollar Index (DXY), which tracks the Greenback's value against a basket of six major currencies, holds steady on Wednesday as traders position ahead of key US economic releases. At the time of writing, the index trades near 97.29, up roughly 0.20% on the day.
- The US Dollar Index holds above 97.00 as traders await key US data and FOMC minutes.
- Markets price in nearly 60 bps of Fed easing in 2026, with June seen as the first likely cut.
- Technical outlook shows short-term stabilisation, but broader downtrend remains intact below key SMAs.
The US Dollar Index (DXY), which tracks the Greenback's value against a basket of six major currencies, holds steady on Wednesday as traders position ahead of key US economic releases. At the time of writing, the index trades near 97.29, up roughly 0.20% on the day.
The upcoming data could offer fresh short-term direction for the US Dollar. US Durable Goods Orders fell 1.4% in December, a smaller decline than the 2% expected, following November’s strong 5.4% rise. Excluding Transportation, orders increased 0.9%, up from 0.5% previously.
Traders now turn their attention to Industrial Production data and the FOMC Meeting Minutes due later in the American session
The Greenback is showing signs of stabilisation after the latest US labour data dampened expectations of near-term Fed interest rate cuts. While softer inflation figures have reinforced the view that the Fed could resume monetary policy easing in the second half of the year.
Markets are currently pricing in nearly 60 basis points of easing in 2026, with the first rate cut likely in June, according to the CME FedWatch Tool.
Beyond monetary policy, structural headwinds remain a drag on sentiment, limiting any meaningful recovery attempts in the US Dollar. Major central banks are reducing their USD holdings amid concerns over US President Donald Trump’s protectionist trade policies and attacks on the Fed's independence.
This has weakened confidence in US policy and raised questions about the Dollar’s role as the world’s main reserve currency.
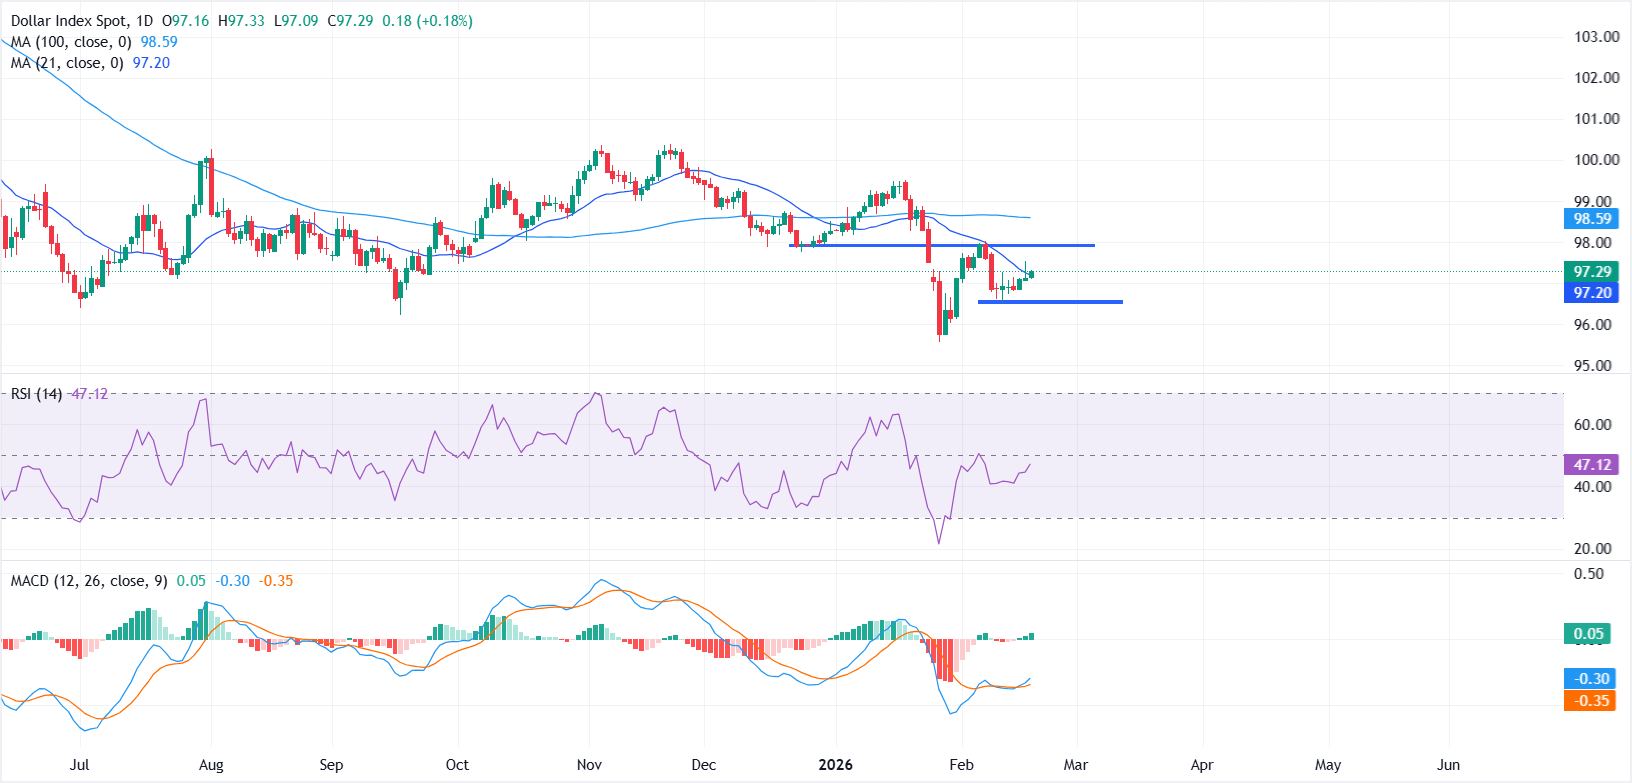
From a technical standpoint, the near-term picture has improved after the US Dollar Index rebounded from four-year lows near 95.56 touched in late January. However, the broader downtrend remains intact as DXY continues to trade below key moving averages.
The 21-day Simple Moving Average (SMA) slides beneath the 100-day SMA, and both trend lower, maintaining a bearish bias. On the upside, the 21-day SMA, currently around 97.19, is capping immediate upside attempts. A sustained move above this level would expose the 98.00 psychological mark, which now acts as support-turned-resistance and remains a key hurdle for bulls.
On the downside, initial support is seen near 96.50. A decisive break below this level could pave the way for a retest of the four-year lows and potentially signal an extension of the prevailing downtrend.
The Moving Average Convergence Divergence (MACD) shows the MACD line nudging above the Signal line near the zero level, with the histogram turning slightly positive, hinting at fading bearish pressure. Meanwhile, the Relative Strength Index (RSI) prints 45.84, below 50, keeping momentum soft.
US Dollar Price Today
The table below shows the percentage change of US Dollar (USD) against listed major currencies today. US Dollar was the strongest against the New Zealand Dollar.
| USD | EUR | GBP | JPY | CAD | AUD | NZD | CHF | |
|---|---|---|---|---|---|---|---|---|
| USD | 0.09% | -0.05% | 0.29% | 0.10% | 0.22% | 0.87% | 0.08% | |
| EUR | -0.09% | -0.14% | 0.20% | 0.02% | 0.13% | 0.79% | -0.01% | |
| GBP | 0.05% | 0.14% | 0.31% | 0.15% | 0.26% | 0.92% | 0.13% | |
| JPY | -0.29% | -0.20% | -0.31% | -0.17% | -0.05% | 0.59% | -0.19% | |
| CAD | -0.10% | -0.02% | -0.15% | 0.17% | 0.12% | 0.77% | -0.02% | |
| AUD | -0.22% | -0.13% | -0.26% | 0.05% | -0.12% | 0.66% | -0.13% | |
| NZD | -0.87% | -0.79% | -0.92% | -0.59% | -0.77% | -0.66% | -0.79% | |
| CHF | -0.08% | 0.00% | -0.13% | 0.19% | 0.02% | 0.13% | 0.79% |
The heat map shows percentage changes of major currencies against each other. The base currency is picked from the left column, while the quote currency is picked from the top row. For example, if you pick the US Dollar from the left column and move along the horizontal line to the Japanese Yen, the percentage change displayed in the box will represent USD (base)/JPY (quote).

100만 명이 넘는 사용자가 FXStreet를 통해 실시간 시장 데이터, 차트 도구, 전문가 인사이트, 포렉스 뉴스를 이용합니다. 포괄적인 경제 캘린더와 교육 웨비나는 트레이더가 정보를 유지하고 신중한 결정을 내리도록 돕습니다. FXStreet는 바르셀로나 본사와 전 세계 지역에 걸쳐 약 60명의 팀으로 구성되어 있습니다.
더 읽기


