
US Dollar Index Price Forecast: Tests descending channel top near 98.50
작성자 Akhtar Faruqui
수정됨: 13 May 2026


인기 기사

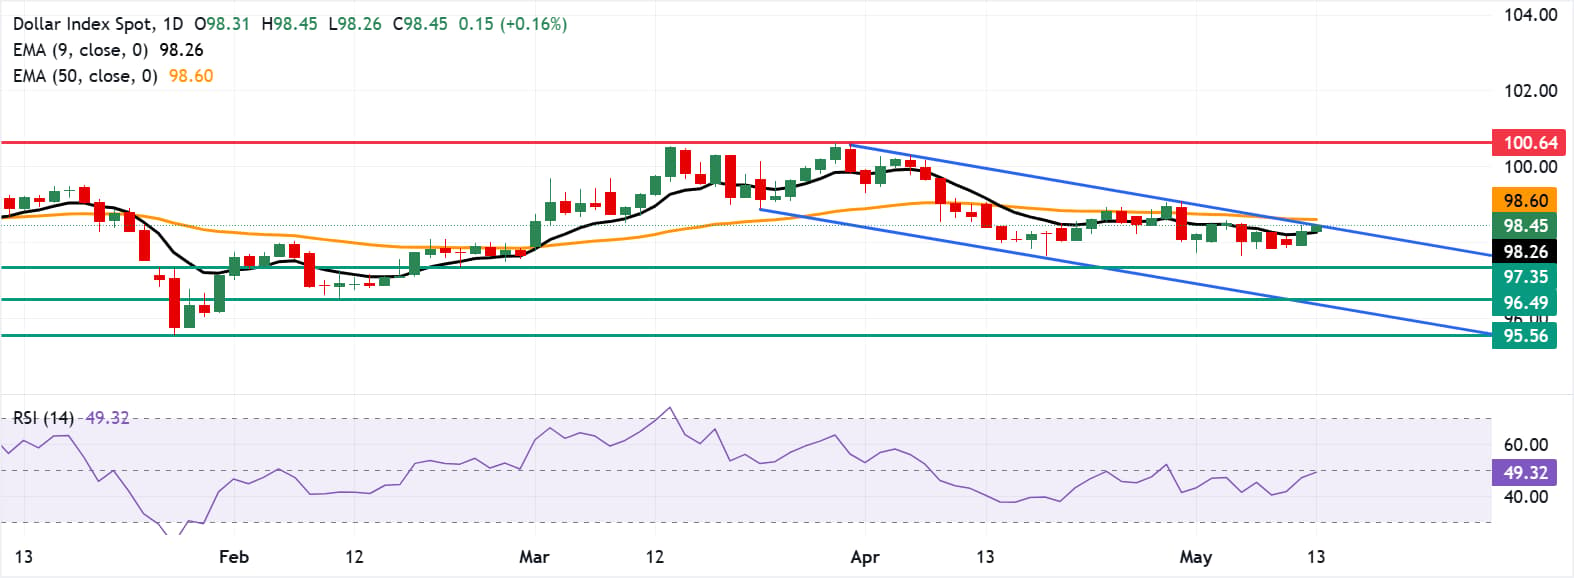
The US Dollar Index (DXY), which measures the value of the US Dollar (USD) against six major currencies, is extending its gains for the second successive day, trading around 98.40 during the European hours on Wednesday.
- US Dollar Index tests the upper boundary of the descending channel around 98.50.
- The 14-day Relative Strength Index sits near 48.9, indicating neutral momentum.
- The primary support appears at the nine-day EMA of 98.26.
The US Dollar Index (DXY), which measures the value of the US Dollar (USD) against six major currencies, is extending its gains for the second successive day, trading around 98.40 during the European hours on Wednesday. The technical analysis of the daily chart indicates a potential bullish reversal, as the dollar index tests the upper boundary of the descending channel.
The near-term tone is neutral but mildly capped, as the US Dollar Index holds above the short-term nine-period Exponential Moving Average (EMA) but remains below the 50-period EMA, hinting at a range-bound bias within a broader consolidation.
The Relative Strength Index (14) hovers just below the 50 mark near 48.9, suggesting subdued momentum and limiting directional conviction while the index oscillates between these key moving averages.
The US Dollar Index is testing the upper descending channel boundary around 98.50, followed by the 50-day EMA at 98.60. A break above the channel would lead the dollar index to explore the region around nearly a 12-month high of 100.64, which was recorded on March 31.
On the downside, the immediate support lies at the nine-day EMA of 98.26, followed by the 12-week low of 97.35, recorded on February 23. The US Dollar Index may further fall toward the three-month low of 96.49, followed by the lower boundary of the descending channel around 96.40. Further declines below the channel would expose the 95.56, the lowest since February 2022, which was reached on January 27.
(The technical analysis of this story was written with the help of an AI tool.)
US Dollar Price Today
The table below shows the percentage change of US Dollar (USD) against listed major currencies today. US Dollar was the strongest against the New Zealand Dollar.
| USD | EUR | GBP | JPY | CAD | AUD | NZD | CHF | |
|---|---|---|---|---|---|---|---|---|
| USD | 0.22% | 0.10% | 0.11% | 0.09% | 0.06% | 0.27% | 0.14% | |
| EUR | -0.22% | -0.13% | -0.13% | -0.16% | -0.17% | 0.05% | -0.10% | |
| GBP | -0.10% | 0.13% | 0.00% | -0.02% | -0.03% | 0.20% | 0.03% | |
| JPY | -0.11% | 0.13% | 0.00% | -0.02% | -0.04% | 0.15% | 0.04% | |
| CAD | -0.09% | 0.16% | 0.02% | 0.02% | -0.03% | 0.19% | 0.04% | |
| AUD | -0.06% | 0.17% | 0.03% | 0.04% | 0.03% | 0.23% | 0.07% | |
| NZD | -0.27% | -0.05% | -0.20% | -0.15% | -0.19% | -0.23% | -0.16% | |
| CHF | -0.14% | 0.10% | -0.03% | -0.04% | -0.04% | -0.07% | 0.16% |
The heat map shows percentage changes of major currencies against each other. The base currency is picked from the left column, while the quote currency is picked from the top row. For example, if you pick the US Dollar from the left column and move along the horizontal line to the Japanese Yen, the percentage change displayed in the box will represent USD (base)/JPY (quote).

100만 명이 넘는 사용자가 FXStreet를 통해 실시간 시장 데이터, 차트 도구, 전문가 인사이트, 포렉스 뉴스를 이용합니다. 포괄적인 경제 캘린더와 교육 웨비나는 트레이더가 정보를 유지하고 신중한 결정을 내리도록 돕습니다. FXStreet는 바르셀로나 본사와 전 세계 지역에 걸쳐 약 60명의 팀으로 구성되어 있습니다.
더 읽기


