
USD/CAD Price Forecast: Tests 1.3700 support near moving averages
작성자 Akhtar Faruqui
게시일: 23 Mar 2026 | 수정일: 23 Mar 2026


인기 기사

USD/CAD continues to lose ground for the second successive session, trading around 1.3710 during the Asian hours on Monday.
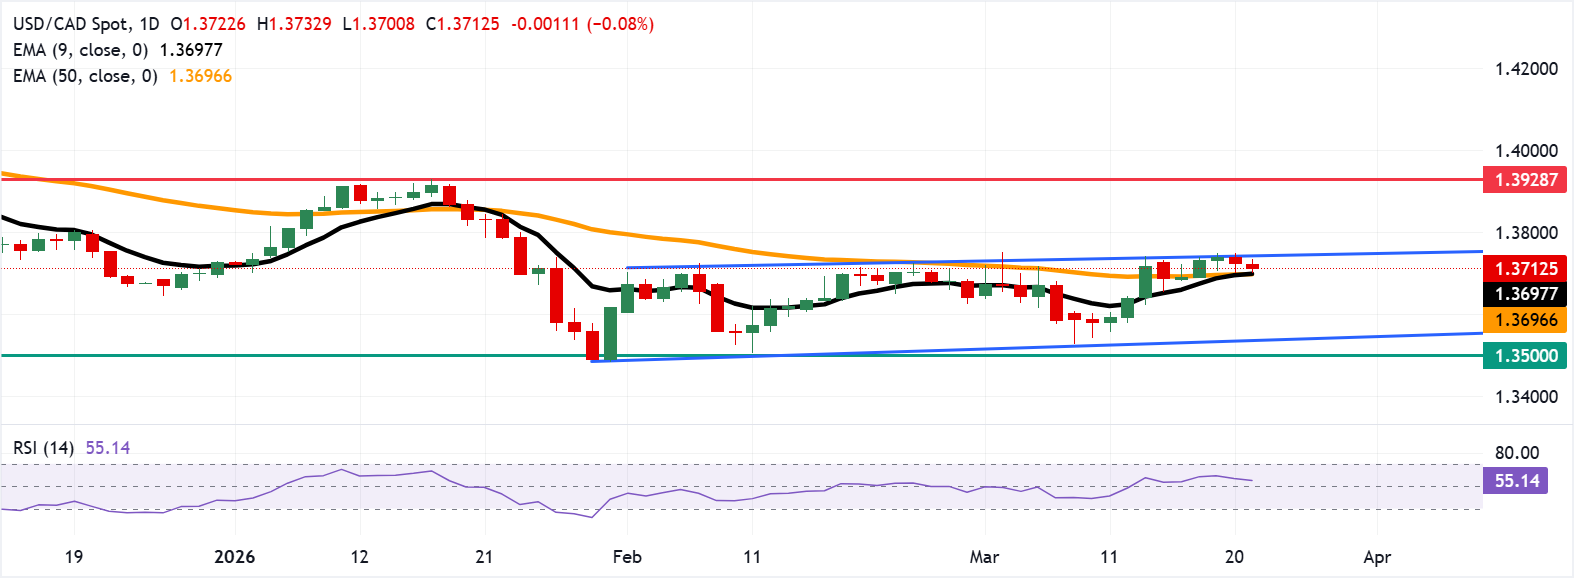
- USD/CAD could test the upper rectangle channel boundary around 1.3750.
- The 14-day Relative Strength Index holds in the mid-50s, signaling strengthening buying pressure.
- The immediate support lies at the 1.3700 psychological level, aligned with the nine- and 50-day EMAs.
USD/CAD continues to lose ground for the second successive session, trading around 1.3710 during the Asian hours on Monday. The near-term bias holds mildly bullish as spot advances above the nine- and 50-day Exponential Moving Average (EMA), indicating an emerging upward correction within a broader range.
Momentum supports this bid tone, with the 14-day Relative Strength Index (RSI) holding in the mid-50s after recovering from sub-40 readings, signalling improving buying pressure rather than overbought conditions.
The technical analysis of the daily chart shows the USD/CAD pair remaining close to the upper boundary of the rectangle channel pattern around 1.3750. A successful break above the channel would offer confirmation of a bullish bias and support the pair to target the three-month high of 1.3928, recorded on January 16.
On the downside, the immediate support lies at the psychological level of 1.3700, aligned with the nine- and 50-day EMAs of 1.3697 and 1.3696, respectively. Further declines below these averages would put downward pressure on the USD/CAD pair to navigate the region around the lower boundary of rectangle 1.3540.
(The technical analysis of this story was written with the help of an AI tool.)
Canadian Dollar Price Today
The table below shows the percentage change of Canadian Dollar (CAD) against listed major currencies today. Canadian Dollar was the strongest against the Australian Dollar.
| USD | EUR | GBP | JPY | CAD | AUD | NZD | CHF | |
|---|---|---|---|---|---|---|---|---|
| USD | 0.21% | 0.16% | 0.08% | -0.11% | 0.63% | 0.45% | 0.15% | |
| EUR | -0.21% | -0.06% | -0.11% | -0.33% | 0.53% | 0.23% | -0.07% | |
| GBP | -0.16% | 0.06% | -0.06% | -0.27% | 0.59% | 0.29% | -0.02% | |
| JPY | -0.08% | 0.11% | 0.06% | -0.18% | 0.54% | 0.29% | 0.06% | |
| CAD | 0.11% | 0.33% | 0.27% | 0.18% | 0.71% | 0.42% | 0.22% | |
| AUD | -0.63% | -0.53% | -0.59% | -0.54% | -0.71% | -0.29% | -0.47% | |
| NZD | -0.45% | -0.23% | -0.29% | -0.29% | -0.42% | 0.29% | -0.26% | |
| CHF | -0.15% | 0.07% | 0.02% | -0.06% | -0.22% | 0.47% | 0.26% |
The heat map shows percentage changes of major currencies against each other. The base currency is picked from the left column, while the quote currency is picked from the top row. For example, if you pick the Canadian Dollar from the left column and move along the horizontal line to the US Dollar, the percentage change displayed in the box will represent CAD (base)/USD (quote).

100만 명이 넘는 사용자가 FXStreet를 통해 실시간 시장 데이터, 차트 도구, 전문가 인사이트, 포렉스 뉴스를 이용합니다. 포괄적인 경제 캘린더와 교육 웨비나는 트레이더가 정보를 유지하고 신중한 결정을 내리도록 돕습니다. FXStreet는 바르셀로나 본사와 전 세계 지역에 걸쳐 약 60명의 팀으로 구성되어 있습니다.
더 읽기


