
USD/CHF declines as soft US data and bearish technicals weigh on pair
작성자 Christian Borjon Valencia
게시일: 13 Feb 2026 | 수정일: 13 Feb 2026


인기 기사

The Swiss Franc (CHF) continued to appreciate against the US Dollar (USD) on Thursday, following a slightly soft US jobs report overshadowed by Wednesday’s Nonfarm Payrolls print. Despite this, the Greenback has failed to rally and USD/CHF trades at 0.7700, down 0.22%.
- USD/CHF drifts lower as soft US jobless claims data caps Dollar recovery after strong NFP.
- Technical bias remains bearish, with RSI aligned to signal sustained downside momentum.
- A break below 0.7600 exposes 0.7550 and 0.7500, while rebounds face resistance near 0.7780.
The Swiss Franc (CHF) continued to appreciate against the US Dollar (USD) on Thursday, following a slightly soft US jobs report overshadowed by Wednesday’s Nonfarm Payrolls print. Despite this, the Greenback has failed to rally and USD/CHF trades at 0.7700, down 0.22%.
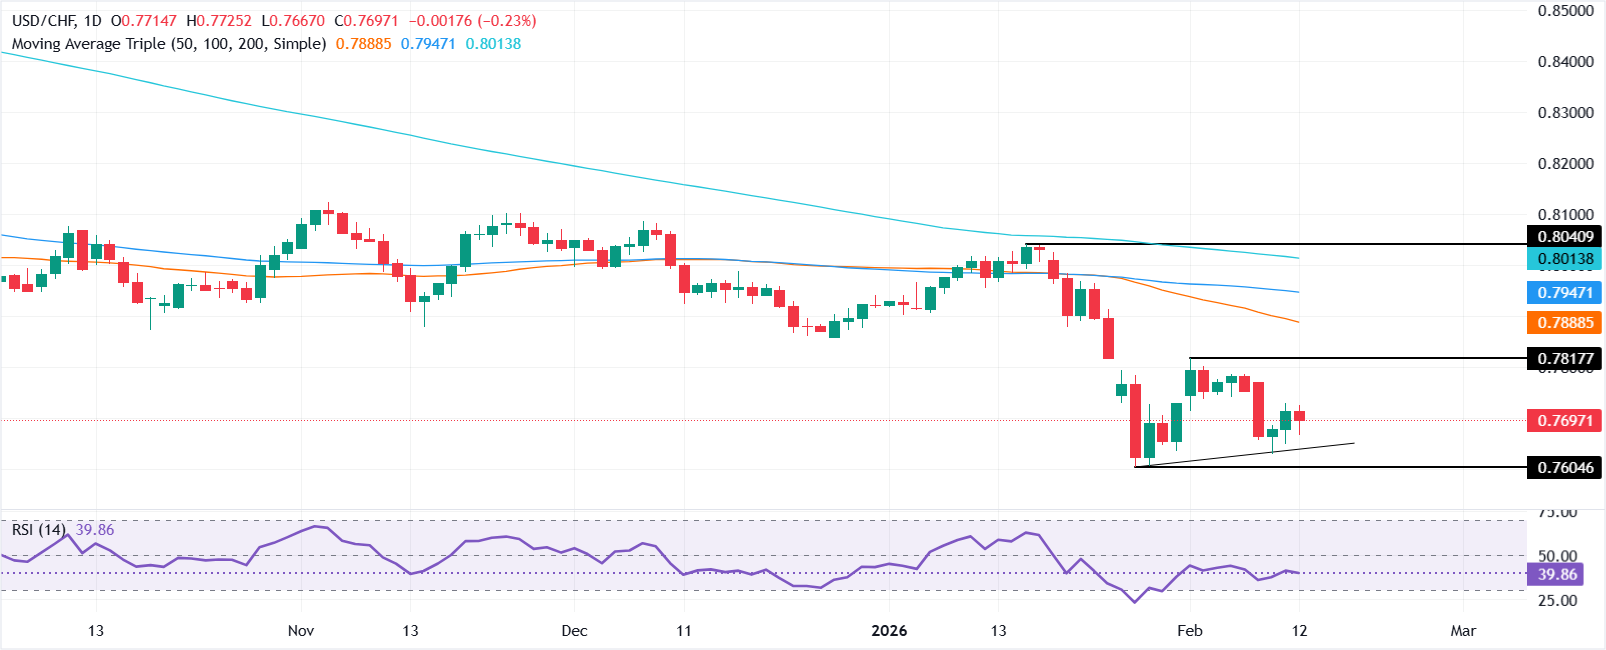
USD/CHF Price Forecast: Technical outlook
The technical picture shows USD/CHF is downward biased, with momentum in sync as depicted by the Relative Strength Index (RSI).
Although USD/CHF bottomed out at around 0.7600 and recovered towards 0.7800, the pair has already registered a lower high, paving the way for further downside. Since peaking, the pair edged towards 0.7627 before resuming its upward trend and for the last three trading days, it has consolidated within 0.7600-0.7700.
For a bearish continuation, sellers must clear 0.7600, which could open the door for further downside. The first key support level would be 0.7550, followed by 0.7500.
Conversely, if USD/CHF surpasses 0.7700, the first resistance would be the 20-day Simple Moving Average (SMA) at 0.7780. A breach of the latter will expose 0.7800, followed by the December 24 daily low turned resistance at 0.7861. Up next lies 0.7900.
USD/CHF Daily Chart
US Dollar Price Today
The table below shows the percentage change of US Dollar (USD) against listed major currencies today. US Dollar was the strongest against the Australian Dollar.
| USD | EUR | GBP | JPY | CAD | AUD | NZD | CHF | |
|---|---|---|---|---|---|---|---|---|
| USD | 0.02% | -0.01% | -0.21% | 0.27% | 0.40% | 0.19% | -0.23% | |
| EUR | -0.02% | -0.03% | -0.22% | 0.25% | 0.37% | 0.17% | -0.25% | |
| GBP | 0.01% | 0.03% | -0.19% | 0.29% | 0.41% | 0.20% | -0.22% | |
| JPY | 0.21% | 0.22% | 0.19% | 0.47% | 0.60% | 0.36% | -0.02% | |
| CAD | -0.27% | -0.25% | -0.29% | -0.47% | 0.13% | -0.09% | -0.50% | |
| AUD | -0.40% | -0.37% | -0.41% | -0.60% | -0.13% | -0.20% | -0.62% | |
| NZD | -0.19% | -0.17% | -0.20% | -0.36% | 0.09% | 0.20% | -0.42% | |
| CHF | 0.23% | 0.25% | 0.22% | 0.02% | 0.50% | 0.62% | 0.42% |
The heat map shows percentage changes of major currencies against each other. The base currency is picked from the left column, while the quote currency is picked from the top row. For example, if you pick the US Dollar from the left column and move along the horizontal line to the Japanese Yen, the percentage change displayed in the box will represent USD (base)/JPY (quote).

100만 명이 넘는 사용자가 FXStreet를 통해 실시간 시장 데이터, 차트 도구, 전문가 인사이트, 포렉스 뉴스를 이용합니다. 포괄적인 경제 캘린더와 교육 웨비나는 트레이더가 정보를 유지하고 신중한 결정을 내리도록 돕습니다. FXStreet는 바르셀로나 본사와 전 세계 지역에 걸쳐 약 60명의 팀으로 구성되어 있습니다.
더 읽기


