
USD/CHF Price Forecast: Bearish risks rise below 0.8000 as momentum indicators turn negative
작성자 Vishal Chaturvedi
수정됨: 13 Apr 2026


인기 기사

USD/CHF edges lower on Monday but lacks follow-through selling as escalating US-Iran tensions and growing expectations that the Federal Reserve (Fed) will keep interest rates higher for longer, driven by rising Oil prices, help limit downside in the US Dollar (USD).
- USD/CHF edges lower but downside remains limited amid US-Iran tensions and Oil-driven inflation risks.
- Technically, USD/CHF is testing the 100-day SMA after failing to hold above 0.8000.
- Momentum indicators weaken, with RSI below 50 and MACD turning negative.
USD/CHF edges lower on Monday but lacks follow-through selling as escalating US-Iran tensions and growing expectations that the Federal Reserve (Fed) will keep interest rates higher for longer, driven by rising Oil prices, help limit downside in the US Dollar (USD). At the same time, the Swiss Franc (CHF) struggles to attract strong demand as the Swiss National Bank’s readiness to act against excessive currency strength keeps investors cautious.
At the time of writing, USD/CHF is trading around 0.7876, down 0.13% on the day. Meanwhile, the US Dollar Index (DXY), which tracks the Greenback’s value against a basket of six major currencies, is hovering near 98.78 after opening the week with a gap higher toward the 99.00 level.
On the geopolitical front, US President Donald Trump has ordered a naval blockade targeting Iranian ports after US-Iran talks over the weekend concluded without a breakthrough, raising concerns about a prolonged conflict. Iran’s Islamic Revolutionary Guard Corps (IRGC) warned that any military vessels approaching the Strait of Hormuz would be seen as a ceasefire breach and could face a strong response.
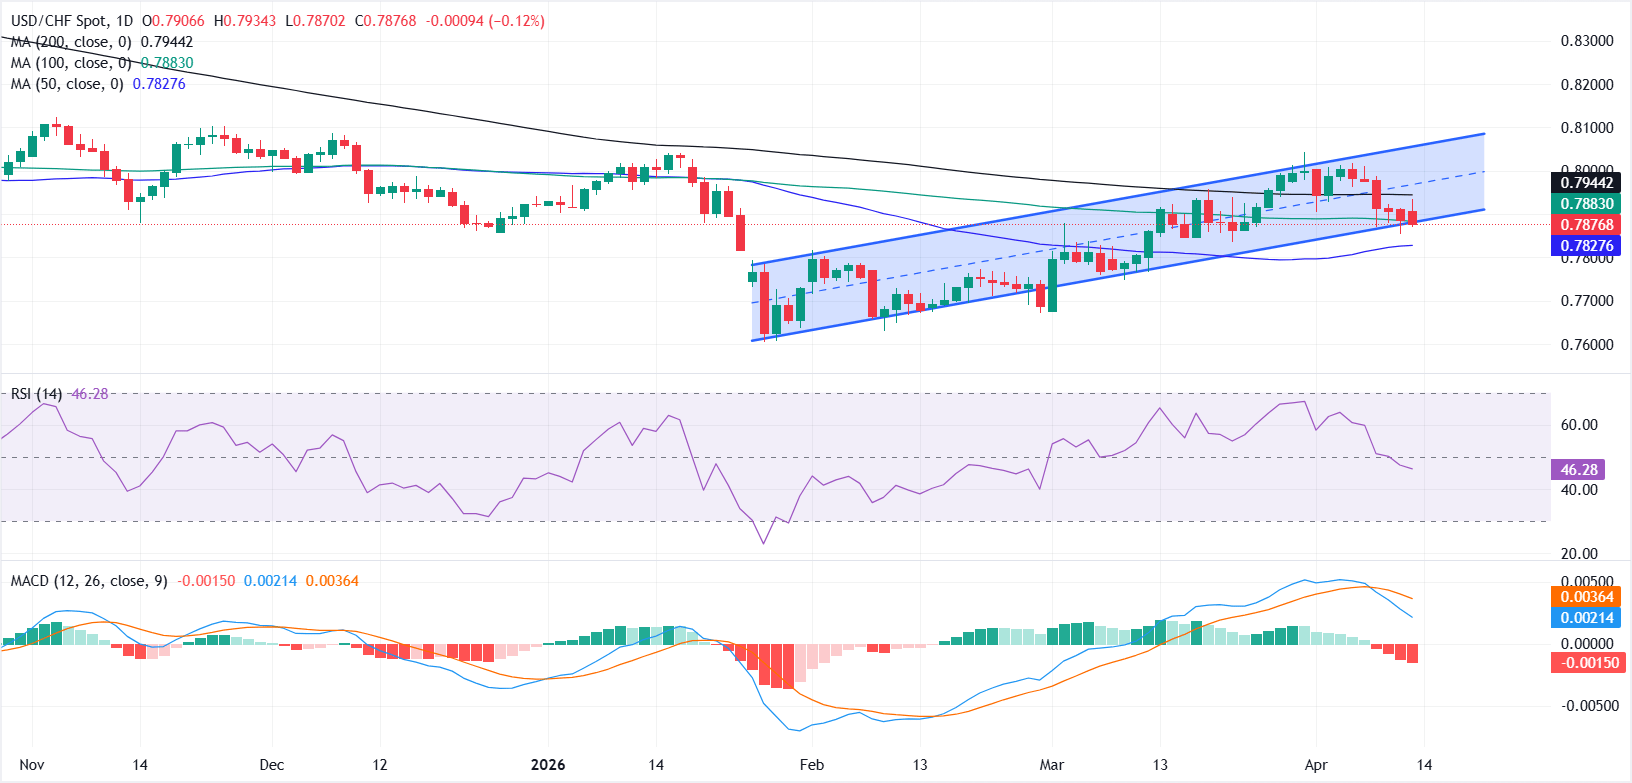
From a technical perspective, USD/CHF is trading within an upward-sloping parallel channel on the daily chart, with price now hovering near the lower boundary, which closely aligns with the 100-day Simple Moving Average (SMA) at 0.7883. This increases the risk of a breakdown after buyers failed to sustain gains above the 0.8000 psychological level.
A decisive break below the channel support or the 100-day SMA could expose the 50-day SMA at 0.7827 as the next support, followed by the March 10 low near 0.7748.
On the upside, the 200-day SMA at 0.7944 acts as immediate resistance, ahead of the upper boundary of the channel near the 0.8000 psychological mark. A sustained move above 0.8000 is needed to confirm renewed bullish momentum.
Momentum indicators suggest fading upside pressure. The Relative Strength Index (RSI) has slipped below the 50 mark, indicating weakening bullish momentum, while the Moving Average Convergence Divergence (MACD) is turning lower, with the histogram dipping into negative territory hinting that bearish momentum is beginning to build.
Swiss Franc Price Today
The table below shows the percentage change of Swiss Franc (CHF) against listed major currencies today. Swiss Franc was the strongest against the Japanese Yen.
| USD | EUR | GBP | JPY | CAD | AUD | NZD | CHF | |
|---|---|---|---|---|---|---|---|---|
| USD | 0.11% | 0.04% | 0.30% | -0.20% | 0.06% | -0.07% | -0.24% | |
| EUR | -0.11% | -0.09% | 0.17% | -0.31% | -0.07% | -0.18% | -0.31% | |
| GBP | -0.04% | 0.09% | 0.24% | -0.25% | 0.02% | -0.10% | -0.27% | |
| JPY | -0.30% | -0.17% | -0.24% | -0.53% | -0.27% | -0.39% | -0.49% | |
| CAD | 0.20% | 0.31% | 0.25% | 0.53% | 0.30% | 0.15% | -0.03% | |
| AUD | -0.06% | 0.07% | -0.02% | 0.27% | -0.30% | -0.11% | -0.22% | |
| NZD | 0.07% | 0.18% | 0.10% | 0.39% | -0.15% | 0.11% | -0.14% | |
| CHF | 0.24% | 0.31% | 0.27% | 0.49% | 0.03% | 0.22% | 0.14% |
The heat map shows percentage changes of major currencies against each other. The base currency is picked from the left column, while the quote currency is picked from the top row. For example, if you pick the Swiss Franc from the left column and move along the horizontal line to the US Dollar, the percentage change displayed in the box will represent CHF (base)/USD (quote).

100만 명이 넘는 사용자가 FXStreet를 통해 실시간 시장 데이터, 차트 도구, 전문가 인사이트, 포렉스 뉴스를 이용합니다. 포괄적인 경제 캘린더와 교육 웨비나는 트레이더가 정보를 유지하고 신중한 결정을 내리도록 돕습니다. FXStreet는 바르셀로나 본사와 전 세계 지역에 걸쳐 약 60명의 팀으로 구성되어 있습니다.
더 읽기


